

The DOI matches its Crossref record; 79 of the 79 references it cites were found in a registry or an index.
Lower synaptic density is associated with depression severity and network alterations
Open accessAbstract
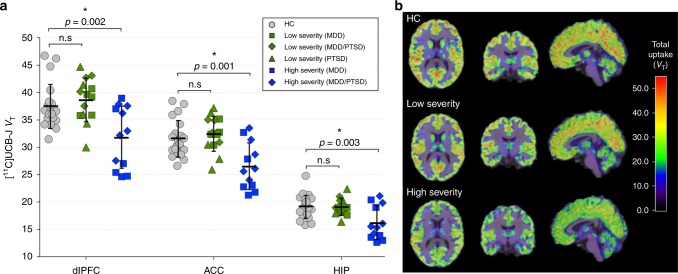
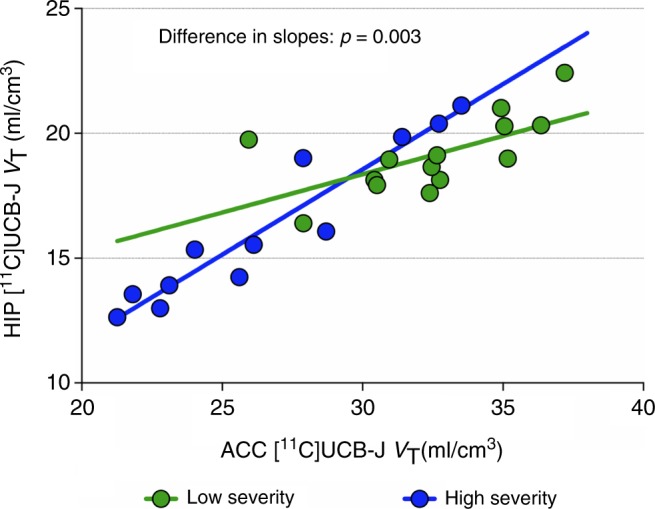
Synaptic loss and deficits in functional connectivity are hypothesized to contribute to symptoms associated with major depressive disorder (MDD) and post-traumatic stress disorder (PTSD). The synaptic vesicle glycoprotein 2A (SV2A) can be used to index the number of nerve terminals, an indirect estimate of synaptic density. Here, we used positron emission tomography (PET) with the SV2A radioligand [ 11 C]UCB-J to examine synaptic density in n = 26 unmedicated individuals with MDD, PTSD, or comorbid MDD/PTSD. The severity of depressive symptoms was inversely correlated with SV2A density, and individuals with high levels of depression showing lower SV2A density compared to healthy controls ( n = 21). SV2A density was also associated with aberrant network function, as measured by magnetic resonance imaging (MRI) functional connectivity. This is the first in vivo evidence linking lower synaptic density to network alterations and symptoms of depression. Our findings provide further incentive to evaluate interventions that restore synaptic connections to treat depression.
Overview
The claims and statistics of this paper haven’t been checked yet.
Free: it reads the open-access text and checks the first 5 claims that cite a source we can check. Create a free account to check every claim.
Integrity signals
Registry
Cites
Statistics
Figures


Verification
Claims the paper makes
The claims and statistics of this paper haven’t been checked yet.
Free: it reads the open-access text and checks the first 5 claims that cite a source we can check. Create a free account to check every claim.
Claims other papers make about this one
Each is checked against this paper’s own text: does it say what the citing paper says it does?
The cited source doesn’t support the claim as written.
In the citing paper
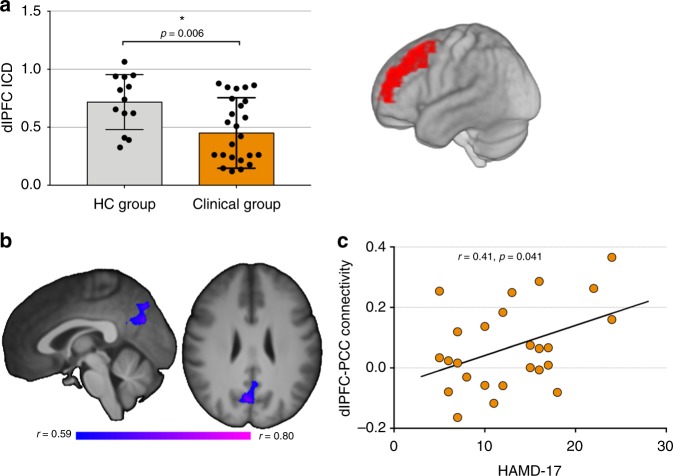
“It was found that the dlPFC-posterior cingulate cortex connection was inversely negatively linked to the severity of depression symptoms and connected with synapse activity in the dlPFC, indicating that synaptic loss may impair antagonistism within the centers of both networks, which are typically at odds. 474”
From Major depressive disorder: hypothesis, mechanism, prevention and treatment (2024) · cites this paper as [474]
Checked by a reasoning model — may be wrong.
Experimental — accuracy not yet measuredThe source backs part of the claim, not all of it — or backs it for a different population, condition or comparison.
In the citing paper
“Additionally, it was shown that compared with healthy subjects, subjects with MDD had reduced dlPFC resting-state connectivity throughout the brain.”
From Major depressive disorder: hypothesis, mechanism, prevention and treatment (2024) · cites this paper as [474]
Experimental — accuracy not yet measuredThe source backs part of the claim, not all of it — or backs it for a different population, condition or comparison.
In the citing paper
“They reported lower distribution volumes (VT, representing specific and unspecific binding) of 11C-UCB-J in the depressed group within the hippocampus, anterior cingulate cortex and dorsolateral prefrontal cortex, as well as other regions not assessed in their primary analysis: occipital cortex, parietal cortex, temporal cortex, cerebellum, putamen.”
From Preliminary evidence for preserved synaptic density in late-life depression (2024) · cites this paper as [22]
Experimental — accuracy not yet measuredThe source backs part of the claim, not all of it — or backs it for a different population, condition or comparison.
In the citing paper
“The only other study that has investigated 11C-UCB-J in depression focused on unmedicated depressed MDD/PTSD adults under the age of 60 [22].”
From Preliminary evidence for preserved synaptic density in late-life depression (2024) · cites this paper as [22]
Experimental — accuracy not yet measuredThe source backs part of the claim, not all of it — or backs it for a different population, condition or comparison.
In the citing paper
“PET studies on several neuropsychiatric disorders linked to synaptic dysfunction, including depression, have found lower cerebral SV2A density in patients compared to healthy individuals [17–22].”
From Effects of escitalopram on synaptic density in the healthy human brain: a randomized controlled trial (2023) · cites this paper as [20]
Experimental — accuracy not yet measured
22 more claims about this paper
Create a free account to see every claim other papers make about this one.
Self-check
Percentages, sums and reported differences re-computed from the paper’s own numbers.
The self-check needs the paper’s full text.
Citations
Cites
Diagnostic and Statistical Manual of Mental Disorders
American Psychiatric Association (2013) · doi:10.1176/appi.books.9780890425596 · Cited by 116,369
Kessler, R. C., Berglund, P., Demler, O., Jin, R., Merikangas, K. R., & Walters, E. E. (2005) · Archives of General Psychiatry · doi:10.1001/archpsyc.62.6.593 · Cited by 20,391
A new depression scale designed to be sensitive to change
Montgomery, S. A., & Åsberg, M. (1979) · British Journal of Psychiatry · doi:10.1192/bjp.134.4.382 · Cited by 13,962
The human brain is intrinsically organized into dynamic, anticorrelated functional networks
Fox, M. D., Snyder, A. Z., Vincent, J. L., Corbetta, M., Van Essen, D. C., & Raichle, M. E. (2005) · Proceedings of the National Academy of Sciences · doi:10.1073/pnas.0504136102 · Cited by 8,553
Molecular Mechanisms of Depression: Perspectives on New Treatment Strategies
Lang, U. E., & Borgwardt, S. (2013) · Cellular Physiology and Biochemistry · doi:10.1159/000350094 · Cited by 8,475
Development of a Rating Scale for Primary Depressive Illness
HAMILTON, M. (1967) · British Journal of Social and Clinical Psychology · doi:10.1111/j.2044-8260.1967.tb00530.x · Cited by 8,410
mTOR-Dependent Synapse Formation Underlies the Rapid Antidepressant Effects of NMDA Antagonists
Li, N., Lee, B., Liu, R.-J., Banasr, M., Dwyer, J. M., Iwata, M., Li, X.-Y., Aghajanian, G., & Duman, R. S. (2010) · Science · doi:10.1126/science.1190287 · Cited by 2,881
Self-citationSüdhof, T. C. (2004) · Annual Review of Neuroscience · doi:10.1146/annurev.neuro.26.041002.131412 · Cited by 2,547
Tononi, G., & Cirelli, C. (2014) · Neuron · doi:10.1016/j.neuron.2013.12.025 · Cited by 2,356
Neurodegenerative Diseases Target Large-Scale Human Brain Networks
Seeley, W. W., Crawford, R. K., Zhou, J., Miller, B. L., & Greicius, M. D. (2009) · Neuron · doi:10.1016/j.neuron.2009.03.024 · Cited by 2,350
Research works printed but not linked: 1
- Scheinost D., et al. Multimodal investigation of network level effects using intrinsic functional connectivity, anatomical covariance, and structure-to-function correlations in unmedicated major depressive disorder. Neuropsychopharmacology 43, 1119–1127 (2018). · DOI · Paper page
Cited by
Major depressive disorder: hypothesis, mechanism, prevention and treatment
Cui, L., Li, S., Wang, S., Wu, X., Liu, Y., Yu, W., Wang, Y., Tang, Y., Xia, M., & Li, B. (2024) · Signal Transduction and Targeted Therapy · doi:10.1038/s41392-024-01738-y · Cited by 1,244
Duman, R. S., Sanacora, G., & Krystal, J. H. (2019) · Neuron · doi:10.1016/j.neuron.2019.03.013 · Cited by 1,026
Self-citationPsilocybin induces rapid and persistent growth of dendritic spines in frontal cortex in vivo
Shao, L.-X., Liao, C., Gregg, I., Davoudian, P. A., Savalia, N. K., Delagarza, K., & Kwan, A. C. (2021) · Neuron · doi:10.1016/j.neuron.2021.06.008 · Cited by 626
Hassamal, S. (2023) · Frontiers in Psychiatry · doi:10.3389/fpsyt.2023.1130989 · Cited by 578
“Greater symptoms of depression are associated with reduced radioligand binding to SV2A in the dorsolateral prefrontal cortex, anterior cingulate cortex, and hippocampal regions (141).”
BackgroundHare, B. D., & Duman, R. S. (2020) · Molecular Psychiatry · doi:10.1038/s41380-020-0685-9 · Cited by 366
Self-citation
Metadata
- Authors
- Holmes, S. E., Scheinost, D., Finnema, S. J., Naganawa, M., Davis, M. T., DellaGioia, N., Nabulsi, N., Matuskey, D., Angarita, G. A., Pietrzak, R. H., Duman, R. S., Sanacora, G., Krystal, J. H., Carson, R. E., & Esterlis, I.
- Affiliations
- Yale University (US)
- Corresponding author
- Esterlis, Irina
- ORCID
- Venue
- Nature Communications
- Published
- 2019-04-04
- Volume
- 10
- Issue
- 1
- Pages
- 1529-1529
- ISSN
- 2041-1723 (ISSN-L)
- PMC
- PMC6449365
- OpenAlex
- W2933363539
- Cited by
- 484
- References
- 79
- Citations by year
- 2026: 51 · 2025: 92 · 2024: 67 · 2023: 62 · 2022: 72 · 2021: 66 · 2020: 59 · 2019: 12
- FWCI
- 32.39
- Type
- journal article
- Language
- en
- Open access
- gold
- doi.org
- Licence
- cc-by
- creativecommons.org/licenses/by/4.0 (tdm)
- creativecommons.org/licenses/by/4.0 (vor)
- Locations
- Nature Communications (publishedVersion, cc-by)
- Europe PMC (PubMed Central) (publishedVersion, cc-by)
- PubMed Central (publishedVersion, cc-by)
- PubMed (publishedVersion)
- RePEc: Research Papers in Economics (submittedVersion)
- DOAJ (DOAJ: Directory of Open Access Journals) (submittedVersion, cc-by-sa)
- DOAJ (DOAJ: Directory of Open Access Journals) (submittedVersion)
- Funders
- U.S. Department of Veterans Affairs
- Yale University
- National Alliance for Research on Schizophrenia and Depression
- National Center for PTSD, U.S. Department of Veterans Affairs
- Janssen Pharmaceuticals
- Topics
- Health Sciences › Medicine › Pharmacology (medical) › Treatment of Major Depression
- Life Sciences › Neuroscience › Cognitive Neuroscience › Functional Brain Connectivity Studies
- Life Sciences › Neuroscience › Cellular and Molecular Neuroscience › Neurotransmitter Receptor Influence on Behavior
- Keywords
- synaptic density, major depressive disorder, post-traumatic stress disorder, depression severity, synaptic loss, SV2A, [11C]UCB-J, functional connectivity, brain network alterations, comorbid depression
- MeSH terms
- Adult, Depression, Major Depressive Disorder, Depressive Disorder, Major, Female, Humans, Male, Membrane Glycoproteins, Middle Aged, Nerve Tissue Proteins, Stress Disorders, Post-Traumatic, Synapses, Positron-Emission Tomography
About these checks
Registry, retraction, Cites and statistics results are computed, not judged, with one exception: a printed reference that no index lists is read once by a model before it counts as a citation error. Claims are extracted by a model and kept only when their quote appears verbatim in the text; each cited source is then checked, with a model’s help, for whether it says what the claim relies on. Those verdicts can be wrong — read the claim’s quote and the cited source before relying on one.
Statistics and arithmetic are recomputed, not judged.
Confidence bands are shown only for fields calibrated on our annotated test set. None is calibrated yet, so no band is shown.
What counts as a claim ›How we measure confidence ›How we check this ›
Are you an author, or do you see a problem with this page? Request a review
How to cite
Cite CoChat for the checks on this page, and the paper for its own findings.
- This page
- CoChat. (2026). Citation check: Lower synaptic density is associated with depression severity and network alterations. https://app.cochat.ai/papers/10.1038/s41467-019-09562-7
- The paper
- Holmes, S. E., Scheinost, D., Finnema, S. J., Naganawa, M., Davis, M. T., DellaGioia, N., Nabulsi, N., Matuskey, D., Angarita, G. A., Pietrzak, R. H., Duman, R. S., Sanacora, G., Krystal, J. H., Carson, R. E., & Esterlis, I. (2019). Lower synaptic density is associated with depression severity and network alterations. Nature Communications. https://doi.org/10.1038/s41467-019-09562-7
Data sources
Bibliographic data: Semantic Scholar, OpenAlex, Crossref.
Contains information from the Semantic Scholar Academic Graph Datasets, made available under the ODC Attribution License (ODC-BY 1.0).
Semantic Scholar’s data is described in: Kinney, R., et al. (2023). The Semantic Scholar Open Data Platform. arXiv:2301.10140.
