

The DOI matches its Crossref record; 75 of the 76 references it cites were found in a registry or an index.
A general approach for detecting expressed mutations in AML cells using single cell RNA-sequencing
Open accessAbstract
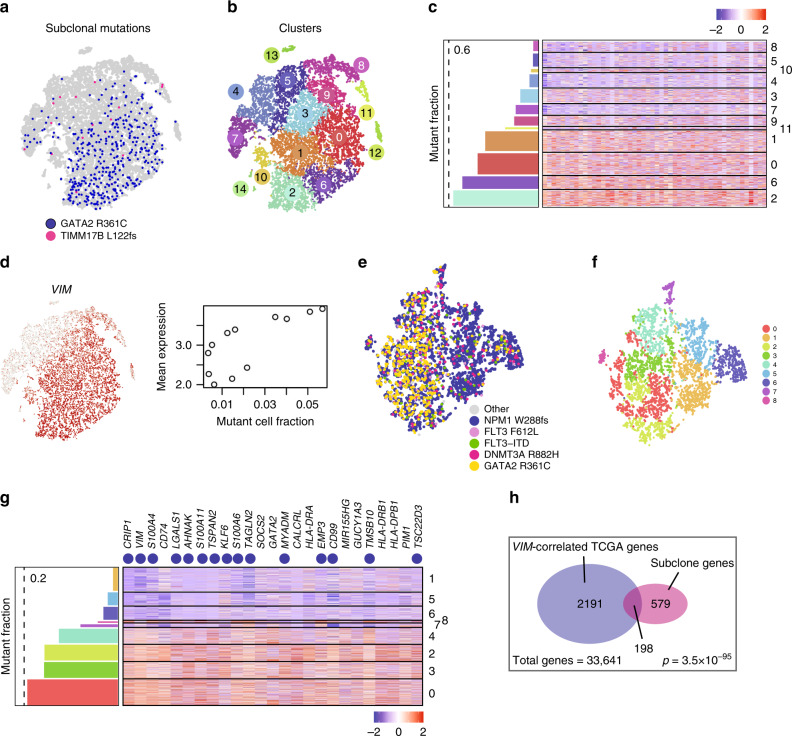
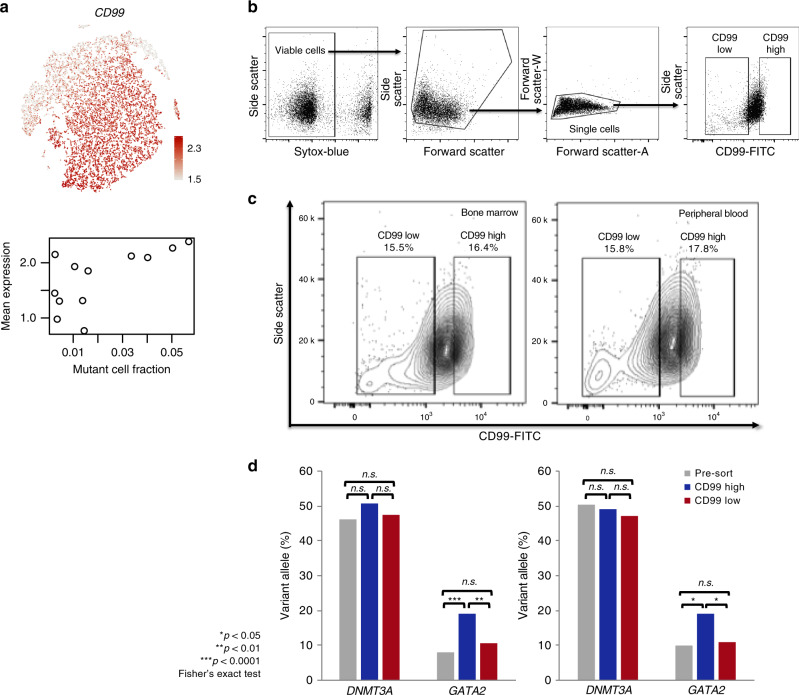
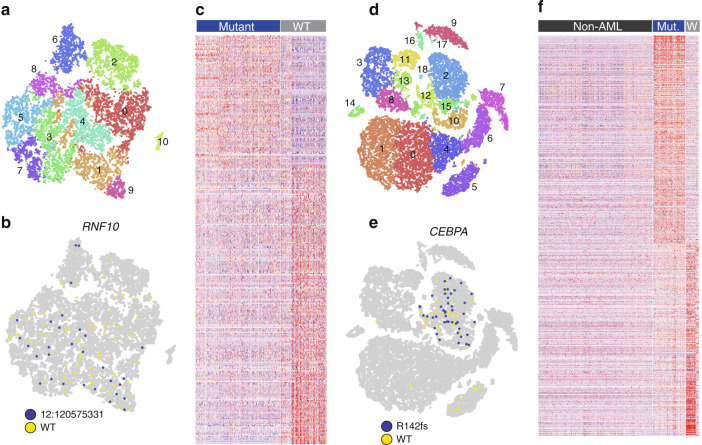
Virtually all tumors are genetically heterogeneous, containing mutationally-defined subclonal cell populations that often have distinct phenotypes. Single-cell RNA-sequencing has revealed that a variety of tumors are also transcriptionally heterogeneous, but the relationship between expression heterogeneity and subclonal architecture is unclear. Here, we address this question in the context of Acute Myeloid Leukemia (AML) by integrating whole genome sequencing with single-cell RNA-sequencing (using the 10x Genomics Chromium Single Cell 5’ Gene Expression workflow). Applying this approach to five cryopreserved AML samples, we identify hundreds to thousands of cells containing tumor-specific mutations in each case, and use the results to distinguish AML cells (including normal-karyotype AML cells) from normal cells, identify expression signatures associated with subclonal mutations, and find cell surface markers that could be used to purify subclones for further study. This integrative approach for connecting genotype to phenotype is broadly applicable to any sample that is phenotypically and genetically heterogeneous.
Overview
The claims and statistics of this paper haven’t been checked yet.
Run the check — free, no account needed. It reads the open-access text and checks the sources it cites.
Integrity signals
Registry
Cites
Statistics
Figures
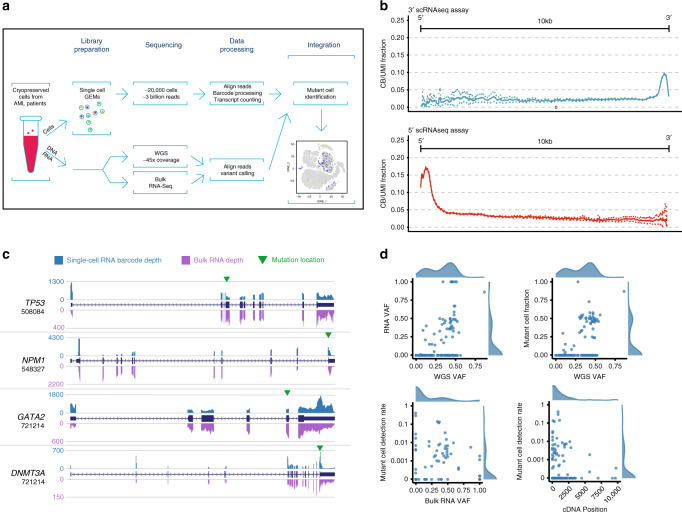
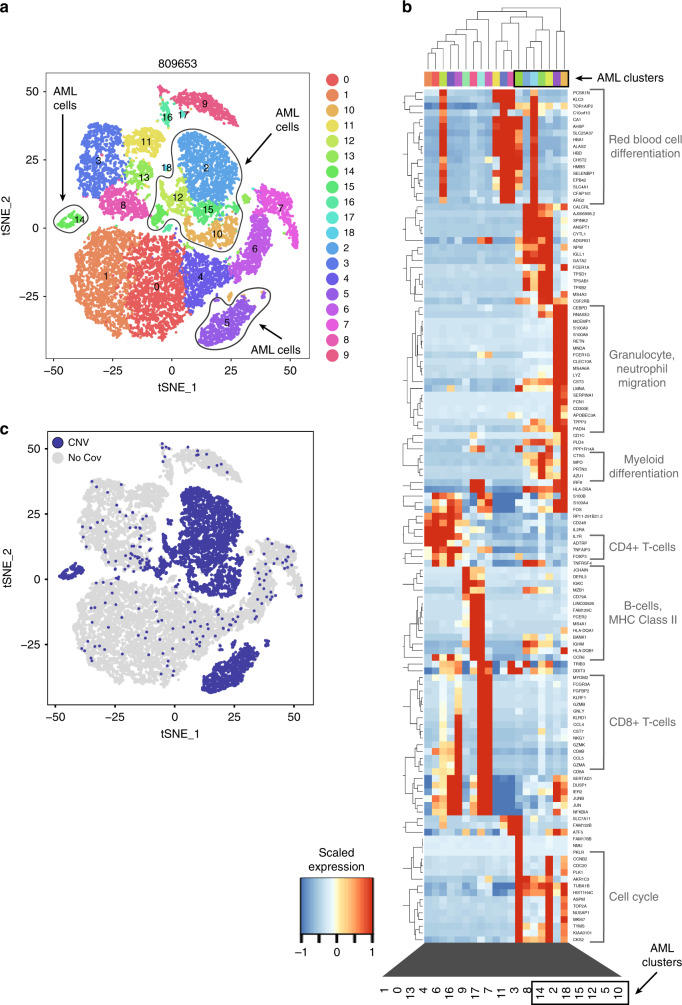
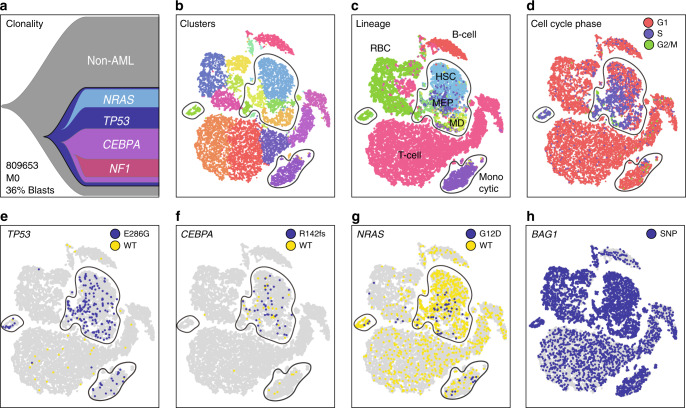
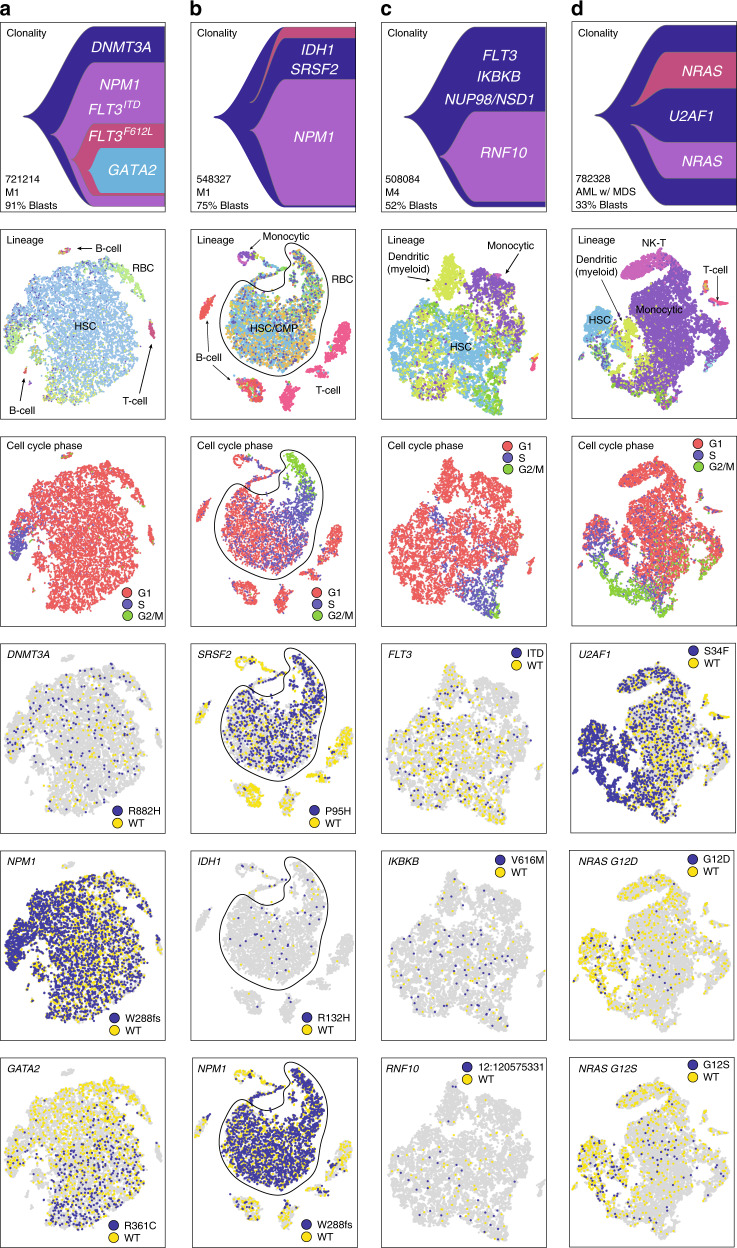
Verification
Claims the paper makes
The claims and statistics of this paper haven’t been checked yet.
Run the check — free, no account needed. It reads the open-access text and checks the sources it cites.
Claims other papers make about this one
Each is checked against this paper’s own text: does it say what the citing paper says it does?
The source backs part of the claim, not all of it — or backs it for a different population, condition or comparison.
In the citing paper
“Next, we count alleles per cell with vartrix14(Fig. 1c) which avoids reference bias due to ambiguous support such as alignment end effects and corrects bases with duplicate reads via the UMI.”
From Souporcell: robust clustering of single-cell RNA-seq data by genotype without reference genotypes (2020) · cites this paper as [14]
Experimental — accuracy not yet measured
Self-check
Percentages, sums and reported differences re-computed from the paper’s own numbers.
The self-check needs the paper’s full text.
Citations
Cites
The Sequence Alignment/Map format and SAMtools
Li, H., Handsaker, B., Wysoker, A., Fennell, T., Ruan, J., Homer, N., Marth, G., Abecasis, G., Durbin, R., & 1000 Genome Project Data Processing Subgroup (2009) · Bioinformatics · doi:10.1093/bioinformatics/btp352 · Cited by 62,041
Fast and accurate short read alignment with Burrows-Wheeler transform
Li, H., & Durbin, R. (2009) · Bioinformatics · doi:10.1093/bioinformatics/btp324 · Cited by 58,607
The Genome Analysis Toolkit: A MapReduce framework for analyzing next-generation DNA sequencing data
McKenna, A., Hanna, M., Banks, E., Sivachenko, A., Cibulskis, K., Kernytsky, A., Garimella, K., Altshuler, D., Gabriel, S., Daly, M., et al. (2010) · Genome Research · doi:10.1101/gr.107524.110 · Cited by 27,895
Integrating single-cell transcriptomic data across different conditions, technologies, and species
Butler, A., Hoffman, P., Smibert, P., Papalexi, E., & Satija, R. (2018) · Nature Biotechnology · doi:10.1038/nbt.4096 · Cited by 13,174
Comprehensive molecular portraits of human breast tumours
The Cancer Genome Atlas Network (2012) · Nature · doi:10.1038/nature11412 · Cited by 12,129
Fast and accurate long-read alignment with Burrows-Wheeler transform.
Li, H., & Durbin, R. (2010) · Bioinformatics · doi:10.1093/bioinformatics/btp698 · Cited by 12,063
The Human Genome Browser at UCSC
Kent, W. J., Sugnet, C. W., Furey, T. S., Roskin, K. M., Pringle, T. H., Zahler, A. M., & Haussler, A. D. (2002) · Genome Research · doi:10.1101/gr.229102 · Cited by 10,400
Near-optimal probabilistic RNA-seq quantification
Bray, N. L., Pimentel, H., Melsted, P., & Pachter, L. (2016) · Nature Biotechnology · doi:10.1038/nbt.3519 · Cited by 9,723
deepTools2: a next generation web server for deep-sequencing data analysis
Ramírez, F., Ryan, D. P., Grüning, B., Bhardwaj, V., Kilpert, F., Richter, A. S., Heyne, S., Dündar, F., & Manke, T. (2016) · Nucleic Acids Research · doi:10.1093/nar/gkw257 · Cited by 8,096
In situ click chemistry generation of cyclooxygenase-2 inhibitors
Bhardwaj, A., Kaur, J., Wuest, M., & Wuest, F. (2017) · Nature Communications · doi:10.1038/s41467-016-0009-6 · Cited by 7,448
Massively parallel digital transcriptional profiling of single cells
Zheng, G. X. Y., Terry, J. M., Belgrader, P., Ryvkin, P., Bent, Z. W., Wilson, R., Ziraldo, S. B., Wheeler, T. D., McDermott, G. P., Zhu, J., et al. (2017) · Nature Communications · doi:10.1038/ncomms14049 · Cited by 7,353
The GeneCards suite: from gene data mining to disease genome sequence analyses
Stelzer, G., Rosen, N., Plaschkes, I., Zimmerman, S., Twik, M., Fishilevich, S., Stein, T. I., Nudel, R., Lieder, I., Mazor, Y., et al. (2016) · Current Protocols in Bioinformatics · doi:10.1002/cpbi.5 · Cited by 5,550
Stochastic Gene Expression in a Single Cell
Elowitz, M. B., Levine, A. J., Siggia, E. D., & Swain, P. S. (2002) · Science · doi:10.1126/science.1070919 · Cited by 5,441
Aligning sequence reads, clone sequences and assembly con*gs with BWA-MEMPreprint
Li, H. (2014) · arXiv (Cornell University) · doi:10.6084/m9.figshare.963153.v1 · Cited by 5,155
Genomic and Epigenomic Landscapes of Adult De Novo Acute Myeloid Leukemia
The Cancer Genome Atlas Research Network (2013) · New England Journal of Medicine · doi:10.1056/nejmoa1301689 · Cited by 5,078
Single-cell RNA-seq highlights intratumoral heterogeneity in primary glioblastoma
Patel, A. P., Tirosh, I., Trombetta, J. J., Shalek, A. K., Gillespie, S. M., Wakimoto, H., Cahill, D. P., Nahed, B. V., Curry, W. T., Martuza, R. L., et al. (2014) · Science · doi:10.1126/science.1254257 · Cited by 5,063
Sensitive detection of somatic point mutations in impure and heterogeneous cancer samples
Cibulskis, K., Lawrence, M. S., Carter, S. L., Sivachenko, A., Jaffe, D. B., Sougnez, C. L., Gabriel, S., Meyerson, M. M., Lander, E. S., & Getz, G. A. (2013) · Nature Biotechnology · doi:10.1038/nbt.2514 · Cited by 4,965
VarScan 2: Somatic mutation and copy number alteration discovery in cancer by exome sequencingPreprint
Koboldt, D. C., Zhang, Q., Larson, D. E., Shen, D., McLellan, M. D., Lin, L., Miller, C. A., Mardis, E. R., Ding, L., & Wilson, R. K. (2012) · Genome Research · doi:10.1101/gr.129684.111 · Cited by 4,954
Self-citationDissecting the multicellular ecosystem of metastatic melanoma by single-cell RNA-seq
Tirosh, I., Izar, B., Prakadan, S. M., Wadsworth, M. H., Treacy, D., Trombetta, J. J., Rotem, A., Rodman, C., Lian, C., Murphy, G., et al. (2016) · Science · doi:10.1126/science.aad0501 · Cited by 4,944
Genomic classification and prognosis in acute myeloid leukemia
Papaemmanuil, E., Gerstung, M., Bullinger, L., Gaidzik, V. I., Paschka, P., Roberts, N. D., Potter, N. E., Heuser, M., Thol, F., Bolli, N., et al. (2016) · New England Journal of Medicine · doi:10.1056/nejmoa1516192 · Cited by 4,350
ToppGene Suite for gene list enrichment analysis and candidate gene prioritization
Chen, J., Bardes, E. E., Aronow, B. J., & Jegga, A. G. (2009) · Nucleic Acids Research · doi:10.1093/nar/gkp427 · Cited by 2,952
Puram, S. V., Tirosh, I., Parikh, A. S., Patel, A. P., Yizhak, K., Gillespie, S., Rodman, C., Luo, C. L., Mroz, E. A., Emerick, K. S., et al. (2017) · Cell · doi:10.1016/j.cell.2017.10.044 · Cited by 2,557
BioMart and Bioconductor: a powerful link between biological databases and microarray data analysis
Durinck, S., Moreau, Y., Kasprzyk, A., Davis, S. R., Moor, B. D., Brāzma, A., & Huber, W. K. (2005) · Computer applications in the biosciences · doi:10.1093/bioinformatics/bti525 · Cited by 2,327
Pan-cancer patterns of somatic copy number alteration
Zack, T. I., Schumacher, S. E., Carter, S. L., Cherniack, A. D., Saksena, G., Tabak, B., Lawrence, M. S., Zhang, C., Wala, J. A., Mermel, C. H., et al. (2013) · Nature Genetics · doi:10.1038/ng.2760 · Cited by 1,893
Noise in Gene Expression: Origins, Consequences, and Control
Raser, J. M., & O’Shea, E. K. (2005) · Science · doi:10.1126/science.1105891 · Cited by 1,756
De novo assembly of bacterial transcriptomes from RNA-seq data
Tjaden, B. C. (2015) · Genome biology · doi:10.1186/s13059-014-0572-2 · Cited by 1,700
Strelka: accurate somatic small-variant calling from sequenced tumor–normal sample pairs
Saunders, C. T., Wong, W. S. W., Swamy, S., Becq, J., Murray, L. J., & Cheetham, R. K. (2012) · Bioinformatics · doi:10.1093/bioinformatics/bts271 · Cited by 1,589
Single-cell RNA-seq supports a developmental hierarchy in human oligodendroglioma
Tirosh, I., Venteicher, A. S., Hebert, C. M., Escalante, L. E., Patel, A. P., Yizhak, K., Fisher, J. M., Rodman, C., Mount, C., Filbin, M. G., et al. (2016) · Nature · doi:10.1038/nature20123 · Cited by 1,245
Single-Cell RNA-Seq Reveals AML Hierarchies Relevant to Disease Progression and Immunity
van Galen, P., Hovestadt, V., Wadsworth II, M. H., Hughes, T. K., Griffin, G. K., Battaglia, S., Verga, J. A., Stephansky, J., Pastika, T. J., Lombardi Story, J., et al. (2019) · Cell · doi:10.1016/j.cell.2019.01.031 · Cited by 1,164
Chemoresistance Evolution in Triple-Negative Breast Cancer Delineated by Single-Cell Sequencing
Kim, C. R., Gao, R., Sei, E., Brandt, R., Hartman, J., Hatschek, T., Crosetto, N., Foukakis, T., & Navin, N. E. (2018) · Cell · doi:10.1016/j.cell.2018.03.041 · Cited by 1,114
Transcriptome-wide noise controls lineage choice in mammalian progenitor cells
Chang, H. H., Hemberg, M., Barahona, M., Ingber, D. E., & Huang, S. (2008) · Nature · doi:10.1038/nature06965 · Cited by 1,067
Decoupling genetics, lineages, and microenvironment in IDH-mutant gliomas by single-cell RNA-seq
Venteicher, A. S., Tirosh, I., Hebert, C. M., Yizhak, K., Neftel, C., Filbin, M. G., Hovestadt, V., Escalante, L. E., Shaw, M. L., Rodman, C., et al. (2017) · Science · doi:10.1126/science.aai8478 · Cited by 994
Densely Interconnected Transcriptional Circuits Control Cell States in Human Hematopoiesis
Novershtern, N., Subramanian, A., Lawton, L. N., Mak, R. H., Haining, W. N., McConkey, M. E., Habib, N., Yosef, N., Chang, C. Y., Shay, T., et al. (2011) · Cell · doi:10.1016/j.cell.2011.01.004 · Cited by 942
Visualizing Genomic Data Using Gviz and Bioconductor
Hahne, F., & Ivánek, R. (2016) · Methods in molecular biology · doi:10.1007/978-1-4939-3578-9_16 · Cited by 893
Gascoigne, K. E., & Taylor, S. S. (2008) · Cancer Cell · doi:10.1016/j.ccr.2008.07.002 · Cited by 832
Developmental and oncogenic programs in H3K27M gliomas dissected by single-cell RNA-seq
Filbin, M. G., Tirosh, I., Hovestadt, V., Shaw, M. L., Escalante, L. E., Mathewson, N. D., Neftel, C., Frank, N., Pelton, K., Hebert, C. M., et al. (2018) · Science · doi:10.1126/science.aao4750 · Cited by 694
SomaticSniper: identification of somatic point mutations in whole genome sequencing data
Larson, D. E., Harris, C. C., Chen, K., Koboldt, D. C., Abbott, T. E., Dooling, D. J., Ley, T. J., Mardis, E. R., Wilson, R. K., & Ding, L. (2011) · Bioinformatics · doi:10.1093/bioinformatics/btr665 · Cited by 658
Self-citationHsu, A. P., Sampaio, E. P., Khan, J. I., Calvo, K. R., Lemieux, J. E., Patel, S. Y., Frucht, D. M., Vinh, D. C., Auth, R., Freeman, A. F., et al. (2011) · Blood · doi:10.1182/blood-2011-05-356352 · Cited by 635
Dynamic Proteomics of Individual Cancer Cells in Response to a Drug
Cohen, A., Geva‐Zatorsky, N., Eden, E., Frenkel‐Morgenstern, M., Issaeva, I., Sigal, A., Milo, R., Cohen‐Saidon, C., Liron, Y., Kam, Z., et al. (2008) · Science · doi:10.1126/science.1160165 · Cited by 611
Variability and memory of protein levels in human cells
Sigal, A., Milo, R., Cohen, A., Geva‐Zatorsky, N., Klein, Y., Liron, Y., Rosenfeld, N., Danon, T., Perzov, N., & Alon, U. S. (2006) · Nature · doi:10.1038/nature05316 · Cited by 576
Enhancement of cellular memory by reducing stochastic transitions
Açar, M., Becskei, A., & van Oudenaarden, A. (2005) · Nature · doi:10.1038/nature03524 · Cited by 494
Brock, A., Chang, H. H., & Huang, S. (2009) · Nature Reviews Genetics · doi:10.1038/nrg2556 · Cited by 494
The UCSC Genome Browser database: 2018 update
Casper, J., Zweig, A. S., Villarreal, C., Tyner, C., Speir, M. L., Rosenbloom, K. R., Raney, B. J., Lee, C. M., Lee, B. T., Karolchik, D., et al. (2018) · Nucleic Acids Research · doi:10.1093/nar/gkx1020 · Cited by 475
Self-citationMiller, C. A., White, B. S., Dees, N. D., Griffith, M., Welch, J. S., Griffith, O. L., Vij, R., Tomasson, M. H., Graubert, T. A., Walter, M. J., et al. (2014) · PLoS Computational Biology · doi:10.1371/journal.pcbi.1003665 · Cited by 461
Self-citationNegative cross-talk between hematopoietic regulators: GATA proteins repress PU.1
Zhang, P., Behre, G., Pan, J., Iwama, A., Wara-aswapati, N., Radomska, H. S., Auron, P. E., Tenen, D. G., & Sun, Z. (1999) · Proceedings of the National Academy of Sciences · doi:10.1073/pnas.96.15.8705 · Cited by 459
WASP: a key immunological multitasker
Thrasher, A. J., & Burns, S. O. (2010) · Nature reviews. Immunology · doi:10.1038/nri2724 · Cited by 418
Functional Heterogeneity of Genetically Defined Subclones in Acute Myeloid Leukemia
Klco, J. M., Spencer, D. H., Miller, C. A., Griffith, M., Westover, T., O’Laughlin, M. D., Fronick, C. C., Magrini, V. J., Demeter, R., Fulton, R. S., et al. (2014) · Cancer Cell · doi:10.1016/j.ccr.2014.01.031 · Cited by 410
Self-citationGiustacchini, A., Thongjuea, S., Barkas, N., Woll, P. S., Povinelli, B. J., Booth, C. A. G., Sopp, P., Norfo, R., Rodriguez-Meira, A., Ashley, N., et al. (2017) · Nature Medicine · doi:10.1038/nm.4336 · Cited by 403
Single-cell RNA sequencing identifies celltype-specific cis-eQTLs and co-expression QTLs
Study, L. C., van der Wijst, M. G. P., BIOS Consortium, Brugge, H., de Vries, D. H., Deelen, P., Swertz, M. A., & Franke, L. (2018) · Nature Genetics · doi:10.1038/s41588-018-0089-9 · Cited by 399
Lineage infidelity in acute leukemia
Smith, L., Curtis, J. E., Messner, H., Senn, J., Furthmayr, H., & McCulloch, E. A. (1983) · Blood · doi:10.1182/blood.v61.6.1138.1138 · Cited by 387
Choudhuri, D., Srinivasan, S. G., Gibson, M. A., Zheng, Y., Jaeger, D. L., Fraser, H. L., & Banerjee, R. (2017) · Nature Communications · doi:10.1038/s41467-017-02112-z · Cited by 384
Klco, J. M., Miller, C. A., Griffith, M., Petti, A. A., Spencer, D. H., Ketkar-Kulkarni, S., Wartman, L. D., Christopher, M. J., Westover, T., Helton, N. M., et al. (2015) · JAMA · doi:10.1001/jama.2015.9643 · Cited by 341
Self-citationSpatiotemporal genomic architecture informs precision oncology in glioblastoma
Lee, J., Wang, J., Sa, J. K., Ladewig, E., Lee, H., Lee, I., Kang, H. J., Rosenbloom, D. I. S., Cámara, P. G., Liu, Z., et al. (2017) · Nature Genetics · doi:10.1038/ng.3806 · Cited by 284
Kim, K., Lee, H. W., Lee, H., Kim, S. C., Seo, Y. J., Chung, W., Eum, H. H., Nam, D., Kim, J., Joo, K. M., et al. (2015) · Genome biology · doi:10.1186/s13059-015-0692-3 · Cited by 269
APPRIS: annotation of principal and alternative splice isoforms
Rodriguez, J. M., Maietta, P., Ezkurdia, I., Pietrelli, A., Wesselink, J.-J., Lopez, G., Valencia, A., & Tress, M. L. (2013) · Nucleic Acids Research · doi:10.1093/nar/gks1058 · Cited by 232
Fan, J., Lee, H., Lee, S., Ryu, D., Lee, S., Xue, C., Kim, S. J., Kım, K., Barkas, N., Park, P. J., et al. (2018) · Genome Research · doi:10.1101/gr.228080.117 · Cited by 228
GATA factor mutations in hematologic disease
Crispino, J. D., & Horwitz, M. S. (2017) · Blood · doi:10.1182/blood-2016-09-687889 · Cited by 196
Lee, M.-C. W., López-Díaz, F. J., Khan, S. Y., Tariq, M., Dayn, Y., Vaske, C. J., Radenbaugh, A., Kim, H. J., Emerson, B. M., & Pourmand, N. (2014) · Proceedings of the National Academy of Sciences · doi:10.1073/pnas.1404656111 · Cited by 174
Separation and parallel sequencing of the genomes and transcriptomes of single cells using G&T-seq
Macaulay, I. C., Teng, M. J., Haerty, W., Kumar, P., Ponting, C. P., & Voet, T. (2016) · Nature Protocols · doi:10.1038/nprot.2016.138 · Cited by 170
Combating subclonal evolution of resistant cancer phenotypes
Brady, S. W., McQuerry, J. A., Qiao, Y., Piccolo, S., Shrestha, G., Jenkins, D. F., Layer, R. M., Pedersen, B. S., Miller, R. H., Esch, A. M., et al. (2017) · Nature Communications · doi:10.1038/s41467-017-01174-3 · Cited by 163
CD99 is a therapeutic target on disease stem cells in myeloid malignancies
Chung, S. S., Eng, W. S., Hu, W., Khalaj, M., Garrett-Bakelman, F. E., Tavakkoli, M., Levine, R. L., Carroll, M. P., Klimek, V. M., Melnick, A. M., et al. (2017) · Science Translational Medicine · doi:10.1126/scitranslmed.aaj2025 · Cited by 156
CONICS integrates scRNA-seq with DNA sequencing to map gene expression to tumor sub-clones
Müller, S., Cho, A., Liu, S. J., Lim, D. A., & Diaz, A. (2018) · Bioinformatics · doi:10.1093/bioinformatics/bty316 · Cited by 117
Müller, S., Liu, S. J., Lullo, E. D., Malatesta, M., Pollen, A. A., Nowakowski, T. J., Kohanbash, G., Aghi, M. K., Kriegstein, A. R., Lim, D. A., et al. (2016) · Molecular Systems Biology · doi:10.15252/msb.20166969 · Cited by 102
Noise and Epigenetic Inheritance of Single-Cell Division Times Influence Population Fitness
Cerulus, B., New, A. M., Pougach, K., & Verstrepen, K. J. (2016) · Current Biology · doi:10.1016/j.cub.2016.03.010 · Cited by 89
Timing somatic events in the evolution of cancer
Jolly, C., & Loo, P. V. (2018) · Genome biology · doi:10.1186/s13059-018-1476-3 · Cited by 86
Bian, W., Xie, Y., Wang, X., Xu, G., Fu, B., Li, S., Long, G., Zhou, X., & Zhang, X. (2018) · Nucleic Acids Research · doi:10.1093/nar/gky1177 · Cited by 79
Dissecting human gliomas by single-cell RNA sequencing
Tirosh, I., & Suvà, M. L. (2017) · Neuro-Oncology · doi:10.1093/neuonc/nox126 · Cited by 72
Characterizing heterogeneity in leukemic cells using single-cell gene expression analysis
Saadatpour, A., Guo, G., Orkin, S. H., & Yuan, G. (2014) · Genome biology · doi:10.1186/s13059-014-0525-9 · Cited by 63
Epigenetic regulation of GATA2 and its impact on normal karyotype acute myeloid leukemia
Celton, M., Forest, A., Gosse, G., Lemieux, S., Hébert, J., Sauvageau, G., & Wilhelm, B. T. (2014) · Leukemia · doi:10.1038/leu.2014.67 · Cited by 37
Miller, C. A., Tricarico, C. J., Skidmore, Z. L., Uy, G. L., Lee, Y.-S., Hassan, A., O’Laughlin, M. D., Schmidt, H. K., Tian, L., Duncavage, E. J., et al. (2018) · Blood Advances · doi:10.1182/bloodadvances.2017014183 · Cited by 34
Self-citationMetallothionein-1 Isoforms and Vimentin Are Direct PU.1 Downstream Target Genes in Leukemia Cells
Imoto, A., Okada, M., Okazaki, T., Kitasato, H., Harigae, H., & Takahashi, S. (2010) · Journal of Biological Chemistry · doi:10.1074/jbc.m109.095810 · Cited by 30
Cell lineage inference from SNP and scRNA-Seq data
Ding, J., Lin, C. H., & Bar‐Joseph, Z. (2019) · Nucleic Acids Research · doi:10.1093/nar/gkz146 · Cited by 27
Mapping regulatory variants in hiPSC models
Hoffman, G. E., & Brennand, K. (2017) · Nature Genetics · doi:10.1038/s41588-017-0017-4 · Cited by 15
Miller, C. A., Dahiya, S. M., Li, T., Fulton, R. S., Smyth, M. D., Dunn, G. P., Rubin, J. B., & Mardis, E. R. (2018) · Molecular Case Studies · doi:10.1101/mcs.a002444 · Cited by 13
Self-citation
Research works printed but not linked: 1
- The Cancer Genome Atlas Research Network. Genomic and epigenomic landscapes of adult de novo acute myeloid leukemia. N. Engl. J. Med. 368, 2059–2074 (2013). · DOI · Paper page
Cited by
Sorted by citations
Kumar, V., Ramnarayanan, K., Sundar, R., Padmanabhan, N., Srivastava, S., Koiwa, M., Yasuda, T., Koh, V., Huang, K. K., Tay, S. T., et al. (2022) · Cancer Discovery · doi:10.1158/2159-8290.cd-21-0683 · Cited by 573
Souporcell: robust clustering of single-cell RNA-seq data by genotype without reference genotypes
Heaton, H., Talman, A. M., Knights, A., Imaz, M., Gaffney, D. J., Durbin, R., Hemberg, M., & Lawniczak, M. K. N. (2020) · Nature Methods · doi:10.1038/s41592-020-0820-1 · Cited by 506
Single-cell mutation analysis of clonal evolution in myeloid malignancies
Miles, L. A., Bowman, R. L., Merlinsky, T. R., Csete, I., Ooi, A. T., Durruthy-Durruthy, R., Bowman, M., Famulare, C. A., Patel, M. A., Méndez, P., et al. (2020) · Nature · doi:10.1038/s41586-020-2864-x · Cited by 522
Applications of single-cell RNA sequencing in drug discovery and development
de Sande, B. V., Lee, J. S., Mutasa-Gottgens, E., Naughton, B. J., Bacon, W., Manning, J. R., Wang, Y., Pollard, J. R., Mendez, M., Hill, J., et al. (2023) · Nature Reviews Drug Discovery · doi:10.1038/s41573-023-00688-4 · Cited by 462
Integrating genetic and non-genetic determinants of cancer evolution by single-cell multi-omics
Nam, A. S., Chaligné, R., & Landau, D. A. (2020) · Nature Reviews Genetics · doi:10.1038/s41576-020-0265-5 · Cited by 399
Metadata
- Authors
- Petti, A. A., Williams, S. R., Miller, C. A., Fiddes, I. T., Srivatsan, S. N., Chen, D. Y., Fronick, C. C., Fulton, R. S., Church, D. M., & Ley, T. J.
- Affiliations
- Washington University in St. Louis (US)
- 10X Genomics (United States) (US)
- Corresponding author
- Ley, Timothy J.
- ORCID
- Venue
- Nature Communications
- Published
- 2019-08-14
- Volume
- 10
- Issue
- 1
- Pages
- 3660-3660
- ISSN
- 2041-1723 (ISSN-L)
- PMC
- PMC6694122
- OpenAlex
- W2968098426
- Cited by
- 215
- References
- 76
- Citations by year
- 2026: 14 · 2025: 26 · 2024: 35 · 2023: 44 · 2022: 32 · 2021: 40 · 2020: 22 · 2019: 2
- FWCI
- 17.12
- Type
- journal article
- Language
- en
- Update notices
- correction (2022-07-21)
- Open access
- gold
- doi.org
- Locations
- Nature Communications (publishedVersion, cc-by)
- Europe PMC (PubMed Central) (publishedVersion, cc-by)
- PubMed Central (publishedVersion, cc-by)
- PubMed (publishedVersion)
- Digital Commons@Becker (Washington University School of Medicine) (submittedVersion, cc-by)
- RePEc: Research Papers in Economics (submittedVersion)
- DOAJ (DOAJ: Directory of Open Access Journals) (submittedVersion)
- DOAJ (DOAJ: Directory of Open Access Journals) (submittedVersion, cc-by-sa)
- Funders
- U.S. Department of Health & Human Services | NIH | National Cancer Institute (CA101937, CA197561, CA167540, CA211782, K12CA167540, R50CA211782)
- Topics
- Health Sciences › Medicine › Hematology › Acute Myeloid Leukemia Research
- Life Sciences › Biochemistry, Genetics and Molecular Biology › Molecular Biology › Single-cell and spatial transcriptomics
- Life Sciences › Biochemistry, Genetics and Molecular Biology › Cancer Research › Cancer Genomics and Diagnostics
- Keywords
- acute myeloid leukemia, subclonal heterogeneity, cancer mutations, transcriptional heterogeneity, single-cell RNA sequencing, genotype-phenotype correlation, cell surface markers, normal karyotype AML, tumor cell identification
- MeSH terms
- Whole Genome Sequencing, Genotype, Humans, Mutation, Phenotype, RNA, Leukemia, Myeloid, Acute, Sequence Analysis, RNA, Polymorphism, Single Nucleotide, Gene Expression Profiling, Genomics, Single-Cell Analysis
About these checks
Registry, retraction, Cites and statistics results are computed, not judged, with one exception: a printed reference that no index lists is read once by a model before it counts as a citation error. Claims are extracted by a model and kept only when their quote appears verbatim in the text; each cited source is then checked, with a model’s help, for whether it says what the claim relies on. Those verdicts can be wrong — read the claim’s quote and the cited source before relying on one.
Statistics and arithmetic are recomputed, not judged.
Confidence bands are shown only for fields calibrated on our annotated test set. None is calibrated yet, so no band is shown.
What counts as a claim ›How we measure confidence ›How we check this ›
Are you an author, or do you see a problem with this page? Request a review
