

The DOI matches its Crossref record; 75 of the 75 references it cites were found in a registry or an index; 3 of the 24 sources its claims cite were checked for support.
Mitochondrial oxidative capacity and NAD+ biosynthesis are reduced in human sarcopenia across ethnicities
Open accessAbstract
The causes of impaired skeletal muscle mass and strength during aging are well-studied in healthy populations. Less is known on pathological age-related muscle wasting and weakness termed sarcopenia, which directly impacts physical autonomy and survival. Here, we compare genome-wide transcriptional changes of sarcopenia versus age-matched controls in muscle biopsies from 119 older men from Singapore, Hertfordshire UK and Jamaica. Individuals with sarcopenia reproducibly demonstrate a prominent transcriptional signature of mitochondrial bioenergetic dysfunction in skeletal muscle, with low PGC-1α/ERRα signalling, and downregulation of oxidative phosphorylation and mitochondrial proteostasis genes. These changes translate functionally into fewer mitochondria, reduced mitochondrial respiratory complex expression and activity, and low NAD + levels through perturbed NAD + biosynthesis and salvage in sarcopenic muscle. We provide an integrated molecular profile of human sarcopenia across ethnicities, demonstrating a fundamental role of altered mitochondrial metabolism in the pathological loss of skeletal muscle mass and function in older people.
Overview
AI snapshot
Written from the paper’s full text.
TL;DR
In a multi-ethnic case-control study of muscle biopsies from older men, sarcopenia was reproducibly characterized by a dominant transcriptional signature of mitochondrial bioenergetic dysfunction, including low PGC-1α/ERRα signaling and downregulated oxidative phosphorylation and mitochondrial proteostasis genes. These changes translated into fewer mitochondria, reduced respiratory complex expression and activity, and 32% lower muscle NAD+ through perturbed NAD+ biosynthesis and salvage.
Key findings
- In the Singapore Sarcopenia Study (SSS), 179 genes were altered in sarcopenic muscle at FDR < 10% (133 downregulated, 46 upregulated), with 133 genes annotated to the mitochondrion GO term; oxidative phosphorylation, mitochondrial respiratory chain, and TCA cycle gene sets were repressed at FDR < 10E−10, and age-adjusted gene ranks were highly conserved (Spearman rs = 0.95).
- Mitochondrial dysfunction replicated across ethnicities: HSS and JSS showed lower oxidative phosphorylation, mitochondrial respiratory ETC, and TCA cycle gene sets at FDR < 10E−04 and 10%, respectively; low ALMi and low muscle function also associated with depleted mitochondrial gene sets.
- Functional validation showed NDUFA9, SDHa, UQCR2, and ATP5a protein levels down by 44–51%, lower complexes I–IV activity, strongly reduced citrate synthase and succinate dehydrogenase activity, and 32% lower muscle NAD+; NAD+ correlated positively with ALMi, grip strength, gait speed, and complex I activity, while NMNAT1 and NAMPT were reduced and CD38, PARPs, and sirtuins were not increased.
- Other signatures included repressed mTOR signaling (FDR = 1.2E−02) but less than OXPHOS; no denervation/NMJ or inflammatory signatures except weak inflammation in JSS; ALMi associated with 318 genes at FDR < 10%, whereas grip strength and gait speed associated with only 7 and 9 genes at nominal p < 0.001 but FDR > 10%.
Methods
- Multi-ethnic case-control MEMOSA study of 119 older men from Singapore (SSS), Hertfordshire UK (HSS), and Jamaica (JSS); SSS included 20 sarcopenic Chinese men and 20 age-matched controls, HSS included 40 Caucasian men, and JSS included 40 Afro-Caribbean men. Sarcopenia was defined by AWGSOP (SSS) or EWGSOP (HSS/JSS) criteria using ALMi, grip strength, and gait speed.
- Vastus lateralis muscle biopsies were profiled by high-coverage total RNA sequencing (>70 million reads per sample; SSS 75–104 million, HSS 51–110 million, JSS 55–88 million); differential expression used limma/edgeR, pathway enrichment used CAMERA with MSigDB, and selected genes were validated by nanoString nCounter.
- Functional assays included mitochondrial enzymatic activity on mitochondrial fractions from 15–30 mg muscle, western blot for respiratory complex subunits and mitochondrial proteins, and NAD+ quantification in remaining biopsies, benchmarked against UHPLC-MS.
Limitations
- Stated: NAD+ results require further validation because they were analyzed in a subset of SSS individuals with sufficient remaining muscle biopsy (Fig. 6b, n = 4–6 per group); complex IV western blot was detected in less than 20% of samples and was excluded from analysis.
- Stated/evident: the cross-sectional case-control design cannot establish causality, and all cohorts were older men, so findings may not generalize to women.
- Evident: functional validation sample sizes were small and varied by assay and cohort; replication cohorts had variable sample sizes per phenotype (e.g., NAD+ metabolic process gene-set analysis n = 4–28 per group), and no independent prospective validation is reported.
Model-written summary. Check it against the paper before relying on it.
Integrity signals
Registry
Cites
Statistics
Figures
Verification
Claims the paper makes
26 Own result · 20 Own interpretation · 8 Not checked yet · 6 Own method · 1 Partly supported · 1 No basis given · accuracy not yet measured
A result the paper reports from its own data — it cites no other source for it, so there is none to check. The quote shows it is in the paper.
In the paper
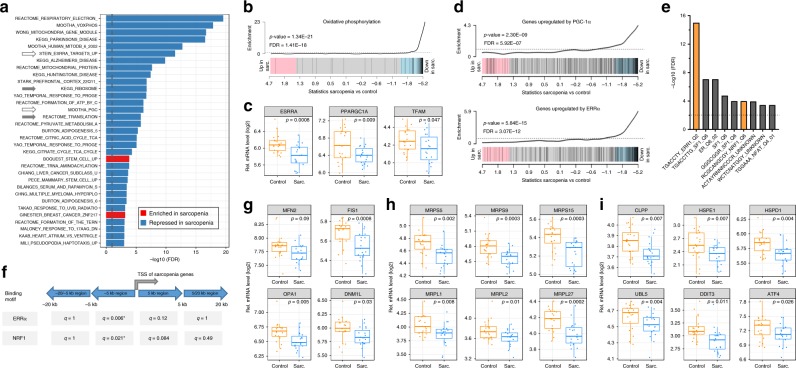
“Expression profiles of genes controlling mitochondrial dynamics through fusion and fission were lower in sarcopenic individuals, both through single gene and pathway enrichment analyses (Fig. 2g; Fig. S2d).”
§ Mitochondrial oxidative capacity and NAD+ biosynthesis are reduced in human sarcopenia across ethnicities > Results > Perturbed mitochondrial dynamics and UPRmt in sarcopenic muscle
plaincorrelational- Asserted: passes — The authors put it forward as true.
- Checkable: passes — It can be checked against evidence.
- Load-bearing: passes — The paper’s conclusions depend on it.
- Based: passes — The paper gives a reason why it holds.
A result the paper reports from its own data — it cites no other source for it, so there is none to check. The quote shows it is in the paper.
In the paper
“Interestingly, many genes controlling the UPRmt were strongly downregulated in the muscle of sarcopenic participants, including those encoding the mitochondrial heat-shock proteins, the protease CLPP and their transcriptional effectors UBL5, ATF4, and CHOP/DDIT3 (Fig. 2i; Supplementary Fig. 2f).”
§ Mitochondrial oxidative capacity and NAD+ biosynthesis are reduced in human sarcopenia across ethnicities > Results > Perturbed mitochondrial dynamics and UPRmt in sarcopenic muscle
boostedcorrelational- Asserted: passes — The authors put it forward as true.
- Checkable: passes — It can be checked against evidence.
- Load-bearing: passes — The paper’s conclusions depend on it.
- Based: passes — The paper gives a reason why it holds.
A result the paper reports from its own data — it cites no other source for it, so there is none to check. The quote shows it is in the paper.
In the paper
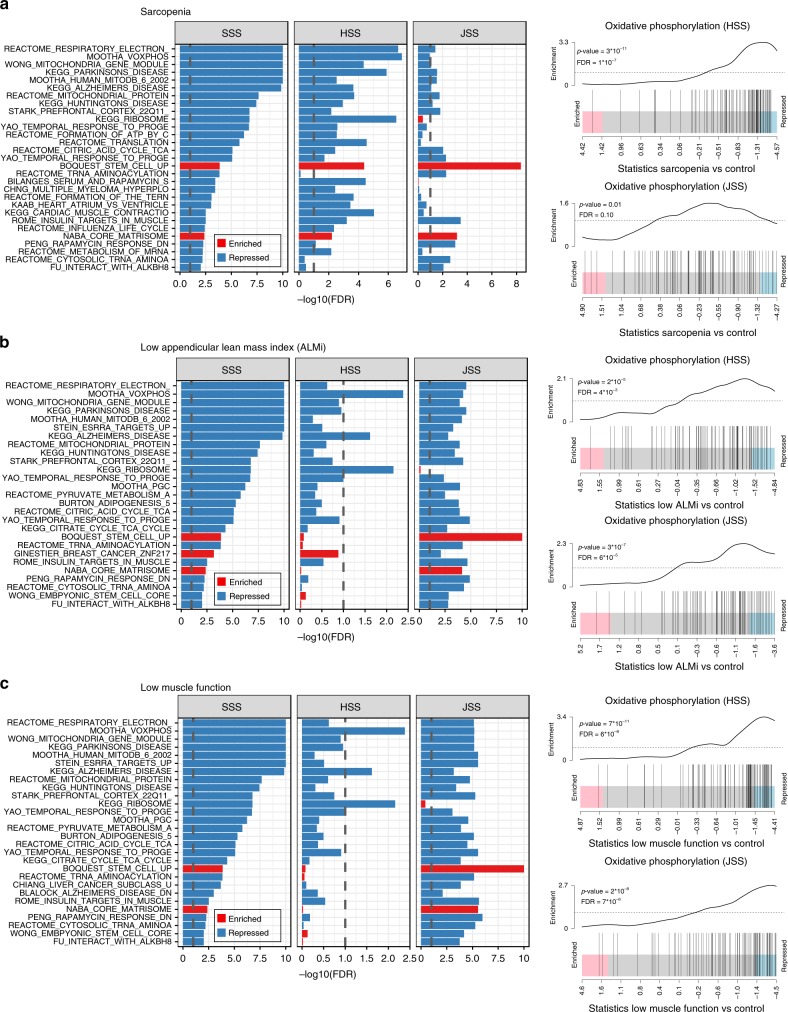
“Gene sets controlling mitochondrial function were also consistently depleted in participants with low ALMi (Fig. 3b) and low muscle function (Fig. 3c) in HSS and JSS cohorts.”
§ Mitochondrial oxidative capacity and NAD+ biosynthesis are reduced in human sarcopenia across ethnicities > Results > Sarcopenia has a common transcriptional profile across ethnicities
plaincorrelational- Asserted: passes — The authors put it forward as true.
- Checkable: passes — It can be checked against evidence.
- Load-bearing: passes — The paper’s conclusions depend on it.
- Based: passes — The paper gives a reason why it holds.
A result the paper reports from its own data — it cites no other source for it, so there is none to check. The quote shows it is in the paper.
In the paper
“Mitochondrial respiratory chain, TCA cycle regulator, and oxidative phosphorylation gene sets were repressed in sarcopenic muscle with highly significant FDRs (<10E−10).”
§ Mitochondrial oxidative capacity and NAD+ biosynthesis are reduced in human sarcopenia across ethnicities > Results > Mitochondrial dysfunction is the major transcriptional hallmark of sarcopenic muscle
boostedcorrelational- Asserted: passes — The authors put it forward as true.
- Checkable: passes — It can be checked against evidence.
- Load-bearing: passes — The paper’s conclusions depend on it.
- Based: passes — The paper gives a reason why it holds.
A result the paper reports from its own data — it cites no other source for it, so there is none to check. The quote shows it is in the paper.
In the paper
“mRNA levels of PGC-1α and ERRα were reduced in sarcopenic muscle (Fig. 2c)”
§ Mitochondrial oxidative capacity and NAD+ biosynthesis are reduced in human sarcopenia across ethnicities > Results > Altered signaling through ERRα and PGC-1α in sarcopenic muscle
plaincorrelational- Asserted: passes — The authors put it forward as true.
- Checkable: passes — It can be checked against evidence.
- Load-bearing: passes — The paper’s conclusions depend on it.
- Based: passes — The paper gives a reason why it holds.
A result the paper reports from its own data — it cites no other source for it, so there is none to check. The quote shows it is in the paper.
In the paper
“In addition, the promoters of the genes downregulated in sarcopenic muscle were highly enriched in ERRα and nuclear respiratory factor 1 (NRF1) binding sites (Fig. 2e, f).”
§ Mitochondrial oxidative capacity and NAD+ biosynthesis are reduced in human sarcopenia across ethnicities > Results > Altered signaling through ERRα and PGC-1α in sarcopenic muscle
plaincorrelational- Asserted: passes — The authors put it forward as true.
- Checkable: passes — It can be checked against evidence.
- Load-bearing: passes — The paper’s conclusions depend on it.
- Based: passes — The paper gives a reason why it holds.
A result the paper reports from its own data — it cites no other source for it, so there is none to check. The quote shows it is in the paper.
In the paper
“Many genes encoding both the small and large subunits of the mitochondrial ribosome were downregulated in sarcopenic muscle (Fig. 2h; Supplementary Fig. 2e)”
§ Mitochondrial oxidative capacity and NAD+ biosynthesis are reduced in human sarcopenia across ethnicities > Results > Perturbed mitochondrial dynamics and UPRmt in sarcopenic muscle
plaincorrelational- Asserted: passes — The authors put it forward as true.
- Checkable: passes — It can be checked against evidence.
- Load-bearing: passes — The paper’s conclusions depend on it.
- Based: passes — The paper gives a reason why it holds.
A result the paper reports from its own data — it cites no other source for it, so there is none to check. The quote shows it is in the paper.
In the paper
“Sets of genes controlling neuromuscular processes, NMJ structure and acetylcholine receptor signaling were not deregulated in sarcopenic muscle across the three cohorts (Supplementary Fig. 2i, k, l)”
§ Mitochondrial oxidative capacity and NAD+ biosynthesis are reduced in human sarcopenia across ethnicities > Results > Role of other molecular processes in human sarcopenia
plain- Asserted: passes — The authors put it forward as true.
- Checkable: passes — It can be checked against evidence.
- Load-bearing: passes — The paper’s conclusions depend on it.
- Based: passes — The paper gives a reason why it holds.
A result the paper reports from its own data — it cites no other source for it, so there is none to check. The quote shows it is in the paper.
In the paper
“The pathway enrichment analyses of sarcopenic muscle also revealed lower expression of the transcriptional networks regulated by the ERRα nuclear receptor (gene name ESRRA) and the PGC-1α transcriptional coactivator (PPARGCA1) (Fig. 2a)”
§ Mitochondrial oxidative capacity and NAD+ biosynthesis are reduced in human sarcopenia across ethnicities > Results > Altered signaling through ERRα and PGC-1α in sarcopenic muscle
plaincorrelational- Asserted: passes — The authors put it forward as true.
- Checkable: passes — It can be checked against evidence.
- Load-bearing: passes — The paper’s conclusions depend on it.
- Based: passes — The paper gives a reason why it holds.
A result the paper reports from its own data — it cites no other source for it, so there is none to check. The quote shows it is in the paper.
In the paper
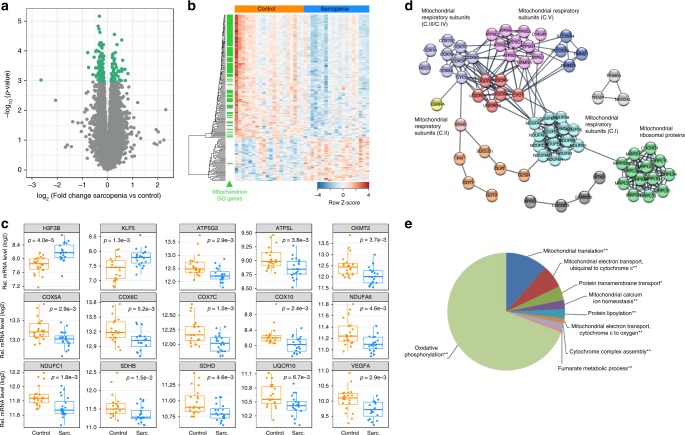
“Case–control analysis in SSS revealed a strong perturbation of muscle gene expression in sarcopenic participants where 179 genes encoding 150 proteins and 29 noncoding RNAs were altered in sarcopenic muscle with false-discovery rate (FDR) < 10% (Fig. 1a; Supplementary Data 2).”
§ Mitochondrial oxidative capacity and NAD+ biosynthesis are reduced in human sarcopenia across ethnicities > Results > Mitochondrial dysfunction is the major transcriptional hallmark of sarcopenic muscle
plaincorrelational- Asserted: passes — The authors put it forward as true.
- Checkable: passes — It can be checked against evidence.
- Load-bearing: passes — The paper’s conclusions depend on it.
- Based: passes — The paper gives a reason why it holds.
A result the paper reports from its own data — it cites no other source for it, so there is none to check. The quote shows it is in the paper.
In the paper
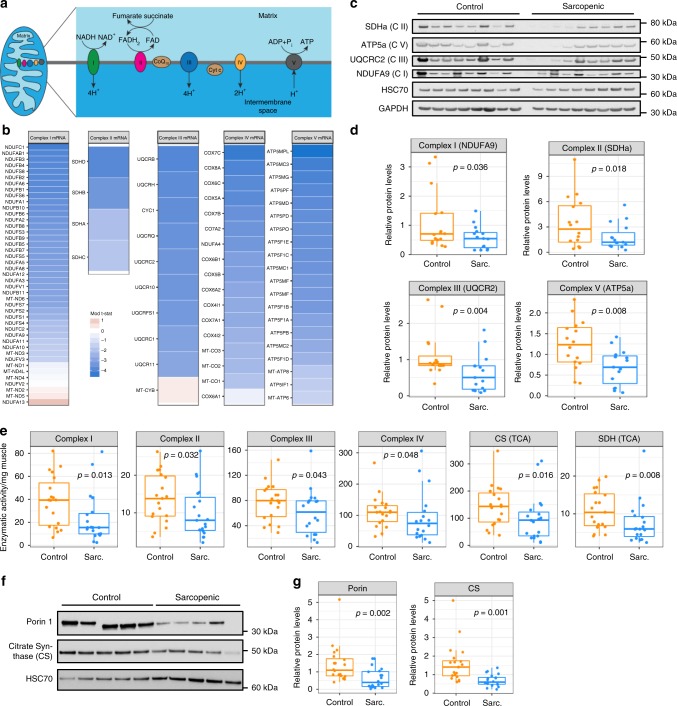
“Mitochondrial complex genes were downregulated in sarcopenic muscle across the five complexes (Fig. 5b)”
§ Mitochondrial oxidative capacity and NAD+ biosynthesis are reduced in human sarcopenia across ethnicities > Results > Mitochondrial bioenergetics is low in human sarcopenic muscle
plaincorrelational- Asserted: passes — The authors put it forward as true.
- Checkable: passes — It can be checked against evidence.
- Load-bearing: passes — The paper’s conclusions depend on it.
- Based: passes — The paper gives a reason why it holds.
A result the paper reports from its own data — it cites no other source for it, so there is none to check. The quote shows it is in the paper.
In the paper
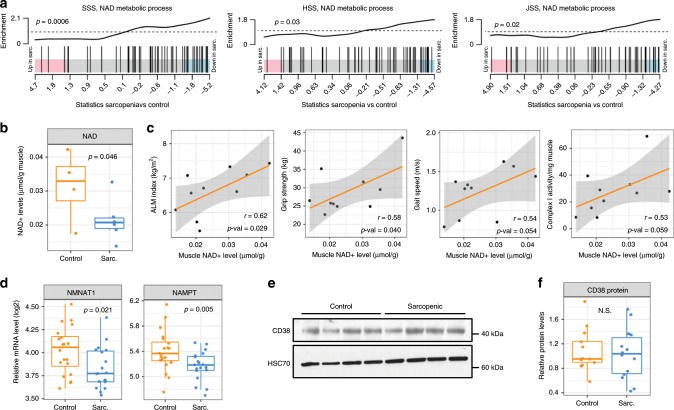
“In gene-set enrichment analysis, genes of the NAD metabolic process GO term were repressed in sarcopenia vs. control in SSS, HSS, and JSS (Fig. 6a).”
§ Mitochondrial oxidative capacity and NAD+ biosynthesis are reduced in human sarcopenia across ethnicities > Results > NAD+ levels are low in human sarcopenic muscle
plaincorrelational- Asserted: passes — The authors put it forward as true.
- Checkable: passes — It can be checked against evidence.
- Load-bearing: passes — The paper’s conclusions depend on it.
- Based: passes — The paper gives a reason why it holds.
A result the paper reports from its own data — it cites no other source for it, so there is none to check. The quote shows it is in the paper.
In the paper
“The expression of UPRmt genes (including mitochondrial heat-shock proteins, proteases and the downstream transcriptional response regulating mitohormesis from the nucleus) was low in sarcopenic muscle.”
§ Mitochondrial oxidative capacity and NAD+ biosynthesis are reduced in human sarcopenia across ethnicities > Discussion
plain- Asserted: passes — The authors put it forward as true.
- Checkable: passes — It can be checked against evidence.
- Load-bearing: passes — The paper’s conclusions depend on it.
- Based: passes — The paper gives a reason why it holds.
A result the paper reports from its own data — it cites no other source for it, so there is none to check. The quote shows it is in the paper.
In the paper
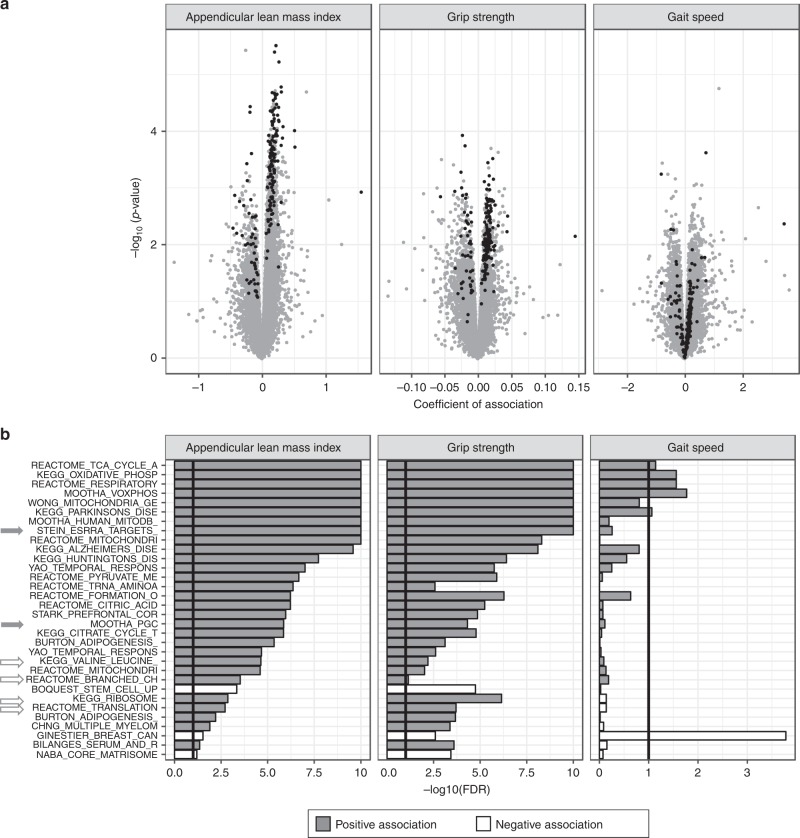
“The expression of 318 genes encoding 276 proteins and 42 noncoding RNAs were associated with ALMi at FDR < 10%.”
§ Mitochondrial oxidative capacity and NAD+ biosynthesis are reduced in human sarcopenia across ethnicities > Results > Muscle mass and strength drive the molecular phenotype of sarcopenia
plaincorrelational- Asserted: passes — The authors put it forward as true.
- Checkable: passes — It can be checked against evidence.
- Load-bearing: passes — The paper’s conclusions depend on it.
- Based: passes — The paper gives a reason why it holds.
The paper states this without a source or data behind it here, so there is nothing to check it against. The quote shows it is in the paper.
In the paper
“which is downregulated in by sarcopenia”
§ Mitochondrial oxidative capacity and NAD+ biosynthesis are reduced in human sarcopenia across ethnicities > Discussion
plaindirect- Asserted: passes — The authors put it forward as true.
- Checkable: passes — It can be checked against evidence.
- Load-bearing: passes — The paper’s conclusions depend on it.
- Based: passes — The paper gives a reason why it holds.
A result the paper reports from its own data — it cites no other source for it, so there is none to check. The quote shows it is in the paper.
In the paper
“Sarcopenic muscle had reduced expression of NMNAT1 and NAMPT, two rate-limiting enzymes of NAD+ biosynthesis and salvage (Fig. 6d and Supplementary Fig. 4c).”
§ Mitochondrial oxidative capacity and NAD+ biosynthesis are reduced in human sarcopenia across ethnicities > Results > NAD+ levels are low in human sarcopenic muscle
plaindirect- Asserted: passes — The authors put it forward as true.
- Checkable: passes — It can be checked against evidence.
- Load-bearing: passes — The paper’s conclusions depend on it.
- Based: passes — The paper gives a reason why it holds.
A result the paper reports from its own data — it cites no other source for it, so there is none to check. The quote shows it is in the paper.
In the paper
“Muscle NAD+ levels were decreased by 32% in sarcopenics vs. controls (Fig. 6b)”
§ Mitochondrial oxidative capacity and NAD+ biosynthesis are reduced in human sarcopenia across ethnicities > Results > NAD+ levels are low in human sarcopenic muscle
plaincorrelational- Asserted: passes — The authors put it forward as true.
- Checkable: passes — It can be checked against evidence.
- Load-bearing: passes — The paper’s conclusions depend on it.
- Based: passes — The paper gives a reason why it holds.
A result the paper reports from its own data — it cites no other source for it, so there is none to check. The quote shows it is in the paper.
In the paper
“At the pathway level, mitochondrial function was the strongest biological process associated with muscle mass and muscle function as continuous variables (Fig. 4b).”
§ Mitochondrial oxidative capacity and NAD+ biosynthesis are reduced in human sarcopenia across ethnicities > Results > Muscle mass and strength drive the molecular phenotype of sarcopenia
plaincorrelational- Asserted: passes — The authors put it forward as true.
- Checkable: passes — It can be checked against evidence.
- Load-bearing: passes — The paper’s conclusions depend on it.
- Based: passes — The paper gives a reason why it holds.
A result the paper reports from its own data — it cites no other source for it, so there is none to check. The quote shows it is in the paper.
In the paper
“In contrast, no increase in the expression of NAD+ consuming enzymes such as CD38 (Fig. 6e, f), PARPs (Supplementary Fig. 4e) or sirtuins (Supplementary Fig. 4f) was observed”
§ Mitochondrial oxidative capacity and NAD+ biosynthesis are reduced in human sarcopenia across ethnicities > Results > NAD+ levels are low in human sarcopenic muscle
plain- Asserted: passes — The authors put it forward as true.
- Checkable: passes — It can be checked against evidence.
- Load-bearing: passes — The paper’s conclusions depend on it.
- Based: passes — The paper gives a reason why it holds.
A result the paper reports from its own data — it cites no other source for it, so there is none to check. The quote shows it is in the paper.
In the paper
“In particular, the enzymatic activity of complexes I–IV was lower in sarcopenic muscle (Fig. 5e)”
§ Mitochondrial oxidative capacity and NAD+ biosynthesis are reduced in human sarcopenia across ethnicities > Results > Mitochondrial bioenergetics is low in human sarcopenic muscle
plaincorrelational- Asserted: passes — The authors put it forward as true.
- Checkable: passes — It can be checked against evidence.
- Load-bearing: passes — The paper’s conclusions depend on it.
- Based: passes — The paper gives a reason why it holds.
A result the paper reports from its own data — it cites no other source for it, so there is none to check. The quote shows it is in the paper.
In the paper
“The activity of the two mitochondrial TCA cycle enzymes citrate synthase (CS) and succinate dehydrogenase (SDH) were strongly reduced in sarcopenic muscle (Fig. 5e)”
§ Mitochondrial oxidative capacity and NAD+ biosynthesis are reduced in human sarcopenia across ethnicities > Results > Mitochondrial bioenergetics is low in human sarcopenic muscle
boosteddirect- Asserted: passes — The authors put it forward as true.
- Checkable: passes — It can be checked against evidence.
- Load-bearing: passes — The paper’s conclusions depend on it.
- Based: passes — The paper gives a reason why it holds.
A result the paper reports from its own data — it cites no other source for it, so there is none to check. The quote shows it is in the paper.
In the paper
“JSS revealed a weak inflammatory response in sarcopenic muscle (Supplementary Fig. 2l)”
§ Mitochondrial oxidative capacity and NAD+ biosynthesis are reduced in human sarcopenia across ethnicities > Results > Role of other molecular processes in human sarcopenia
plain- Asserted: passes — The authors put it forward as true.
- Checkable: passes — It can be checked against evidence.
- Load-bearing: unclear — It is unclear whether the paper’s conclusions depend on it.
- Based: passes — The paper gives a reason why it holds.
A conclusion the paper draws from its own results — it cites no other source for it, so there is none to check. The quote shows it is in the paper.
In the paper
“Thus, reduced transcriptional activity of ERRα and of PGC-1α-dependent transcription factors in sarcopenic muscle may contribute to the global mitochondrial alterations observed in sarcopenia.”
§ Mitochondrial oxidative capacity and NAD+ biosynthesis are reduced in human sarcopenia across ethnicities > Results > Altered signaling through ERRα and PGC-1α in sarcopenic muscle
hedgedconditional- Asserted: passes — The authors put it forward as true.
- Checkable: passes — It can be checked against evidence.
- Load-bearing: passes — The paper’s conclusions depend on it.
- Based: passes — The paper gives a reason why it holds.
A conclusion the paper draws from its own results — it cites no other source for it, so there is none to check. The quote shows it is in the paper.
In the paper
“Thus, mitochondrial energy production is the strongest transcriptional signature of sarcopenia and pathological muscle dysfunction.”
§ Mitochondrial oxidative capacity and NAD+ biosynthesis are reduced in human sarcopenia across ethnicities > Results > Mitochondrial dysfunction is the major transcriptional hallmark of sarcopenic muscle
boostedcorrelational- Asserted: passes — The authors put it forward as true.
- Checkable: passes — It can be checked against evidence.
- Load-bearing: passes — The paper’s conclusions depend on it.
- Based: passes — The paper gives a reason why it holds.
A conclusion the paper draws from its own results — it cites no other source for it, so there is none to check. The quote shows it is in the paper.
In the paper
“Together, transcriptomic analyses in the three independent cohorts confirmed a prominent contribution of genes controlling mitochondrial energy production and oxidative phosphorylation in maintaining muscle mass and function in older individuals of different ethnicity.”
§ Mitochondrial oxidative capacity and NAD+ biosynthesis are reduced in human sarcopenia across ethnicities > Results > Sarcopenia has a common transcriptional profile across ethnicities
boosteddirect- Asserted: passes — The authors put it forward as true.
- Checkable: passes — It can be checked against evidence.
- Load-bearing: passes — The paper’s conclusions depend on it.
- Based: passes — The paper gives a reason why it holds.
In the paper
“which can be assessed non-invasively using 31P imaging as a biomarker60”
§ Mitochondrial oxidative capacity and NAD+ biosynthesis are reduced in human sarcopenia across ethnicities > Discussion
What the sources say
- Not checked yetcites [60] Conley, K. E., Ali, A. S., Flores, B., Jubrias, S. A. & Shankland, E. G. Mitochondrial NAD(P)H In vivo: identifying natural indicators of oxidative phosphorylation in the (31)P magnetic resonance spectrum. Front. Physiol. 7, 45 (2016). source
plain- Asserted: passes — The authors put it forward as true.
- Checkable: passes — It can be checked against evidence.
- Load-bearing: passes — The paper’s conclusions depend on it.
- Based: passes — The paper gives a reason why it holds.
A conclusion the paper draws from its own results — it cites no other source for it, so there is none to check. The quote shows it is in the paper.
In the paper
“suggesting that reduced NAD+ levels in human sarcopenia primarily result from inability to synthesize and recycle NAD+.”
§ Mitochondrial oxidative capacity and NAD+ biosynthesis are reduced in human sarcopenia across ethnicities > Results > NAD+ levels are low in human sarcopenic muscle
hedgeddirect- Asserted: passes — The authors put it forward as true.
- Checkable: passes — It can be checked against evidence.
- Load-bearing: passes — The paper’s conclusions depend on it.
- Based: passes — The paper gives a reason why it holds.
A conclusion the paper draws from its own results — it cites no other source for it, so there is none to check. The quote shows it is in the paper.
In the paper
“suggesting that inflammation may associate with sarcopenia only in a specific subset of people.”
§ Mitochondrial oxidative capacity and NAD+ biosynthesis are reduced in human sarcopenia across ethnicities > Results > Role of other molecular processes in human sarcopenia
hedgedcorrelational- Asserted: passes — The authors put it forward as true.
- Checkable: passes — It can be checked against evidence.
- Load-bearing: unclear — It is unclear whether the paper’s conclusions depend on it.
- Based: passes — The paper gives a reason why it holds.
None of the sources cited for this claim have been checked yet.
In the paper
“the conversion of these precursors to NAD+ bypasses the rate limited enzyme NAMPT”
§ Mitochondrial oxidative capacity and NAD+ biosynthesis are reduced in human sarcopenia across ethnicities > Discussion
What the sources say
- Not checked yetcites [46] Rajman, L., Chwalek, K. & Sinclair, D. A. Therapeutic potential of NAD-boosting molecules: the in vivo evidence. Cell Metab. 27, 529–547 (2018). source
- Not checked yetcites [53] Zhang, H. et al. NAD(+) repletion improves mitochondrial and stem cell function and enhances life span in mice. Science 352, 1436–1443 (2016). source
- Not checked yetcites [54] Khan, N. A. et al. Effective treatment of mitochondrial myopathy by nicotinamide riboside, a vitamin B3. EMBO Mol. Med. 6, 721–731 (2014). source
plaindirect- Asserted: passes — The authors put it forward as true.
- Checkable: passes — It can be checked against evidence.
- Load-bearing: passes — The paper’s conclusions depend on it.
- Based: passes — The paper gives a reason why it holds.
A conclusion the paper draws from its own results — it cites no other source for it, so there is none to check. The quote shows it is in the paper.
In the paper
“Our work establishes loss of mitochondrial oxidative capacity as a major mechanism of sarcopenia”
§ Mitochondrial oxidative capacity and NAD+ biosynthesis are reduced in human sarcopenia across ethnicities > Discussion
boosteddirect- Asserted: passes — The authors put it forward as true.
- Checkable: passes — It can be checked against evidence.
- Load-bearing: passes — The paper’s conclusions depend on it.
- Based: passes — The paper gives a reason why it holds.
A conclusion the paper draws from its own results — it cites no other source for it, so there is none to check. The quote shows it is in the paper.
In the paper
“suggesting that low NAD+ levels in sarcopenic people could directly contribute to impaired mitochondrial activity and sarcopenia progression in humans.”
§ Mitochondrial oxidative capacity and NAD+ biosynthesis are reduced in human sarcopenia across ethnicities > Discussion
hedgedconditional- Asserted: passes — The authors put it forward as true.
- Checkable: passes — It can be checked against evidence.
- Load-bearing: passes — The paper’s conclusions depend on it.
- Based: passes — The paper gives a reason why it holds.
A conclusion the paper draws from its own results — it cites no other source for it, so there is none to check. The quote shows it is in the paper.
In the paper
“At the molecular level, mitochondrial alterations in sarcopenia involve the perturbation of a transcriptional module with reduced expression or activity in sarcopenic muscle of the transcriptional regulators ERRα and NRF1 and their coactivator PGC-1α.”
§ Mitochondrial oxidative capacity and NAD+ biosynthesis are reduced in human sarcopenia across ethnicities > Discussion
plaindirect- Asserted: passes — The authors put it forward as true.
- Checkable: passes — It can be checked against evidence.
- Load-bearing: passes — The paper’s conclusions depend on it.
- Based: passes — The paper gives a reason why it holds.
None of the sources cited for this claim have been checked yet.
In the paper
“However, low NAD+ is a causal mechanism for mitochondrial perturbations in age-related pathologies in model organisms49–51.”
§ Mitochondrial oxidative capacity and NAD+ biosynthesis are reduced in human sarcopenia across ethnicities > Discussion
What the sources say
- Not checked yetcites [49] Camacho-Pereira, J. et al. CD38 dictates age-related NAD Decline and mitochondrial dysfunction through an SIRT3-dependent mechanism. Cell Metab. 23, 1127–1139 (2016). source
- Not checked yetcites [50] Gomes, A. P. et al. Declining NAD(+) induces a pseudohypoxic state disrupting nuclear-mitochondrial communication during aging. Cell 155, 1624–1638 (2013). source
- Not checked yetcites [51] Canto, C. et al. The NAD(+) precursor nicotinamide riboside enhances oxidative metabolism and protects against high-fat diet-induced obesity. Cell Metab. 15, 838–847 (2012). source
plaindirect- Asserted: passes — The authors put it forward as true.
- Checkable: passes — It can be checked against evidence.
- Load-bearing: passes — The paper’s conclusions depend on it.
- Based: passes — The paper gives a reason why it holds.
A conclusion the paper draws from its own results — it cites no other source for it, so there is none to check. The quote shows it is in the paper.
In the paper
“suggesting that neuromuscular dysfunction is not a major transcriptional mechanism of human sarcopenia.”
§ Mitochondrial oxidative capacity and NAD+ biosynthesis are reduced in human sarcopenia across ethnicities > Results > Role of other molecular processes in human sarcopenia
hedged- Asserted: passes — The authors put it forward as true.
- Checkable: passes — It can be checked against evidence.
- Load-bearing: passes — The paper’s conclusions depend on it.
- Based: passes — The paper gives a reason why it holds.
A conclusion the paper draws from its own results — it cites no other source for it, so there is none to check. The quote shows it is in the paper.
In the paper
“Thus, our findings establish altered mitochondrial bioenergetic capacity through low oxidative phosphorylation as a strong and prominent determinant of the transition to disability in aged skeletal muscle.”
§ Mitochondrial oxidative capacity and NAD+ biosynthesis are reduced in human sarcopenia across ethnicities > Discussion
boosteddirect- Asserted: passes — The authors put it forward as true.
- Checkable: passes — It can be checked against evidence.
- Load-bearing: passes — The paper’s conclusions depend on it.
- Based: passes — The paper gives a reason why it holds.
A conclusion the paper draws from its own results — it cites no other source for it, so there is none to check. The quote shows it is in the paper.
In the paper
“suggesting that the down regulation we observed in sarcopenia could be causal in the loss of muscle mass and strength.”
§ Mitochondrial oxidative capacity and NAD+ biosynthesis are reduced in human sarcopenia across ethnicities > Discussion
hedgedconditional- Asserted: passes — The authors put it forward as true.
- Checkable: passes — It can be checked against evidence.
- Load-bearing: passes — The paper’s conclusions depend on it.
- Based: passes — The paper gives a reason why it holds.
A conclusion the paper draws from its own results — it cites no other source for it, so there is none to check. The quote shows it is in the paper.
In the paper
“The molecular signatures of sarcopenia vs. healthy older people revealed low mitochondrial bioenergetic capacity as the dominant signal in the transition from physiological to pathological muscle aging across ethnic groups.”
§ Mitochondrial oxidative capacity and NAD+ biosynthesis are reduced in human sarcopenia across ethnicities > Discussion
plaincorrelational- Asserted: passes — The authors put it forward as true.
- Checkable: passes — It can be checked against evidence.
- Load-bearing: passes — The paper’s conclusions depend on it.
- Based: passes — The paper gives a reason why it holds.
None of the sources cited for this claim have been checked yet.
In the paper
“new therapeutic strategies have emerged to restore NAD+ levels in muscle by administration of dietary NAD+ precursors such as NR or NMN46,53,54”
§ Mitochondrial oxidative capacity and NAD+ biosynthesis are reduced in human sarcopenia across ethnicities > Discussion
What the sources say
- Not checked yetcites [46] Rajman, L., Chwalek, K. & Sinclair, D. A. Therapeutic potential of NAD-boosting molecules: the in vivo evidence. Cell Metab. 27, 529–547 (2018). source
- Not checked yetcites [53] Zhang, H. et al. NAD(+) repletion improves mitochondrial and stem cell function and enhances life span in mice. Science 352, 1436–1443 (2016). source
- Not checked yetcites [54] Khan, N. A. et al. Effective treatment of mitochondrial myopathy by nicotinamide riboside, a vitamin B3. EMBO Mol. Med. 6, 721–731 (2014). source
plaindirect- Asserted: passes — The authors put it forward as true.
- Checkable: passes — It can be checked against evidence.
- Load-bearing: passes — The paper’s conclusions depend on it.
- Based: passes — The paper gives a reason why it holds.
- Probably not a substantial claim. 11
- It may state two separate claims as one. 17
The cited sources support only part of this claim — read each source’s verdict below.
In the paper
“Interestingly, genetic loss of function of Mfn2 and Opa1 in mice is sufficient to cause sarcopenia43–45”
§ Mitochondrial oxidative capacity and NAD+ biosynthesis are reduced in human sarcopenia across ethnicities > Discussion
What the sources say
- Partly supportedcites [43] Chen, H. et al. Mitochondrial fusion is required for mtDNA stability in skeletal muscle and tolerance of mtDNA mutations. Cell 141, 280–289 (2010). sourceExperimental — accuracy not yet measured
The Results sections report that mice lacking both Mfn1 and Mfn2 in skeletal muscle had smaller muscle fibers and reduced muscle size. OPA1 loss was examined in cells, not mice, and the paper does not establish sarcopenia as the outcome of Mfn2 and Opa1 loss. Page numbers are unavailable in our copy. (LLM, conf=0.88)
- Partly supportedcites [44] Sebastian, D. et al. Mfn2 deficiency links age-related sarcopenia and impaired autophagy to activation of an adaptive mitophagy pathway. EMBO J. 35, 1677–1693 (2016). sourceExperimental — accuracy not yet measured
The Results section reports that Mfn2-deficient mice develop muscle atrophy and that Mfn2 deficiency promotes sarcopenia during aging. The paper describes OPA1’s role in mitochondrial fusion but does not report that loss of Opa1 causes sarcopenia. It also shows age-related sarcopenia is aggravated by Mfn2 loss, rather than establishing that Mfn2 loss alone is sufficient to cause sarcopenia. (LLM, conf=0.88)
- Partly supportedcites [45] Tezze, C. et al. Age-associated Loss of OPA1 in muscle impacts muscle mass, metabolic homeostasis, systemic inflammation, and epithelial senescence. Cell Metab. 25, 1374–1389.e6 (2017). sourceExperimental — accuracy not yet measured
The Introduction reports that muscle-specific Opa1 deletion causes muscle loss, and the Discussion reports reduced muscle mass after combined Mfn1/Mfn2 deletion. The paper does not establish that loss of Mfn2 alone causes sarcopenia in mice; its mitofusin comparison concerns deletion of both genes. No page numbers are available in our copy. (LLM, conf=0.86)
plaindirect- Asserted: passes — The authors put it forward as true.
- Checkable: passes — It can be checked against evidence.
- Load-bearing: fails — The paper’s conclusions may not depend on it.
- Based: passes — The paper gives a reason why it holds.
Probably not a substantial claim. The paper’s conclusions may not depend on it.
- Partly supported
A result the paper reports from its own data — it cites no other source for it, so there is none to check. The quote shows it is in the paper.
In the paper
“As a sign of altered protein anabolism, mTOR signaling was repressed in sarcopenic muscle (FDR = 1.2E−02; Supplementary Fig. 2g), but to a much lesser extent than oxidative phosphorylation (FDR < 10E−10; Supplementary Fig. 1b).”
§ Mitochondrial oxidative capacity and NAD+ biosynthesis are reduced in human sarcopenia across ethnicities > Results > Role of other molecular processes in human sarcopenia
plaincorrelational- Asserted: passes — The authors put it forward as true.
- Checkable: passes — It can be checked against evidence.
- Load-bearing: unclear — It is unclear whether the paper’s conclusions depend on it.
- Based: passes — The paper gives a reason why it holds.
It may state two separate claims as one.
A result the paper reports from its own data — it cites no other source for it, so there is none to check. The quote shows it is in the paper.
In the paper
“This sarcopenic signature was enriched in downregulated genes, out of which 133 genes were annotated under the mitochondrion gene ontology term (Fig. 1b, green ticks).”
§ Mitochondrial oxidative capacity and NAD+ biosynthesis are reduced in human sarcopenia across ethnicities > Results > Mitochondrial dysfunction is the major transcriptional hallmark of sarcopenic muscle
plaincorrelational- Asserted: passes — The authors put it forward as true.
- Checkable: passes — It can be checked against evidence.
- Load-bearing: passes — The paper’s conclusions depend on it.
- Based: passes — The paper gives a reason why it holds.
It may state two separate claims as one.
A result the paper reports from its own data — it cites no other source for it, so there is none to check. The quote shows it is in the paper.
In the paper
“Gene-set enrichment analysis following high coverage RNA sequencing of sarcopenic and control muscle confirmed that mitochondrial bioenergetic dysfunction is a strong signature of sarcopenia in all cohorts/ethnicities (Fig. 3a), including lower oxidative phosphorylation, mitochondrial respiratory ETC and TCA cycle at FDR < 10E−04 and 10% in HSS and JSS, respectively (Fig. 3a).”
§ Mitochondrial oxidative capacity and NAD+ biosynthesis are reduced in human sarcopenia across ethnicities > Results > Sarcopenia has a common transcriptional profile across ethnicities
boostedcorrelational- Asserted: passes — The authors put it forward as true.
- Checkable: passes — It can be checked against evidence.
- Load-bearing: passes — The paper’s conclusions depend on it.
- Based: passes — The paper gives a reason why it holds.
It may state two separate claims as one.
A result the paper reports from its own data — it cites no other source for it, so there is none to check. The quote shows it is in the paper.
In the paper
“NDUFA9, SDHa, UQCR2, and ATP5a, representing complexes I, II, III, and V, respectively, were downregulated by 44–51% in sarcopenic muscle (Fig. 5d).”
§ Mitochondrial oxidative capacity and NAD+ biosynthesis are reduced in human sarcopenia across ethnicities > Results > Mitochondrial bioenergetics is low in human sarcopenic muscle
plaincorrelational- Asserted: passes — The authors put it forward as true.
- Checkable: passes — It can be checked against evidence.
- Load-bearing: passes — The paper’s conclusions depend on it.
- Based: passes — The paper gives a reason why it holds.
It may state two separate claims as one.
A result the paper reports from its own data — it cites no other source for it, so there is none to check. The quote shows it is in the paper.
In the paper
“and correlated positively with ALMi, grip strength, gait speed, and complex I activity (Fig. 6c).”
§ Mitochondrial oxidative capacity and NAD+ biosynthesis are reduced in human sarcopenia across ethnicities > Results > NAD+ levels are low in human sarcopenic muscle
plaincorrelational- Asserted: passes — The authors put it forward as true.
- Checkable: passes — It can be checked against evidence.
- Load-bearing: passes — The paper’s conclusions depend on it.
- Based: passes — The paper gives a reason why it holds.
It may state two separate claims as one.
What the paper did — it cites no source for this, so there is none to check. The quote shows it is in the paper.
In the paper
“Age-adjustment slightly decreased the statistical significance of the differentially expressed genes (Supplementary Fig. 1c), but the rank of genes differentially expressed in sarcopenic muscle was highly conserved (Supplementary Fig. 1d, Spearman rank correlation rs = 0.95).”
§ Mitochondrial oxidative capacity and NAD+ biosynthesis are reduced in human sarcopenia across ethnicities > Results > Mitochondrial dysfunction is the major transcriptional hallmark of sarcopenic muscle
plaincorrelational- Asserted: passes — The authors put it forward as true.
- Checkable: passes — It can be checked against evidence.
- Load-bearing: passes — The paper’s conclusions depend on it.
- Based: passes — The paper gives a reason why it holds.
It may state two separate claims as one.
What the paper did — it cites no source for this, so there is none to check. The quote shows it is in the paper.
In the paper
“Independent mRNA gene expression validation of 80 selected genes using nanoString nCounter demonstrated tight correlation with RNAseq data (Supplementary Fig. 1a; Supplementary Data 3), and confirmed lower expression of mitochondrial function genes in sarcopenic muscle (Fig. 1c).”
§ Mitochondrial oxidative capacity and NAD+ biosynthesis are reduced in human sarcopenia across ethnicities > Results > Mitochondrial dysfunction is the major transcriptional hallmark of sarcopenic muscle
boostedcorrelational- Asserted: passes — The authors put it forward as true.
- Checkable: passes — It can be checked against evidence.
- Load-bearing: passes — The paper’s conclusions depend on it.
- Based: passes — The paper gives a reason why it holds.
It may state two separate claims as one.
A conclusion the paper draws from its own results — it cites no other source for it, so there is none to check. The quote shows it is in the paper.
In the paper
“Translational mechanisms also overlapped with this transcriptional regulation as a large cluster of MRPs was downregulated in sarcopenia and likely contributed to the decreased protein expression of mitochondrial respiratory chain subunits.”
§ Mitochondrial oxidative capacity and NAD+ biosynthesis are reduced in human sarcopenia across ethnicities > Discussion
hedgedconditional- Asserted: passes — The authors put it forward as true.
- Checkable: passes — It can be checked against evidence.
- Load-bearing: passes — The paper’s conclusions depend on it.
- Based: passes — The paper gives a reason why it holds.
It may state two separate claims as one.
None of the sources cited for this claim have been checked yet.
In the paper
“Reduced NAD+ levels in skeletal muscle of aged or Nampt deficient mice alter mitochondrial bioenergetics and impair muscle mass, strength and endurance49,50,52,53”
§ Mitochondrial oxidative capacity and NAD+ biosynthesis are reduced in human sarcopenia across ethnicities > Discussion
What the sources say
- Not checked yetcites [49] Camacho-Pereira, J. et al. CD38 dictates age-related NAD Decline and mitochondrial dysfunction through an SIRT3-dependent mechanism. Cell Metab. 23, 1127–1139 (2016). source
- Not checked yetcites [50] Gomes, A. P. et al. Declining NAD(+) induces a pseudohypoxic state disrupting nuclear-mitochondrial communication during aging. Cell 155, 1624–1638 (2013). source
- Not checked yetcites [52] Frederick, D. W. et al. Loss of NAD homeostasis leads to progressive and reversible degeneration of skeletal muscle. Cell Metab. 24, 269–282 (2016). source
- Not checked yetcites [53] Zhang, H. et al. NAD(+) repletion improves mitochondrial and stem cell function and enhances life span in mice. Science 352, 1436–1443 (2016). source
plaindirect- Asserted: passes — The authors put it forward as true.
- Checkable: passes — It can be checked against evidence.
- Load-bearing: passes — The paper’s conclusions depend on it.
- Based: passes — The paper gives a reason why it holds.
Probably not a substantial claim. It may state two separate claims as one.
A conclusion the paper draws from its own results — it cites no other source for it, so there is none to check. The quote shows it is in the paper.
In the paper
“Thus, human sarcopenia is driven by a major mitochondrial deficit detected both transcriptionally and functionally, for which reduced levels of NAD+ in muscle impair metabolic homeostasis and contribute to functional decline by altering muscle bioenergetics.”
§ Mitochondrial oxidative capacity and NAD+ biosynthesis are reduced in human sarcopenia across ethnicities > Results > NAD+ levels are low in human sarcopenic muscle
plaindirect- Asserted: passes — The authors put it forward as true.
- Checkable: passes — It can be checked against evidence.
- Load-bearing: passes — The paper’s conclusions depend on it.
- Based: passes — The paper gives a reason why it holds.
It may state two separate claims as one.
A conclusion the paper draws from its own results — it cites no other source for it, so there is none to check. The quote shows it is in the paper.
In the paper
“Reduced complex activity was linked to lower amounts of mitochondria as it was not affected when normalized to CS activity (Supplementary Fig. 3b).”
§ Mitochondrial oxidative capacity and NAD+ biosynthesis are reduced in human sarcopenia across ethnicities > Results > Mitochondrial bioenergetics is low in human sarcopenic muscle
plaincorrelational- Asserted: passes — The authors put it forward as true.
- Checkable: passes — It can be checked against evidence.
- Load-bearing: passes — The paper’s conclusions depend on it.
- Based: passes — The paper gives a reason why it holds.
It may state two separate claims as one.
A conclusion the paper draws from its own results — it cites no other source for it, so there is none to check. The quote shows it is in the paper.
In the paper
“Together, these results demonstrate that all clinical parameters used to diagnose sarcopenia contribute to the molecular profiles of sarcopenic muscle, with the strongest contribution from low muscle mass followed by grip strength and gait speed.”
§ Mitochondrial oxidative capacity and NAD+ biosynthesis are reduced in human sarcopenia across ethnicities > Results > Muscle mass and strength drive the molecular phenotype of sarcopenia
boostedcorrelational- Asserted: passes — The authors put it forward as true.
- Checkable: passes — It can be checked against evidence.
- Load-bearing: passes — The paper’s conclusions depend on it.
- Based: passes — The paper gives a reason why it holds.
It may state two separate claims as one.
What the paper did — it cites no source for this, so there is none to check. The quote shows it is in the paper.
In the paper
“Although our NAD+ results require further validation as they were analyzed in a subset of individuals with sufficient amounts of remaining muscle biopsy from SSS”
§ Mitochondrial oxidative capacity and NAD+ biosynthesis are reduced in human sarcopenia across ethnicities > Discussion
hedged- Asserted: passes — The authors put it forward as true.
- Checkable: passes — It can be checked against evidence.
- Load-bearing: passes — The paper’s conclusions depend on it.
- Based: passes — The paper gives a reason why it holds.
Probably not a substantial claim.
In the paper
“NAD+ decline during aging is well documented in preclinical models and has recently emerged in humans where skin and brain NAD+ decreases across the lifespan46.”
§ Mitochondrial oxidative capacity and NAD+ biosynthesis are reduced in human sarcopenia across ethnicities > Discussion
What the sources say
- Not checked yetcites [46] Rajman, L., Chwalek, K. & Sinclair, D. A. Therapeutic potential of NAD-boosting molecules: the in vivo evidence. Cell Metab. 27, 529–547 (2018). source
boostedcorrelational- Asserted: passes — The authors put it forward as true.
- Checkable: passes — It can be checked against evidence.
- Load-bearing: fails — The paper’s conclusions may not depend on it.
- Based: passes — The paper gives a reason why it holds.
Probably not a substantial claim. The paper’s conclusions may not depend on it. It may state two separate claims as one.
A conclusion the paper draws from its own results — it cites no other source for it, so there is none to check. The quote shows it is in the paper.
In the paper
“Thus, sarcopenia arises from a general bioenergetic deficit which differs mechanistically from primary mitochondrial myopathies caused by decreased activity of a specific complex.”
§ Mitochondrial oxidative capacity and NAD+ biosynthesis are reduced in human sarcopenia across ethnicities > Results > Mitochondrial bioenergetics is low in human sarcopenic muscle
plaindirect- Asserted: passes — The authors put it forward as true.
- Checkable: passes — It can be checked against evidence.
- Load-bearing: passes — The paper’s conclusions depend on it.
- Based: passes — The paper gives a reason why it holds.
It may state two separate claims as one.
A conclusion the paper draws from its own results — it cites no other source for it, so there is none to check. The quote shows it is in the paper.
In the paper
“Collectively, the MEMOSA study results provide a genome-wide molecular resource of mechanisms and biomarkers of pathological muscle aging across ethnicities.”
§ Mitochondrial oxidative capacity and NAD+ biosynthesis are reduced in human sarcopenia across ethnicities > Discussion
plain- Asserted: passes — The authors put it forward as true.
- Checkable: passes — It can be checked against evidence.
- Load-bearing: passes — The paper’s conclusions depend on it.
- Based: passes — The paper gives a reason why it holds.
Probably not a substantial claim.
None of the sources cited for this claim have been checked yet.
In the paper
“The established benefits of physical activity on mitochondrial efficiency in aged skeletal muscle2,47,59”
§ Mitochondrial oxidative capacity and NAD+ biosynthesis are reduced in human sarcopenia across ethnicities > Discussion
What the sources say
- Not checked yetcites [2] Cartee, G. D., Hepple, R. T., Bamman, M. M. & Zierath, J. R. Exercise promotes healthy aging of skeletal muscle. Cell Metab. 23, 1034–1047 (2016). source
- Not checked yetcites [47] Greggio, C. et al. Enhanced respiratory chain supercomplex formation in response to exercise in human skeletal muscle. Cell Metab. 25, 301–311 (2017). source
- Not checked yetcites [59] Broskey, N. T. et al. Skeletal muscle mitochondria in the elderly: effects of physical fitness and exercise training. J. Clin. Endocrinol. Metab. 99, 1852–1861 (2014). source
boosteddirect- Asserted: passes — The authors put it forward as true.
- Checkable: passes — It can be checked against evidence.
- Load-bearing: fails — The paper’s conclusions may not depend on it.
- Based: passes — The paper gives a reason why it holds.
Probably not a substantial claim. The paper’s conclusions may not depend on it.
None of the sources cited for this claim have been checked yet.
In the paper
“the demonstration that these interventions are safe and increase NAD+ levels in early human clinical testing46,55,56”
§ Mitochondrial oxidative capacity and NAD+ biosynthesis are reduced in human sarcopenia across ethnicities > Discussion
What the sources say
- Not checked yetcites [46] Rajman, L., Chwalek, K. & Sinclair, D. A. Therapeutic potential of NAD-boosting molecules: the in vivo evidence. Cell Metab. 27, 529–547 (2018). source
- Not checked yetcites [55] Elhassan, Y. S. et al. Nicotinamide riboside augments the aged human skeletal muscle NAD(+) metabolome and induces transcriptomic and anti-inflammatory signatures. Cell Rep. 28, 1717–1728 (2019). e1716. source
- Not checked yetcites [56] Martens, C. R. et al. Chronic nicotinamide riboside supplementation is well-tolerated and elevates NAD(+) in healthy middle-aged and older adults. Nat. Commun. 9, 1286 (2018). source
boosteddirect- Asserted: passes — The authors put it forward as true.
- Checkable: passes — It can be checked against evidence.
- Load-bearing: passes — The paper’s conclusions depend on it.
- Based: passes — The paper gives a reason why it holds.
It may state two separate claims as one.
What the paper did — it cites no source for this, so there is none to check. The quote shows it is in the paper.
In the paper
“One sample (from the SSS cohort) which did not reach this threshold because of an abnormally low percentage of uniquely mapped reads was excluded from the analysis.”
§ Mitochondrial oxidative capacity and NAD+ biosynthesis are reduced in human sarcopenia across ethnicities > Methods > mRNA differential expression & pathway enrichment analyses
plainSingle case- Asserted: passes — The authors put it forward as true.
- Checkable: passes — It can be checked against evidence.
- Load-bearing: fails — The paper’s conclusions may not depend on it.
- Based: passes — The paper gives a reason why it holds.
Probably not a substantial claim. The paper’s conclusions may not depend on it.
A conclusion the paper draws from its own results — it cites no other source for it, so there is none to check. The quote shows it is in the paper.
In the paper
“our study creates the mechanistic basis to test the clinical efficacy of NAD+ precursors on muscle strength and physical function in older people with sarcopenia.”
§ Mitochondrial oxidative capacity and NAD+ biosynthesis are reduced in human sarcopenia across ethnicities > Discussion
plain- Asserted: passes — The authors put it forward as true.
- Checkable: fails — It may be too vague to check against evidence.
- Load-bearing: passes — The paper’s conclusions depend on it.
- Based: passes — The paper gives a reason why it holds.
Probably not a substantial claim. It may be too vague to check against evidence.
What the paper did — it cites no source for this, so there is none to check. The quote shows it is in the paper.
In the paper
“All RNA samples were homogeneous and passed quality control with 260/280 nm ratio > 1.8 and RIN scores > 7.”
§ Mitochondrial oxidative capacity and NAD+ biosynthesis are reduced in human sarcopenia across ethnicities > Methods > RNA extraction
plain- Asserted: passes — The authors put it forward as true.
- Checkable: passes — It can be checked against evidence.
- Load-bearing: fails — The paper’s conclusions may not depend on it.
- Based: passes — The paper gives a reason why it holds.
Probably not a substantial claim. The paper’s conclusions may not depend on it. It may state two separate claims as one.
What the paper did — it cites no source for this, so there is none to check. The quote shows it is in the paper.
In the paper
“Complexes I–III and V were correctly detected in all samples but complex IV was only detected in less than 20% of samples and was excluded from the analysis.”
§ Mitochondrial oxidative capacity and NAD+ biosynthesis are reduced in human sarcopenia across ethnicities > Methods > Western blot
plain- Asserted: passes — The authors put it forward as true.
- Checkable: passes — It can be checked against evidence.
- Load-bearing: fails — The paper’s conclusions may not depend on it.
- Based: passes — The paper gives a reason why it holds.
Probably not a substantial claim. The paper’s conclusions may not depend on it. It may state two separate claims as one.
A conclusion the paper draws from its own results — it cites no other source for it, so there is none to check. The quote shows it is in the paper.
In the paper
“provides a strong rationale for intervention trials targeting muscle mitochondrial bioenergetics to manage sarcopenia in older people.”
§ Mitochondrial oxidative capacity and NAD+ biosynthesis are reduced in human sarcopenia across ethnicities > Discussion
boosted- Asserted: passes — The authors put it forward as true.
- Checkable: fails — It may be too vague to check against evidence.
- Load-bearing: passes — The paper’s conclusions depend on it.
- Based: passes — The paper gives a reason why it holds.
Probably not a substantial claim. It may be too vague to check against evidence.
The paper relies on this without support.
Little is known about the molecular processes of pathological sarcopenia compared with healthy muscle aging.
“While the molecular processes associated with the average functional decline of muscle in the healthy population have been well studied, little is known about the pathological state of sarcopenia, the pathological muscle wasting and weakness of the old age recently assigned an ICD-10 disease code due to its negative impact on physical function, quality of life, and survival6,19–21.”
The paper relies on this without support.
The clinical definition of sarcopenia is standardized enough to characterize a molecular signature of sarcopenia in older people.
“Standardization of the clinical definition now provides an opportunity to characterize the molecular “signature” of sarcopenia in older people.”
Claims other papers make about this one
Each is checked against this paper’s own text: does it say what the citing paper says it does?
The source backs part of the claim, not all of it — or backs it for a different population, condition or comparison.
In the citing paper
“Mitochondrial dysfunction and low nicotinamide adenine dinucleotide (NAD+) levels are hallmarks of skeletal muscle ageing and sarcopenia1–3”
From Trigonelline Is an NAD+ Precursor That Improves Muscle Function during Ageing and Is Reduced in Human Sarcopenia (2024) · cites this paper as [3]
Experimental — accuracy not yet measuredIn the citing paper
“Our previous profiling of muscle biopsies from patients with sarcopenia versus age-matched healthy controls revealed that mitochondrial dysfunction and reduced NAD+, two well-established molecular hallmarks of organismal ageing11, are prominent features of pathological progression and sarcopenia3.”
From Trigonelline Is an NAD+ Precursor That Improves Muscle Function during Ageing and Is Reduced in Human Sarcopenia (2024) · cites this paper as [3]
Self-check
Percentages, sums and reported differences re-computed from the paper’s own numbers.
Each contradiction between two passages listed here was confirmed by an independent check.
Rated minor: it would not touch a result — a value no result rests on, a p-value that stays on the same side of the significance level, or a conflict that is clerical, resolved elsewhere in the paper, or outside its own findings.
In the paper
§ Mitochondrial oxidative capacity and NAD+ biosynthesis are reduced in human sarcopenia across ethnicities > Results > Mitochondrial dysfunction is the major transcriptional hallmark of sarcopenic muscle
“179 genes encoding 150 proteins and 29 noncoding RNAs were altered in sarcopenic muscle”
§ Mitochondrial oxidative capacity and NAD+ biosynthesis are reduced in human sarcopenia across ethnicities > Methods > Network and gene ontology analyses
“Protein interaction networks were generated with the 149 protein coding genes differentially regulated in sarcopenia”
Citations
Cites
Subramanian, A., Tamayo, P., Mootha, V. K., Mukherjee, S., Ebert, B. L., Gillette, M. A., Paulovich, A., Pomeroy, S. L., Golub, T. R., Lander, E. S., et al. (2005) · Proceedings of the National Academy of Sciences · doi:10.1073/pnas.0506580102 · Cited by 53,625
STAR: ultrafast universal RNA-seq aligner
Dobin, A., Davis, C. A., Schlesinger, F., Drenkow, J., Zaleski, C., Jha, S., Batut, P., Chaisson, M., & Gingeras, T. R. (2013) · Bioinformatics · doi:10.1093/bioinformatics/bts635 · Cited by 51,709
Robinson, M. D., McCarthy, D. J., & Smyth, G. K. (2010) · Bioinformatics · doi:10.1093/bioinformatics/btp616 · Cited by 41,364
HTSeq—a Python framework to work with high-throughput sequencing data
Anders, S., Pyl, P. T., & Huber, W. (2015) · Bioinformatics · doi:10.1093/bioinformatics/btu638 · Cited by 21,464
López-Otín, C., Blasco, M. A., Partridge, L., Serrano, M., & Kroemer, G. (2013) · Cell · doi:10.1016/j.cell.2013.05.039 · Cited by 14,982
Heinz, S., Benner, C., Spann, N., Bertolino, E., Lin, Y. C., Laslo, P., Cheng, J. X., Murre, C., Singh, H., & Glass, C. K. (2010) · Molecular Cell · doi:10.1016/j.molcel.2010.05.004 · Cited by 13,382
Smyth, G. K. (2004) · Statistical Applications in Genetics and Molecular Biology · doi:10.2202/1544-6115.1027 · Cited by 11,829
Sarcopenia: European consensus on definition and diagnosis
Cruz-Jentoft, A. J., Baeyens, J. P., Bauer, J. M., Boirie, Y., Cederholm, T., Landi, F., Martin, F. C., Michel, J.-P., Rolland, Y., Schneider, S. M., et al. (2010) · Age and Ageing · doi:10.1093/ageing/afq034 · Cited by 11,601
Gait speed and survival in older adults.
Studenski, S. (2011) · JAMA · doi:10.1001/jama.2010.1923 · Cited by 4,558
Sarcopenia in Asia: Consensus Report of the Asian Working Group for Sarcopenia
Chen, L.-K., Liu, L.-K., Woo, J., Assantachai, P., Auyeung, T.-W., Bahyah, K. S., Chou, M.-Y., Chen, L.-Y., Hsu, P.-S., Krairit, O., et al. (2014) · Journal of the American Medical Directors Association · doi:10.1016/j.jamda.2013.11.025 · Cited by 4,051
Cited by
Sorted by citations
NAD+ metabolism: pathophysiologic mechanisms and therapeutic potential
Xie, N., Zhang, L., Gao, W. Q., Huang, C., Huber, P., Zhou, X., Li, C. L., Shen, G., & Zou, B. (2020) · Signal Transduction and Targeted Therapy · doi:10.1038/s41392-020-00311-7 · Cited by 1,147
“Controlling NAD-biosynthesis pathway Enhancing NAD-biosynthesis is one alternative approach to elevate NAD concentration through either increasing the activity of enzymes in NAD-biosynthetic pathway or inhibiting the activity of enzymes in the side branch pathway.(633) NAD is synthesized from both de novo pathway and…”
Sarcopenia definition, diagnosis and treatment: consensus is growing
Sayer, A. A., & Cruz-Jentoft, A. J. (2022) · Age and Ageing · doi:10.1093/ageing/afac220 · Cited by 616
“For example, a study demonstrating that mitochondrial oxidative capacity and NAD+ biosynthesis were reduced in human sarcopenia [31] has informed a pilot experimental ageing medicine study using a drug that enhances NHAD levels to see if there may be beneficial effects in sarcopenia.”
BackgroundSelf-citationBao, H., Cao, J., Chen, M., Min, C., Chen, W., Chen, X., Chen, Y., Chen, Y., Chen, Y., Chen, Z., et al. (2023) · Science China Life Sciences · doi:10.1007/s11427-023-2305-0 · Cited by 402
El Assar, M., Álvarez-Bustos, A., Sosa, P., Angulo, J., & Rodríguez-Mañas, L. (2022) · International Journal of Molecular Sciences · doi:10.3390/ijms23158713 · Cited by 371
“Aging is associated with muscle mass loss and a reduction in uscle strength resulting fro inefficient path ay of anabolic resistance (characterized by decreased insulin-like growth factor (IGF-1) and proteaso e dysregulation and itochondrial dysfunction, specifica ly reduced expression of factor peroxisome proliferato…”
BackgroundInfluentialLu, Q., Zhu, Y., Deng, C., Liang, Z., Chen, J., Chen, Y., Wang, X., Liu, Y., Tian, Y., & Yang, Y. (2024) · Signal Transduction and Targeted Therapy · doi:10.1038/s41392-024-01756-w · Cited by 391
Metadata
- Authors
- Migliavacca, E., Tay, S. K. H., Patel, H. P., Sonntag, T., Civiletto, G., McFarlane, C., Forrester, T., Barton, S. J., Leow, M. K., Antoun, E., Charpagne, A., Seng Chong, Y., Descombes, P., Feng, L., Francis-Emmanuel, P., Garratt, E. S., Giner, M. P., Green, C. O., Karaz, S., Kothandaraman, N., Marquis, J., Metairon, S., Moco, S., Nelson, G., Ngo, S., Pleasants, T., Raymond, F., Sayer, A. A., Ming Sim, C., Slater-Jefferies, J., Syddall, H. E., Fang Tan, P., Titcombe, P., Vaz, C., Westbury, L. D., Wong, G., Yonghui, W., Cooper, C., Sheppard, A., Godfrey, K. M., Lillycrop, K. A., Karnani, N., & Feige, J. N.
- Affiliations
- École Polytechnique Fédérale de Lausanne (CH)
- National University of Singapore (SG)
- University Hospital Southampton NHS Foundation Trust (GB)
- James Cook University (AU)
- University of the West Indies (JM)
- MRC Lifecourse Epidemiology Unit (GB)
- Agency for Science, Technology and Research (SG)
- University of Southampton (GB)
- University of Auckland (NZ)
- NIHR Newcastle Biomedical Research Centre (GB)
- Corresponding author
- Godfrey, Keith M.
- Lillycrop, Karen A.
- Karnani, Neerja
- ORCID
- Migliavacca, Eugenia
- Tay, Stacey K. H.
- Patel, Harnish P.
- Civiletto, Gabriele
- McFarlane, Craig
- Barton, Sheila J.
- Leow, Melvin K.
- Antoun, Elie
- Charpagne, Aline
- Seng Chong, Yap
- Descombes, Patrick
- Francis-Emmanuel, Patrice
- Garratt, Emma S.
- Giner, Maria Pilar
- Marquis, Julien
- Metairon, Sylviane
- Moco, Sofia
- Raymond, Frederic
- Sayer, Avan A.
- Slater-Jefferies, Jo
- Syddall, Holly E.
- Titcombe, Philip
- Vaz, Candida
- Westbury, Leo D.
- Cooper, Cyrus
- Godfrey, Keith M.
- Lillycrop, Karen A.
- Karnani, Neerja
- Feige, Jerome N.
- Venue
- Nature Communications
- Published
- 2019-12-20
- Volume
- 10
- Issue
- 1
- Pages
- 5808-5808
- ISSN
- 2041-1723 (ISSN-L)
- PMC
- PMC6925228
- OpenAlex
- W2992356442
- Semantic Scholar
- d022163e1837e1b77bb72fbeb26e8415b92d6063
- Cited by
- 365
- References
- 75
- Citations by year
- 2026: 66 · 2025: 74 · 2024: 65 · 2023: 56 · 2022: 50 · 2021: 37 · 2020: 16
- FWCI
- 8.52
- Type
- journal article
- Language
- en
- Open access
- gold
- doi.org
- Locations
- Nature Communications (publishedVersion, cc-by)
- Europe PMC (PubMed Central) (publishedVersion, cc-by)
- PubMed Central (publishedVersion, cc-by)
- PubMed (publishedVersion)
- ResearchOnline at James Cook University (James Cook University) (submittedVersion)
- ePrints Soton (University of Southampton) (submittedVersion)
- National University of Singapore (submittedVersion)
- RePEc: Research Papers in Economics (submittedVersion)
- DOAJ (DOAJ: Directory of Open Access Journals) (submittedVersion)
- DOAJ (DOAJ: Directory of Open Access Journals) (submittedVersion, cc-by-sa)
- Infoscience (Ecole Polytechnique Fédérale de Lausanne) (submittedVersion, cc-by-nc-nd)
- Funders
- University Hospital Southampton NHS Foundation Trust
- National Institute for Health and Care Research (NF-SI-0515-10042, NIHR200286, NF-SI-0508-10082, U24AG047867, 289346, CL-2011-26-002, NF-SI-0617-10109, NF-SI-0513-10085)
- National Osteoporosis Society
- University of Southampton
- University of Oxford
- European Commission (FP7/2007, 289346)
- Agency for Science, Technology and Research
- National University of Singapore
- Singapore Institute for Clinical Sciences
- International Osteoporosis Foundation
- National Institute for Health Research Southampton Biomedical Research Centre (289346)
- National Institutes of Health
- Directorate for Biological Sciences
- Medical Research Council (MC_UU_20/4, MC_UU_12011/4, MC_UU_12011/2, MC_U47585827, MC_UU_12011/1, MC_ST_U2055)
- Biotechnology and Biological Sciences Research Council (ES/M0099X)
- Economic and Social Research Council
- National Institute on Aging (U24AG047867)
- Topics
- Life Sciences › Biochemistry, Genetics and Molecular Biology › Molecular Biology › Muscle Physiology and Disorders
- Health Sciences › Medicine › Physiology (medical) › Nutrition and Health in Aging
- Life Sciences › Biochemistry, Genetics and Molecular Biology › Molecular Biology › Mitochondrial Function and Pathology
- Keywords
- sarcopenia, mitochondrial oxidative capacity, NAD biosynthesis, NAD+ salvage pathway, skeletal muscle aging, oxidative phosphorylation, mitochondrial proteostasis, mitochondrial respiratory chain, mitochondrial mass, ethnic differences, older men
- MeSH terms
- Proteostasis, Aged, Aged, 80 and over, Aging, Biopsy, Energy Metabolism, United Kingdom, Humans, Jamaica, Male, Middle Aged, Mitochondria, NAD, Oxidation-Reduction, Oxidative Phosphorylation, Singapore, Case-Control Studies, Oxidative Stress, Muscle, Skeletal, Sarcopenia
About these checks
Registry, retraction, Cites and statistics results are computed, not judged, with one exception: a printed reference that no index lists is read once by a model before it counts as a citation error. Claims are extracted by a model and kept only when their quote appears verbatim in the text; each cited source is then checked, with a model’s help, for whether it says what the claim relies on. Those verdicts can be wrong — read the claim’s quote and the cited source before relying on one.
A language model drew the claims from the paper on 2026-10-09, under version 3 of the claim definition (model deepseek-v4.1-flash, prompt extract-v3).
A second model labelled each claim on 2026-10-09 (model jev-1.13-20260917, definition revision gold-guideline-v0.2).
Cited sources are checked with a language model’s help (gpt-6-sol).
Statistics and arithmetic are recomputed, not judged.
Confidence bands are shown only for fields calibrated on our annotated test set. None is calibrated yet, so no band is shown.
What counts as a claim ›How we measure confidence ›How we check this ›
Are you an author, or do you see a problem with this page? Request a review
