

The DOI matches its Crossref record; 23 of the 23 references it cites were found in a registry or an index; none of the 26 sources its claims cite is checked for support yet.
Cerebrospinal fluid tracer efflux to parasagittal dura in humans
Open accessAbstract
The mechanisms behind molecular transport from cerebrospinal fluid to dural lymphatic vessels remain unknown. This study utilized magnetic resonance imaging along with cerebrospinal fluid tracer to visualize clearance pathways to human dural lymphatics in vivo. In 18 subjects with suspicion of various types of cerebrospinal fluid disorders, 3D T2-Fluid Attenuated Inversion Recovery, T1-black-blood, and T1 gradient echo acquisitions were obtained prior to intrathecal administration of the contrast agent gadobutrol (0.5 ml, 1 mmol/ml), serving as a cerebrospinal fluid tracer. Propagation of tracer was followed with T1 sequences at 3, 6, 24 and 48 h after the injection. The tracer escaped from cerebrospinal fluid into parasagittal dura along the superior sagittal sinus at areas nearby entry of cortical cerebral veins. The findings demonstrate that trans-arachnoid molecular passage does occur and suggest that parasagittal dura may serve as a bridging link between human brain and dural lymphatic vessels.
Overview
AI snapshot
Written from the paper’s full text.
TL;DR
In 18 patients with suspected cerebrospinal fluid (CSF) disorders, intrathecal gadobutrol tracer was followed by MRI for up to 48 h and escaped from CSF into parasagittal dura along the superior sagittal sinus. The findings suggest parasagittal dura may bridge molecular exchange between brain/CSF and dural lymphatic vessels in humans.
Key findings
- Parasagittal dura was identified in 18/18 patients; after intrathecal gadobutrol, normalized T1-BB signal increased in parasagittal dura at 6, 24, and 48 h, peaking at 24 h (mean percentage change from pre: 156 ± 148 at 6 h, 194 ± 188 at 24 h, 98 ± 79 at 48 h; Table 2).
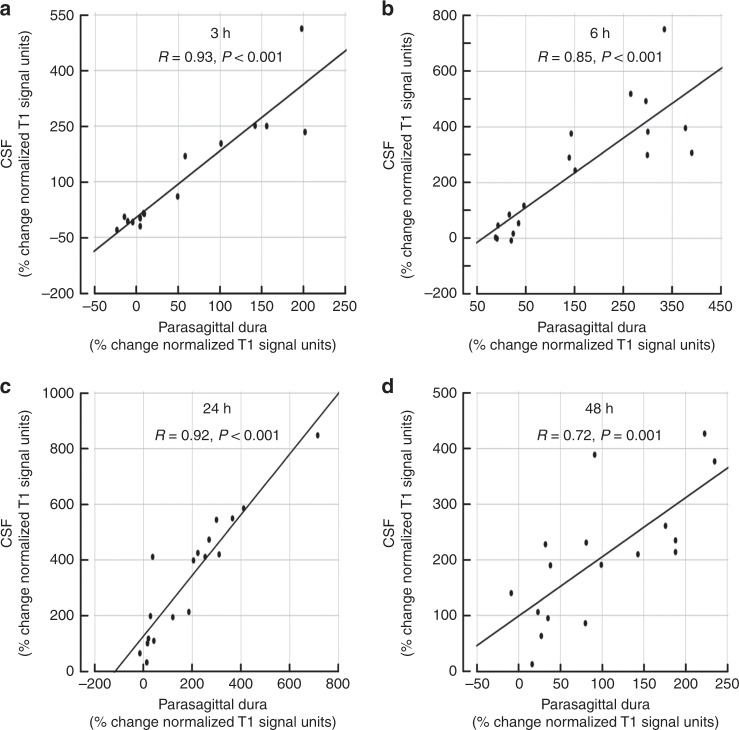
- At group level, signal change was highly significant in both parasagittal dura and nearby CSF, was largest within CSF, and signal increases in CSF and parasagittal dura were highly associated (R = 0.92, P < 0.001), with strong positive correlation at all time points.
- Tracer enhancement below skull base outlets was visually detected below the hypoglossal canal in 17/18, the jugular foramen in 17/18, the cribriform plate in 2/18, and the foramen ovale in 0/18.
- Tubular structures resembling dural lymphatic vessels could not be discriminated from other enhancing parasagittal dura tissue, possibly related to the 1 × 1 × 1 mm MRI voxel resolution.
Methods
- Prospective observational study of 18 consecutive individuals referred to neurosurgery for various CSF circulation disorders; no randomization or a priori sample size calculation was used. Exclusion criteria included contrast hypersensitivity, severe allergy, renal dysfunction, age <18 or >80 years, and pregnancy/breastfeeding.
- Scans were obtained on a 3-Tesla MRI with 3D T2-FLAIR, T1-black-blood, and T1-gradient echo acquisitions; T1-weighted scans were repeated at 3, 6, 24, and 48 h after intrathecal injection of 0.5 ml gadobutrol (1 mmol/ml), preceded by iodixanol to confirm needle position.
- Regions of interest were placed in parasagittal dura and adjacent subarachnoid CSF on T1-black-blood images, normalized against the ocular bulb vitreous body; differences used linear mixed models with random intercept, correlations used Pearson coefficient, and significance was set at 0.05.
Limitations
- Stated in the paper: MRI resolution was limited to 1 mm voxel size; lack of T1-mapping techniques restricted measures to semi-quantitative tracer enrichment; the ocular bulb reference may be affected by motion artifacts; and the 48-h multi-phase protocol limited the number of scans per patient, making the peak enhancement time a rough estimate.
- Evident from the text: the cohort was small (18 patients) and clinically heterogeneous, with no healthy controls; the study could not resolve dural lymphatic vessels directly or quantify the relative importance of parasagittal versus basal outflow pathways.
Model-written summary. Check it against the paper before relying on it.
Integrity signals
Registry
Cites
Statistics
Figures
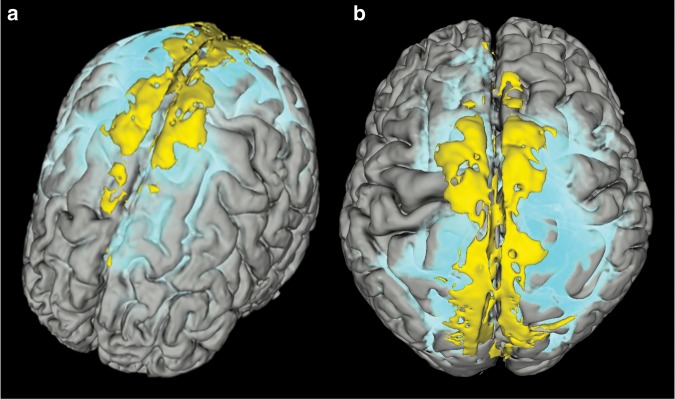
Verification
Claims the paper makes
17 Not checked yet · 12 Own interpretation · 12 Own result · 6 Own method
A result the paper reports from its own data — it cites no other source for it, so there is none to check. The quote shows it is in the paper.
In the paper
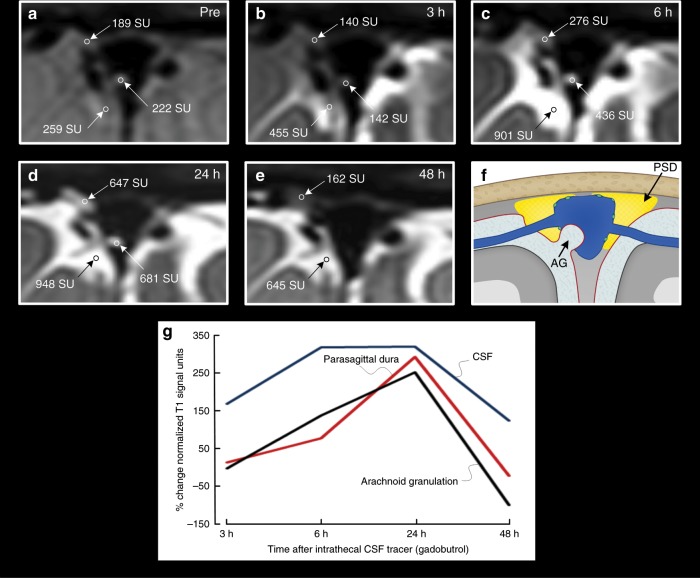
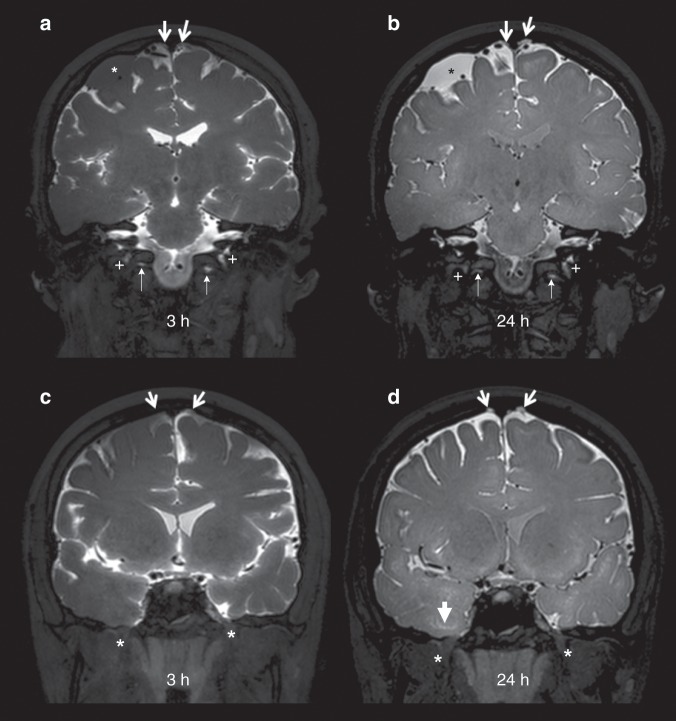
“As expected, CSF tracer also enhanced in macroscopically visible arachnoid granulations, bulging into the sagittal sinus in scattered locations”
§ Cerebrospinal fluid tracer efflux to parasagittal dura in humans > Results > Parasagittal dura
plainSingle case- Asserted: passes — The authors put it forward as true.
- Checkable: passes — It can be checked against evidence.
- Load-bearing: unclear — It is unclear whether the paper’s conclusions depend on it.
- Based: passes — The paper gives a reason why it holds.
A result the paper reports from its own data — it cites no other source for it, so there is none to check. The quote shows it is in the paper.
In the paper
“At late scans (i.e. 24 and 48 h, respectively), the remnants of tracer in CSF typically accumulated at the high cerebral convexities and in regions adjacent to parasagittal dura”
§ Cerebrospinal fluid tracer efflux to parasagittal dura in humans > Results > Parasagittal dura
plain- Asserted: passes — The authors put it forward as true.
- Checkable: passes — It can be checked against evidence.
- Load-bearing: unclear — It is unclear whether the paper’s conclusions depend on it.
- Based: passes — The paper gives a reason why it holds.
A result the paper reports from its own data — it cites no other source for it, so there is none to check. The quote shows it is in the paper.
In the paper
“The tracer enrichment in parasagittal dura was highly dependent on presence of tracer in adjacent CSF, which was shown by their strong positive correlation at all time points (3, 6, 24 and 48 h)”
§ Cerebrospinal fluid tracer efflux to parasagittal dura in humans > Results > Parasagittal dura
boostedcorrelational- Asserted: passes — The authors put it forward as true.
- Checkable: passes — It can be checked against evidence.
- Load-bearing: passes — The paper’s conclusions depend on it.
- Based: passes — The paper gives a reason why it holds.
A result the paper reports from its own data — it cites no other source for it, so there is none to check. The quote shows it is in the paper.
In the paper
“Tissue within the parasagittal dura having features as specified above (intermediate or high signal at T2-FLAIR (not free CSF) and at T1-BB (not blood)) was visually identified almost exclusively along the middle to posterior segment of the superior sagittal sinus (Fig. 1; Supplementary Movie 2), corresponding well with the levels where cortical veins enter the sinus.”
§ Cerebrospinal fluid tracer efflux to parasagittal dura in humans > Results > Parasagittal dura
plaincorrelational- Asserted: passes — The authors put it forward as true.
- Checkable: passes — It can be checked against evidence.
- Load-bearing: passes — The paper’s conclusions depend on it.
- Based: passes — The paper gives a reason why it holds.
None of the sources cited for this claim have been checked yet.
In the paper
“The region with tracer enhancement, as presented here, stretches laterally to a larger extent than what can be anticipated from the previous anatomical descriptions of intradural human arachnoid granulations14,15”
§ Cerebrospinal fluid tracer efflux to parasagittal dura in humans > Discussion
What the sources say
- Not checked yetcites [14] Han, H., Tao, W. & Zhang, M. The dural entrance of cerebral bridging veins into the superior sagittal sinus: an anatomical comparison between cadavers and digital subtraction angiography. Neuroradiology 49, 169–175 (2007). source
- Not checked yetcites [15] Fox, R. J., Walji, A. H., Mielke, B., Petruk, K. C. & Aronyk, K. E. Anatomic details of intradural channels in the parasagittal dura: a possible pathway for flow of cerebrospinal fluid. Neurosurgery 39, 84–90 (1996). source
plain- Asserted: passes — The authors put it forward as true.
- Checkable: passes — It can be checked against evidence.
- Load-bearing: passes — The paper’s conclusions depend on it.
- Based: passes — The paper gives a reason why it holds.
A result the paper reports from its own data — it cites no other source for it, so there is none to check. The quote shows it is in the paper.
In the paper
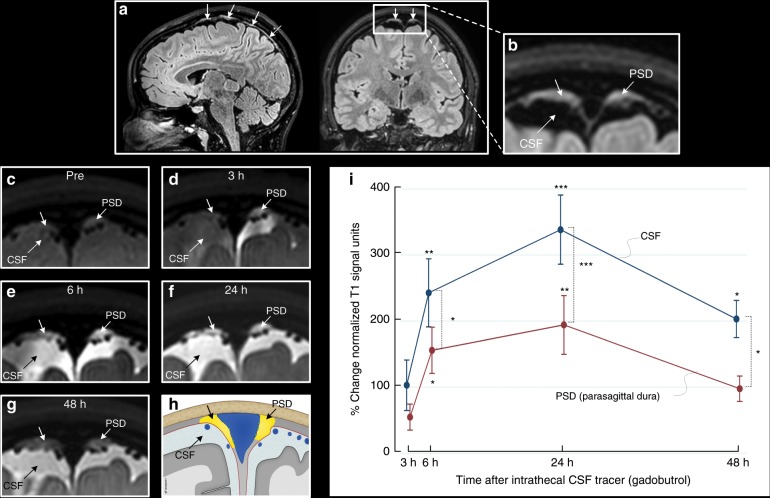
“As can be noted, the signal change differed somewhat within the CSF of the subarachnoid space, arachnoid granulations and parasagittal dura, suggesting some level of molecular motion restriction between these structures.”
§ Cerebrospinal fluid tracer efflux to parasagittal dura in humans > Results > Parasagittal dura
hedgedSingle case- Asserted: passes — The authors put it forward as true.
- Checkable: passes — It can be checked against evidence.
- Load-bearing: unclear — It is unclear whether the paper’s conclusions depend on it.
- Based: passes — The paper gives a reason why it holds.
A result the paper reports from its own data — it cites no other source for it, so there is none to check. The quote shows it is in the paper.
In the paper
“The tracer escaped from cerebrospinal fluid into parasagittal dura along the superior sagittal sinus at areas nearby entry of cortical cerebral veins.”
- Also stated in: § Discussion · boosted
“In conclusion, the present study demonstrates in vivo escape of a CSF tracer from the subarachnoid compartment over the arachnoid and into the parasagittal dura along the superior sagittal sinus in humans.”
§ Cerebrospinal fluid tracer efflux to parasagittal dura in humans > Abstract
boosteddirectn = 18- Asserted: passes — The authors put it forward as true.
- Checkable: passes — It can be checked against evidence.
- Load-bearing: passes — The paper’s conclusions depend on it.
- Based: passes — The paper gives a reason why it holds.
- Also stated in: § Discussion · boosted
In the paper
“In our human cohort, tracer was present in CSF at a far longer time span (even after 2 days), and the tail of the remaining tracer bolus at late scans along parasagittal dura (Fig. 1; Supplementary Movie 1) may also indicate a net drift of CSF molecules in this direction, rather than toward the skull base.”
§ Cerebrospinal fluid tracer efflux to parasagittal dura in humans > Discussion
What the sources say
- Not checked yetcites [19] Ma, Q. et al. Rapid lymphatic efflux limits cerebrospinal fluid flow to the brain. Acta Neuropathol. 137, 151–165 (2019). source
hedged- Asserted: passes — The authors put it forward as true.
- Checkable: passes — It can be checked against evidence.
- Load-bearing: passes — The paper’s conclusions depend on it.
- Based: passes — The paper gives a reason why it holds.
A result the paper reports from its own data — it cites no other source for it, so there is none to check. The quote shows it is in the paper.
In the paper
“Tubular structures with any resemblance to dural lymphatic vessels as previously reported could not be discriminated from other enhancing tissue within parasagittal dura, and may be related to the image resolution of our MRI scans being restricted to 1 × 1 × 1 mm voxel size.”
§ Cerebrospinal fluid tracer efflux to parasagittal dura in humans > Results > Parasagittal dura
hedged- Asserted: passes — The authors put it forward as true.
- Checkable: passes — It can be checked against evidence.
- Load-bearing: unclear — It is unclear whether the paper’s conclusions depend on it.
- Based: passes — The paper gives a reason why it holds.
A conclusion the paper draws from its own results — it cites no other source for it, so there is none to check. The quote shows it is in the paper.
In the paper
“The findings demonstrate that trans-arachnoid molecular passage does occur”
- Also stated in: § Discussion · plain
“escape of a CSF tracer from the subarachnoid compartment over the arachnoid and into the parasagittal dura along the superior sagittal sinus in humans”
§ Cerebrospinal fluid tracer efflux to parasagittal dura in humans > Abstract
boosteddirectn = 18- Asserted: passes — The authors put it forward as true.
- Checkable: passes — It can be checked against evidence.
- Load-bearing: passes — The paper’s conclusions depend on it.
- Based: passes — The paper gives a reason why it holds.
- Also stated in: § Discussion · plain
- It may state two separate claims as one. 17
- Probably not a substantial claim. 16
- The quote only partly states this claim. 1
A result the paper reports from its own data — it cites no other source for it, so there is none to check. The quote shows it is in the paper.
In the paper
“Even though there were some variations with regard to prominence, tissue in parasagittal dura with features as here defined was depicted in 18/18 study patients and had the typical appearance of longitudinally interspersed areas of up to several millimeters’ transversal width”
§ Cerebrospinal fluid tracer efflux to parasagittal dura in humans > Results > Parasagittal dura
plainn = 18- Asserted: passes — The authors put it forward as true.
- Checkable: passes — It can be checked against evidence.
- Load-bearing: unclear — It is unclear whether the paper’s conclusions depend on it.
- Based: passes — The paper gives a reason why it holds.
It may state two separate claims as one.
A result the paper reports from its own data — it cites no other source for it, so there is none to check. The quote shows it is in the paper.
In the paper
“Also note that signal change peaked at 24 h in both CSF and PSD, and signal increase in these structures was highly associated (R = 0.92, P < 0.001).”
§ Cerebrospinal fluid tracer efflux to parasagittal dura in humans > Results > Parasagittal dura
plaincorrelationaln = 18- Asserted: passes — The authors put it forward as true.
- Checkable: passes — It can be checked against evidence.
- Load-bearing: passes — The paper’s conclusions depend on it.
- Based: passes — The paper gives a reason why it holds.
It may state two separate claims as one.
A result the paper reports from its own data — it cites no other source for it, so there is none to check. The quote shows it is in the paper.
In the paper
“At group level, there was a highly significant increase in normalized T1 signal units within the parasagittal dura, though more pronounced in nearby CSF”
§ Cerebrospinal fluid tracer efflux to parasagittal dura in humans > Results > Parasagittal dura
plaindirect- Asserted: passes — The authors put it forward as true.
- Checkable: passes — It can be checked against evidence.
- Load-bearing: passes — The paper’s conclusions depend on it.
- Based: passes — The paper gives a reason why it holds.
It may state two separate claims as one.
A result the paper reports from its own data — it cites no other source for it, so there is none to check. The quote shows it is in the paper.
In the paper
“After intrathecal injection of CSF tracer, we found enrichment of parasagittal dura at 6, 24 and 48 h and with peak at 24 h”
§ Cerebrospinal fluid tracer efflux to parasagittal dura in humans > Results > Parasagittal dura
plaindirectn = 18- Asserted: passes — The authors put it forward as true.
- Checkable: passes — It can be checked against evidence.
- Load-bearing: passes — The paper’s conclusions depend on it.
- Based: passes — The paper gives a reason why it holds.
It may state two separate claims as one.
A result the paper reports from its own data — it cites no other source for it, so there is none to check. The quote shows it is in the paper.
In the paper
“For the visual assessment of tracer enhancement on T1-BB below selected cranial nerve outlets at the skull base, this was detected below the hypoglossal canal in 17/18, the jugular foramen in 17/18, the cribriform plate in 2/18, and the foramen ovale in 0/18 individuals”
§ Cerebrospinal fluid tracer efflux to parasagittal dura in humans > Results > Parasagittal dura
plainn = 18- Asserted: passes — The authors put it forward as true.
- Checkable: passes — It can be checked against evidence.
- Load-bearing: unclear — It is unclear whether the paper’s conclusions depend on it.
- Based: passes — The paper gives a reason why it holds.
It may state two separate claims as one.
None of the sources cited for this claim have been checked yet.
In the paper
“true lymphatic vessels were shown to reside within the dura mater3,4”
§ Cerebrospinal fluid tracer efflux to parasagittal dura in humans > Introduction
What the sources say
- Not checked yetcites [3] Aspelund, A. et al. A dural lymphatic vascular system that drains brain interstitial fluid and macromolecules. J. Exp. Med. 212, 991–999 (2015). source
- Not checked yetcites [4] Louveau, A. et al. Structural and functional features of central nervous system lymphatic vessels. Nature 523, 337–341 (2015). source
boosted- Asserted: passes — The authors put it forward as true.
- Checkable: passes — It can be checked against evidence.
- Load-bearing: passes — The paper’s conclusions depend on it.
- Based: passes — The paper gives a reason why it holds.
Probably not a substantial claim.
None of the sources cited for this claim have been checked yet.
In the paper
“it seems plausible that molecules within parasagittal dura structures may well reach adjacent lymphatic vessels, and perhaps also vice versa”
§ Cerebrospinal fluid tracer efflux to parasagittal dura in humans > Discussion
What the sources say
- Not checked yetcites [3] Aspelund, A. et al. A dural lymphatic vascular system that drains brain interstitial fluid and macromolecules. J. Exp. Med. 212, 991–999 (2015). source
- Not checked yetcites [4] Louveau, A. et al. Structural and functional features of central nervous system lymphatic vessels. Nature 523, 337–341 (2015). source
- Not checked yetcites [16] Mastorakos, P. & McGavern, D. The anatomy and immunology of vasculature in the central nervous system. Sci. Immunol. 4, eaav0492 (2019). source
hedgedconditional- Asserted: passes — The authors put it forward as true.
- Checkable: passes — It can be checked against evidence.
- Load-bearing: passes — The paper’s conclusions depend on it.
- Based: passes — The paper gives a reason why it holds.
It may state two separate claims as one.
In the paper
“previous findings showing that impairment of meningeal lymphatic function slows paravascular influx of macromolecules into the brain, as well as efflux from the interstitial space5, may suggest that impaired lymphatic clearance function may exert its negative effect directly on the accumulation of molecules within the CSF, and thereby further upstream on molecular exit from brain into CSF”
§ Cerebrospinal fluid tracer efflux to parasagittal dura in humans > Discussion
What the sources say
- Not checked yetcites [5] Da Mesquita, S. et al. Functional aspects of meningeal lymphatics in ageing and Alzheimer’s disease. Nature 560, 185–191 (2018). source
hedgedconditional- Asserted: passes — The authors put it forward as true.
- Checkable: passes — It can be checked against evidence.
- Load-bearing: fails — The paper’s conclusions may not depend on it.
- Based: passes — The paper gives a reason why it holds.
Probably not a substantial claim. The paper’s conclusions may not depend on it. It may state two separate claims as one.
A conclusion the paper draws from its own results — it cites no other source for it, so there is none to check. The quote shows it is in the paper.
In the paper
“which should be highly suggestive for tracer escape to dura outside arachnoid granulations and into the network of intradural channels”
§ Cerebrospinal fluid tracer efflux to parasagittal dura in humans > Discussion
hedgeddirect- Asserted: passes — The authors put it forward as true.
- Checkable: passes — It can be checked against evidence.
- Load-bearing: passes — The paper’s conclusions depend on it.
- Based: passes — The paper gives a reason why it holds.
It may state two separate claims as one.
A conclusion the paper draws from its own results — it cites no other source for it, so there is none to check. The quote shows it is in the paper.
In the paper
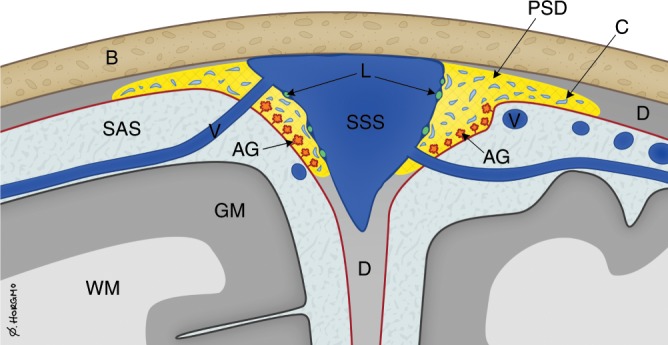
“Our findings compare better with previous anatomical reports demonstrating that parasagittal dura along the middle one-third of the superior sagittal sinus harbors a dense carpet of arachnoid granulations medially”
§ Cerebrospinal fluid tracer efflux to parasagittal dura in humans > Discussion
boostedcorrelational- Asserted: passes — The authors put it forward as true.
- Checkable: passes — It can be checked against evidence.
- Load-bearing: passes — The paper’s conclusions depend on it.
- Based: passes — The paper gives a reason why it holds.
It may state two separate claims as one. The quote only partly states this claim.
In the paper
“impairment of these meningeal lymphatic pathways has been shown to slow paravascular efflux of amyloid-β from interstitial brain fluid”
§ Cerebrospinal fluid tracer efflux to parasagittal dura in humans > Introduction
What the sources say
- Not checked yetcites [5] Da Mesquita, S. et al. Functional aspects of meningeal lymphatics in ageing and Alzheimer’s disease. Nature 560, 185–191 (2018). source
plaindirect- Asserted: passes — The authors put it forward as true.
- Checkable: passes — It can be checked against evidence.
- Load-bearing: passes — The paper’s conclusions depend on it.
- Based: passes — The paper gives a reason why it holds.
Probably not a substantial claim.
What the paper did — it cites no source for this, so there is none to check. The quote shows it is in the paper.
In the paper
“Moreover, the long duration of molecular clearance from human CSF, and the high demand on patients and resources associated with multi-phase MR imaging over 48 h, has limited the number of scans we were able to perform in single patients through this time span.”
§ Cerebrospinal fluid tracer efflux to parasagittal dura in humans > Discussion
plaindirect- Asserted: passes — The authors put it forward as true.
- Checkable: passes — It can be checked against evidence.
- Load-bearing: fails — The paper’s conclusions may not depend on it.
- Based: passes — The paper gives a reason why it holds.
Probably not a substantial claim. The paper’s conclusions may not depend on it. It may state two separate claims as one.
What the paper did — it cites no source for this, so there is none to check. The quote shows it is in the paper.
In the paper
“In the lack of T1-mapping techniques with image resolution even close to 1 mm, we did not have the opportunity to go beyond semi-quantitative measures of tracer enrichment.”
§ Cerebrospinal fluid tracer efflux to parasagittal dura in humans > Discussion
plaindirect- Asserted: passes — The authors put it forward as true.
- Checkable: passes — It can be checked against evidence.
- Load-bearing: fails — The paper’s conclusions may not depend on it.
- Based: passes — The paper gives a reason why it holds.
Probably not a substantial claim. The paper’s conclusions may not depend on it.
In the paper
“A recent animal study was, however, unable to reproduce passage of CSF tracer into dural lymphatic vessels7”
§ Cerebrospinal fluid tracer efflux to parasagittal dura in humans > Introduction
What the sources say
- Not checked yetcites [7] Ma, Q., Ineichen, B. V., Detmar, M. & Proulx, S. T. Outflow of cerebrospinal fluid is predominantly through lymphatic vessels and is reduced in aged mice. Nat. Commun. 8, 1434 (2017). source
plain- Asserted: passes — The authors put it forward as true.
- Checkable: passes — It can be checked against evidence.
- Load-bearing: fails — The paper’s conclusions may not depend on it.
- Based: passes — The paper gives a reason why it holds.
Probably not a substantial claim. The paper’s conclusions may not depend on it.
In the paper
“The human subarachnoid space is shown to be continuous with the paravascular compartment of all brain regions1”
§ Cerebrospinal fluid tracer efflux to parasagittal dura in humans > Introduction
What the sources say
- Not checked yetcites [1] Ringstad, G. et al. Brain-wide glymphatic enhancement and clearance in humans assessed with MRI. JCI Insight 3, 121537 (2018). source
boostedcorrelational- Asserted: passes — The authors put it forward as true.
- Checkable: passes — It can be checked against evidence.
- Load-bearing: passes — The paper’s conclusions depend on it.
- Based: passes — The paper gives a reason why it holds.
Probably not a substantial claim.
In the paper
“It has, however, been demonstrated in rats that from the total amount of MRI contrast agent injected into the cisterna magna, merely 19% enriched the brain parenchyma, the remainder escaped via other routes22.”
§ Cerebrospinal fluid tracer efflux to parasagittal dura in humans > Discussion
What the sources say
- Not checked yetcites [22] Lee, H. et al. Quantitative Gd-DOTA uptake from cerebrospinal fluid into rat brain using 3D VFA-SPGR at 9.4T. Magn. Reson. Med. 79, 1568–1578 (2018). source
boosted- Asserted: passes — The authors put it forward as true.
- Checkable: passes — It can be checked against evidence.
- Load-bearing: passes — The paper’s conclusions depend on it.
- Based: passes — The paper gives a reason why it holds.
Probably not a substantial claim.
None of the sources cited for this claim have been checked yet.
In the paper
“previous observations indicating that the arachnoid constitutes an impermeable barrier layer between the CSF and dura mater8,9”
§ Cerebrospinal fluid tracer efflux to parasagittal dura in humans > Introduction
What the sources say
- Not checked yetcites [8] Nabeshima, S., Reese, T. S., Landis, D. M. & Brightman, M. W. Junctions in the meninges and marginal glia. J. Comp. Neurol. 164, 127–169 (1975). source
- Not checked yetcites [9] Coles, J. A., Myburgh, E., Brewer, J. M. & McMenamin, P. G. Where are we? The anatomy of the murine cortical meninges revisited for intravital imaging, immunology, and clearance of waste from the brain. Prog. Neurobiol. 156, 107–148 (2017). source
hedged- Asserted: passes — The authors put it forward as true.
- Checkable: passes — It can be checked against evidence.
- Load-bearing: passes — The paper’s conclusions depend on it.
- Based: passes — The paper gives a reason why it holds.
Probably not a substantial claim.
None of the sources cited for this claim have been checked yet.
In the paper
“Our findings compare better with previous anatomical reports demonstrating that parasagittal dura along the middle one-third of the superior sagittal sinus harbors a dense carpet of arachnoid granulations medially, being in close association with an extensive network of intradural channels from 0.02 to 2.0 mm in diameter, coursing and coalescing into lateral lacunae from laterally toward the super”
§ Cerebrospinal fluid tracer efflux to parasagittal dura in humans > Discussion
What the sources say
- Not checked yetcites [13] Mack, J., Squier, W. & Eastman, J. T. Anatomy and development of the meninges: implications for subdural collections and CSF circulation. Pediatr. Radiol. 39, 200–210 (2009). source
- Not checked yetcites [14] Han, H., Tao, W. & Zhang, M. The dural entrance of cerebral bridging veins into the superior sagittal sinus: an anatomical comparison between cadavers and digital subtraction angiography. Neuroradiology 49, 169–175 (2007). source
boostedcorrelational- Asserted: passes — The authors put it forward as true.
- Checkable: passes — It can be checked against evidence.
- Load-bearing: passes — The paper’s conclusions depend on it.
- Based: passes — The paper gives a reason why it holds.
Probably not a substantial claim. It may state two separate claims as one.
A conclusion the paper draws from its own results — it cites no other source for it, so there is none to check. The quote shows it is in the paper.
In the paper
“The in vivo-based observations from the current MRI study show that parasagittal dura does not drain CSF only, but also molecules, with high level of dependence on their presence in the adjacent subarachnoid compartment.”
§ Cerebrospinal fluid tracer efflux to parasagittal dura in humans > Discussion
boostedcorrelational- Asserted: passes — The authors put it forward as true.
- Checkable: passes — It can be checked against evidence.
- Load-bearing: passes — The paper’s conclusions depend on it.
- Based: passes — The paper gives a reason why it holds.
It may state two separate claims as one.
What the paper did — it cites no source for this, so there is none to check. The quote shows it is in the paper.
In the paper
“An obvious limitation of this study is the MR image resolution of 1 mm voxel size.”
§ Cerebrospinal fluid tracer efflux to parasagittal dura in humans > Discussion
plain- Asserted: passes — The authors put it forward as true.
- Checkable: passes — It can be checked against evidence.
- Load-bearing: fails — The paper’s conclusions may not depend on it.
- Based: passes — The paper gives a reason why it holds.
Probably not a substantial claim. The paper’s conclusions may not depend on it.
A conclusion the paper draws from its own results — it cites no other source for it, so there is none to check. The quote shows it is in the paper.
In the paper
“While our study corroborates findings from animal studies by showing that CSF molecular outflow through skull base foramina occurs also in humans”
§ Cerebrospinal fluid tracer efflux to parasagittal dura in humans > Discussion
plainn = 18- Asserted: passes — The authors put it forward as true.
- Checkable: passes — It can be checked against evidence.
- Load-bearing: passes — The paper’s conclusions depend on it.
- Based: passes — The paper gives a reason why it holds.
It may state two separate claims as one.
None of the sources cited for this claim have been checked yet.
In the paper
“The extent of enhancing tissue within parasagittal dura does not resemble the previously reported appearance of true dural lymphatic vessels, which are tubular-shaped structures of sub-millimeter cross-sectional diameter near the venous sinus wall3,4,11, and also far from the classical MRI appearance of arachnoid granulations bulging into venous sinuses12.”
§ Cerebrospinal fluid tracer efflux to parasagittal dura in humans > Discussion
What the sources say
- Not checked yetcites [3] Aspelund, A. et al. A dural lymphatic vascular system that drains brain interstitial fluid and macromolecules. J. Exp. Med. 212, 991–999 (2015). source
- Not checked yetcites [4] Louveau, A. et al. Structural and functional features of central nervous system lymphatic vessels. Nature 523, 337–341 (2015). source
- Not checked yetcites [11] Absinta, M. et al. Human and nonhuman primate meninges harbor lymphatic vessels that can be visualized noninvasively by MRI. eLife 6, e29738 (2017). source
- Not checked yetcites [12] Trimble, C. R., Harnsberger, H. R., Castillo, M., Brant-Zawadzki, M. & Osborn, A. G. “Giant” arachnoid granulations just like CSF?: NOT!! AJNR Am. J. Neuroradiol. 31, 1724–1728 (2010). source
plain- Asserted: passes — The authors put it forward as true.
- Checkable: passes — It can be checked against evidence.
- Load-bearing: passes — The paper’s conclusions depend on it.
- Based: passes — The paper gives a reason why it holds.
It may state two separate claims as one.
A conclusion the paper draws from its own results — it cites no other source for it, so there is none to check. The quote shows it is in the paper.
In the paper
“may be related to the image resolution of our MRI scans being restricted to 1 × 1 × 1 mm voxel size”
§ Cerebrospinal fluid tracer efflux to parasagittal dura in humans > Results > Parasagittal dura
hedgedconditional- Asserted: passes — The authors put it forward as true.
- Checkable: passes — It can be checked against evidence.
- Load-bearing: fails — The paper’s conclusions may not depend on it.
- Based: passes — The paper gives a reason why it holds.
Probably not a substantial claim. The paper’s conclusions may not depend on it.
What the paper did — it cites no source for this, so there is none to check. The quote shows it is in the paper.
In the paper
“Therefore, the time point for peak tracer enhancement in human parasagittal dura must be considered to represent a rough estimate.”
§ Cerebrospinal fluid tracer efflux to parasagittal dura in humans > Discussion
hedged- Asserted: passes — The authors put it forward as true.
- Checkable: passes — It can be checked against evidence.
- Load-bearing: fails — The paper’s conclusions may not depend on it.
- Based: passes — The paper gives a reason why it holds.
Probably not a substantial claim. The paper’s conclusions may not depend on it.
What the paper did — it cites no source for this, so there is none to check. The quote shows it is in the paper.
In the paper
“Ideally, we could also have used an extra-cranial device as reference for normalization of signal units, as the ocular bulbs may be affected by some motion artifacts during scans of several minutes.”
§ Cerebrospinal fluid tracer efflux to parasagittal dura in humans > Discussion
hedgedconditional- Asserted: passes — The authors put it forward as true.
- Checkable: passes — It can be checked against evidence.
- Load-bearing: fails — The paper’s conclusions may not depend on it.
- Based: passes — The paper gives a reason why it holds.
Probably not a substantial claim. The paper’s conclusions may not depend on it. It may state two separate claims as one.
In the paper
“Gadobutrol is a non-ionic, highly hydrophilic molecule of relatively small size (604 Da), prevented by the intact brain–blood–barrier from leakage into CNS blood vessels when administered intrathecally10.”
§ Cerebrospinal fluid tracer efflux to parasagittal dura in humans > Introduction
What the sources say
- Not checked yetcites [10] Cheng, K. T. Gadobutrol. in Molecular Imaging and Contrast Agent Database (MICAD) (National Center for Biotechnology Information, Bethesda, USA, 2004). https://www.ncbi.nlm.nih.gov/pubmed/20641787.
plaindirect- Asserted: passes — The authors put it forward as true.
- Checkable: passes — It can be checked against evidence.
- Load-bearing: passes — The paper’s conclusions depend on it.
- Based: passes — The paper gives a reason why it holds.
It may state two separate claims as one.
In the paper
“The endothelium of intradural channels was proposed to possibly be the final barrier for the absorption of CSF to venous blood15, but passage of CSF over this cell layer has never since been confirmed in vivo.”
§ Cerebrospinal fluid tracer efflux to parasagittal dura in humans > Discussion
What the sources say
- Not checked yetcites [15] Fox, R. J., Walji, A. H., Mielke, B., Petruk, K. C. & Aronyk, K. E. Anatomic details of intradural channels in the parasagittal dura: a possible pathway for flow of cerebrospinal fluid. Neurosurgery 39, 84–90 (1996). source
hedged- Asserted: passes — The authors put it forward as true.
- Checkable: passes — It can be checked against evidence.
- Load-bearing: fails — The paper’s conclusions may not depend on it.
- Based: passes — The paper gives a reason why it holds.
Probably not a substantial claim. The paper’s conclusions may not depend on it. It may state two separate claims as one.
In the paper
“It has previously been shown that neurotoxic molecules such as amyloid-β and tau are cleared from brain tissue along paravenous pathways (the glymphatic system)20”
§ Cerebrospinal fluid tracer efflux to parasagittal dura in humans > Discussion
What the sources say
- Not checked yetcites [20] Iliff, J. J. et al. A paravascular pathway facilitates CSF flow through the brain parenchyma and the clearance of interstitial solutes, including amyloid beta. Sci. Transl. Med. 4, 147ra111 (2012). source
boosteddirect- Asserted: passes — The authors put it forward as true.
- Checkable: passes — It can be checked against evidence.
- Load-bearing: passes — The paper’s conclusions depend on it.
- Based: passes — The paper gives a reason why it holds.
Probably not a substantial claim.
The paper relies on this without support.
The olfactory system is proportionally much lesser in size in humans than in rodents.
“The olfactory system is indeed of proportionally much lesser size in humans than in rodents”
The paper relies on this without support.
The observed CSF tracer efflux in patients with suspected CSF disorders reflects normal human CSF clearance physiology.
“The study included 18 patients who were under clinical work-up for possible CSF disorders of various etiologies”
“In 18 subjects with suspicion of various types of cerebrospinal fluid disorders”
The paper relies on this without support.
T1 signal change in parasagittal dura reflects gadobutrol tracer concentration or enrichment.
“The CSF tracer enrichment was measured as change in T1-BB signal units, and was normalized against the reference (i.e. the vitreous body of the ocular bulb) to correct for any baseline shift of image grayscale between time points”
Claims other papers make about this one
Each is checked against this paper’s own text: does it say what the citing paper says it does?
In the citing paper
“Gene ontology and KEGG pathway analysis performed with upregulated genes in the absence of neuronal IL-17a signaling revealed several enriched processes involved in γ-aminobutyric acid (GABA)-benzodiazepine activity (Fig. 6f, Extended Data Fig. 6i), the prototypical target system for anxiolytic drugs15.”
From Meningeal γδ T cells regulate anxiety-like behavior via IL-17a signaling in neurons (2020) · cites this paper as [15]
Citations
Cites
Iliff, J. J., Wang, M., Liao, Y., Plogg, B. A., Peng, W., Gundersen, G. A., Benveniste, H., Vates, G. E., Deane, R., Goldman, S. A., et al. (2012) · Science Translational Medicine · doi:10.1126/scitranslmed.3003748 · Cited by 5,824
Structural and functional features of central nervous system lymphatic vessels
Louveau, A., Smirnov, I., Keyes, T. J., Eccles, J. D., Rouhani, S. J., Peske, J. D., Derecki, N. C., Castle, D., Mandell, J. W., Lee, K. S., et al. (2015) · Nature · doi:10.1038/nature14432 · Cited by 4,413
A dural lymphatic vascular system that drains brain interstitial fluid and macromolecules
Aspelund, A., Antila, S., Proulx, S. T., Karlsen, T. V., Karaman, S., Detmar, M., Wiig, H., & Alitalo, K. (2015) · Journal of Experimental Medicine · doi:10.1084/jem.20142290 · Cited by 2,198
Functional aspects of meningeal lymphatics in ageing and Alzheimer’s disease
Da Mesquita, S., Louveau, A., Vaccari, A., Smirnov, I., Cornelison, R. C., Kingsmore, K. M., Contarino, C., Onengut-Gumuscu, S., Farber, E., Raper, D., et al. (2018) · Nature · doi:10.1038/s41586-018-0368-8 · Cited by 1,445
Meningeal lymphatic vessels at the skull base drain cerebrospinal fluid
Ahn, J. H., Cho, H., Kim, J.-H., Kim, S. H., Ham, J.-S., Park, I., Suh, S. H., Hong, S. P., Song, J.-H., Hong, Y.-K., et al. (2019) · Nature · doi:10.1038/s41586-019-1419-5 · Cited by 811
Mandell, D. M., Mossa‐Basha, M., Qiao, Y., Hess, C. P., Hui, F. K., Matouk, C. C., Johnson, M. H., Daemen, M. J. A. P., Vossough, A., Edjlali, M., et al. (2016) · American Journal of Neuroradiology · doi:10.3174/ajnr.a4893 · Cited by 694
Ma, Q., Ineichen, B. V., Detmar, M., & Proulx, S. T. (2017) · Nature Communications · doi:10.1038/s41467-017-01484-6 · Cited by 690
Absinta, M., Ha, S.-K., Nair, G., Sati, P., Luciano, N. J., Palisoc, M., Louveau, A., Zaghloul, K. A., Pittaluga, S., Kipnis, J., et al. (2017) · eLife · doi:10.7554/elife.29738 · Cited by 643
Johnston, M., Zakharov, A., Papaiconomou, C., Salmasi, G., & Armstrong, D. (2004) · Cerebrospinal Fluid Research · doi:10.1186/1743-8454-1-2 · Cited by 572
Brain-wide glymphatic enhancement and clearance in humans assessed with MRI.
Ringstad, G., Valnes, L. M., Dale, A. M., Pripp, A. H., Vatnehol, S.-A. S., Emblem, K. E., Mardal, K.-A., & Eide, P. K. (2018) · JCI Insight · doi:10.1172/jci.insight.121537 · Cited by 533
Self-citation
Research works printed but not linked: 1
- Cheng, K. T. Gadobutrol. in Molecular Imaging and Contrast Agent Database (MICAD) (National Center for Biotechnology Information, Bethesda, USA, 2004). https://www.ncbi.nlm.nih.gov/pubmed/20641787.
Cited by
Sorted by citations
Items 101–200 of 293
Glymphatic pathway in sporadic cerebral small vessel diseases: From bench to bedside
Xu, J., Su, Y., Fu, J., Shen, Y., Dong, Q., & Cheng, X. (2023) · Ageing Research Reviews · doi:10.1016/j.arr.2023.101885 · Cited by 24
Naganawa, S., Ito, R., Nakamichi, R., Kawamura, M., Kawai, H., Taoka, T., Yoshida, T., & Sone, M. (2020) · Magnetic Resonance in Medical Sciences · doi:10.2463/mrms.mp.2020-0062 · Cited by 23
Plog, B. A., Kim, K., Verhaege, D., Kim, M. W., Papadopoulos, Z., Dikranian, K. T., Dykstra, T., Cao, J., Perrin, R. J., Schwetye, K. E., et al. (2025) · Nature Neuroscience · doi:10.1038/s41593-025-01977-4 · Cited by 22
He, Z., & Sun, J. (2025) · Cognitive Neurodynamics · doi:10.1007/s11571-025-10298-y · Cited by 24
Zedde, M., & Pascarella, R. (2024) · Brain Sciences · doi:10.3390/brainsci14100983 · Cited by 21
The meningeal lymphatic vasculature in neuroinflammation
Olate‐Briones, A., Escalona, E., Salazar, C., Herrada, M. J., Liu, C., Herrada, A. A., & Escobedo, N. (2022) · The FASEB Journal · doi:10.1096/fj.202101574rr · Cited by 22
Malis, V., Bae, W. C., Yamamoto, A., McEvoy, L. K., McDonald, M. A., & Miyazaki, M. (2022) · Magnetic Resonance in Medical Sciences · doi:10.2463/mrms.mp.2022-0117 · Cited by 21
Immune control of brain physiology
Kovacs, M., Dominguez-Belloso, A., Ali-Moussa, S., & Deczkowska, A. (2025) · Nature reviews. Immunology · doi:10.1038/s41577-025-01129-6 · Cited by 22
Joo, B., Park, M., Ahn, S. J., & Suh, S. H. (2023) · Korean Journal of Radiology · doi:10.3348/kjr.2022.0980 · Cited by 20
Parasagittal dural space hypertrophy and amyloid-β deposition in Alzheimer’s disease
Song, A. K., Hett, K., Eisma, J. J., McKnight, C. D., Elenberger, J., Stark, A. J., Kang, H., Yan, Y., Considine, C. M., Donahue, M. J., et al. (2023) · Brain Communications · doi:10.1093/braincomms/fcad128 · Cited by 22
Tuunanen, J., Helakari, H., Huotari, N., Väyrynen, T., Järvelä, M., Kananen, J., Kivipää, A., Raitamaa, L., Ebrahimi, S.-M., Kallio, M., et al. (2024) · Frontiers in Neuroscience · doi:10.3389/fnins.2024.1457732 · Cited by 19
Cerebrospinal fluid draining lymphatics in health and disease: advances and controversies
McDonald, D. M., Alitalo, K. K., Betsholtz, C., Engelhardt, B., Proulx, S. T., Siegenthaler, J. A., & Koh, G. Y. (2025) · Nature Cardiovascular Research · doi:10.1038/s44161-025-00705-2 · Cited by 21
Molecular Mechanisms and Risk Factors for the Pathogenesis of Hydrocephalus
Li, J., Zhang, X., GUO, J. X., Chen, Y., & Yang, J. (2022) · Frontiers in Genetics · doi:10.3389/fgene.2021.777926 · Cited by 21
Imaging of the meningeal lymphatic network in healthy adults: A 7T MRI study
Patel, L. D., Raghavan, P., Tang, S., Choi, S., & Harrison, D. M. (2023) · Journal of Neuroradiology · doi:10.1016/j.neurad.2023.03.002 · Cited by 20
Neuroinflammation-Driven Lymphangiogenesis in CNS Diseases
Hsu, M., Laaker, C. J., Sándor, M., & Fábry, Z. (2021) · Frontiers in Cellular Neuroscience · doi:10.3389/fncel.2021.683676 · Cited by 20
Kim, J., Yoo, R., Choi, S. H., & Park, S. (2023) · Fluids and Barriers of the CNS · doi:10.1186/s12987-023-00446-z · Cited by 18
Chen, J., Pan, Y., Liu, Q., Li, G., Chen, G., Li, W., Zhao, W., & Wang, Q. (2022) · Current Neuropharmacology · doi:10.2174/1570159x21666221115150253 · Cited by 19
Kitamura, E., & Imai, N. (2024) · International Journal of Molecular Sciences · doi:10.3390/ijms252011163 · Cited by 22
Niche-specific therapeutic targeting of myeloid cells in the central nervous system
Frosch, M., & Prinz, M. (2025) · Immunity · doi:10.1016/j.immuni.2025.03.016 · Cited by 17
Mapping the Brain’s Glymphatic System
Voumvourakis, K. I., Thomaidis, N. S., & Tsiodras, S. (2026) · Biomedicines · doi:10.3390/biomedicines14020409 · Cited by 17
Glymphatic MRI techniques in sleep and neurodegenerative diseases
Lee, H., Choi, S. H., & Anzai, Y. (2022) · Current Opinion in Pulmonary Medicine · doi:10.1097/mcp.0000000000000923 · Cited by 17
Imaging of brain barrier inflammation and brain fluid drainage in human neurological diseases
Okar, S. V., Fagiani, F., Absinta, M., & Reich, D. S. (2024) · Cellular and Molecular Life Sciences · doi:10.1007/s00018-023-05073-3 · Cited by 20
Jukkola, J., Kaakinen, M., Singh, A., Moradi, S., Ferdinando, H., Myllylä, T., Kiviniemi, V. J., & Eklund, L. (2024) · Fluids and Barriers of the CNS · doi:10.1186/s12987-024-00509-9 · Cited by 21
Miyazaki, M., Malis, V., Yamamoto, A., Kungsamutr, J., McEvoy, L. K., McDonald, M. A., & Bae, W. C. (2023) · Magnetic Resonance in Medical Sciences · doi:10.2463/mrms.mp.2023-0005 · Cited by 18
Corrêa‐da‐Silva, F., Kalsbeek, M. J. T., Gadella, F. S., Oppersma, J., Jiang, W., Wolff, S. E. C., Korpel, N. L., Swaab, D. F., Fliers, E., Kalsbeek, A., et al. (2023) · Acta Neuropathologica Communications · doi:10.1186/s40478-023-01606-w · Cited by 16
Noninvasive investigations of human glymphatic dynamics in a diseased model
Wu, C., Kuo, Y., Chang, F., Lirng, J., Ling, Y., Wang, Y.-F., Wu, H., Fuh, J., Lin, C., Wang, S., et al. (2023) · European Radiology · doi:10.1007/s00330-023-09894-5 · Cited by 16
Wang, M., Ran, L., Liu, B., Wei, W., Zhu, J., Fan, L., Song, X., Zhang, J., Zhao, Y., Hu, G., et al. (2023) · Med · doi:10.1016/j.medj.2023.10.001 · Cited by 16
Hsu, M., Sándor, M., & Fábry, Z. (2021) · Biologia Futura · doi:10.1007/s42977-021-00066-4 · Cited by 16
Immune conversations at the border: meningeal immunity in health and disease
Patel, P. U., Regmi, A., Dass, A. I., & Rojas, O. L. (2025) · Frontiers in Immunology · doi:10.3389/fimmu.2025.1531068 · Cited by 20
Emerging Nano‐Immunotherapeutic Approaches to Glioma
Jin, N., Yang, W., Xie, Y., Yu, M., Chen, Y., & Zhang, J. (2023) · Small Structures · doi:10.1002/sstr.202300016 · Cited by 15
Ma, Y., Moazamian, D., Port, J. D., Edjlali, M., Pruvo, J., Hacein‐Bey, L., Hoggard, N., Paley, M. N. J., Menon, D. K., Bonekamp, D., et al. (2023) · Quantitative Imaging in Medicine and Surgery · doi:10.21037/qims-23-232 · Cited by 15
Rustenhoven, J. (2021) · Science · doi:10.1126/science.abl7122 · Cited by 15
Naganawa, S., Ito, R., Kawamura, M., Taoka, T., Yoshida, T., & Sone, M. (2023) · Magnetic Resonance in Medical Sciences · doi:10.2463/mrms.mp.2022-0110 · Cited by 15
Immune compartments at the brain’s borders in health and neurovascular diseases
Goertz, J. E., García‐Bonilla, L., Iadecola, C., & Anrather, J. (2023) · Seminars in Immunopathology · doi:10.1007/s00281-023-00992-6 · Cited by 15
Naganawa, S., Ito, R., Nakamichi, R., Kawamura, M., Taoka, T., Yoshida, T., & Sone, M. (2021) · Magnetic Resonance in Medical Sciences · doi:10.2463/mrms.mp.2020-0138 · Cited by 15
Huotari, N., Tuunanen, J., Raitamaa, L., Raatikainen, V., Kananen, J., Helakari, H., Tuovinen, T., Järvelä, M., Kiviniemi, V. J., & Korhonen, V. O. (2022) · Frontiers in Neuroscience · doi:10.3389/fnins.2022.836378 · Cited by 14
Contribution of Direct Cerebral Vascular Transport in Brain Substance Clearance
Wen, Q., Wang, H., Haacke, E. M., Jiang, Q., & Hu, J. (2023) · Aging and Disease · doi:10.14336/ad.2023.0426 · Cited by 14
Role of meningeal lymphatic vessels in brain homeostasis
Zhao, M.-Y., Ye, C., Liu, Y.-C., Wang, X., Fu, J.-C., Liu, X.-Y., Zhu, R., Li, Y.-Z., & Qing, T. (2025) · Frontiers in Immunology · doi:10.3389/fimmu.2025.1593630 · Cited by 16
Lahmar, T., Thuau, F., Pinard, G., Boutoleau‐Bretonnière, C., Perrot, P., & Lancien, U. (2025) · The Journal of Prevention of Alzheimer s Disease · doi:10.1016/j.tjpad.2025.100335 · Cited by 17
Highly dynamic dural sinuses support meningeal immunity
Monaghan, K. L., Zanluqui, N. G., Su, Y. P., Riggle, B. A., Peterkin, N. L., Johnson, K. R., Rosenblum, J. S., Petersen, J. D., Liu, J., Wang, X., et al. (2026) · Nature · doi:10.1038/s41586-026-10165-8 · Cited by 15
Gabr, R. E., Lincoln, J. A., Hasan, K. M., & Kramer, L. A. (2023) · Brain and Behavior · doi:10.1002/brb3.3042 · Cited by 13
Lymphatic vessels accompanying dorsal and basal dural sinuses in the human brain
Çavdar, S., Köse, B., Altınöz, D., Söyler, G., Cingöz, A., Gürses, İ. A., Özkan, M., Aslıyüksek, H., & Çakır, H. (2023) · Journal of Chemical Neuroanatomy · doi:10.1016/j.jchemneu.2023.102357 · Cited by 14
CSF outflow from the human spinal canal: preliminary results from an anatomical specimen-based model
Rzepliński, R., Proulx, S. T., Tarka, S., Stępień, T., & Ciszek, B. (2025) · Fluids and Barriers of the CNS · doi:10.1186/s12987-025-00645-w · Cited by 13
Safety of Intrathecal Gadolinium-based Contrast Agents and Benefit versus Risk
Ringstad, G. A., & Eide, P. K. (2021) · Radiology · doi:10.1148/radiol.2021203351 · Cited by 13
Self-citationRomualdo, S. M. F., Juratli, T. A., Eyüpoglu, I. Y., Schackert, G., Dengl, M., Prem, M., Hijazi, M. M., & Sitoci-Ficici, K.-H. (2025) · Neurosurgical Review · doi:10.1007/s10143-025-03673-0 · Cited by 12
Kiviniemi, V. J., Helakari, H., Raitamaa, L., Huotari, N., Rajna, Z., Järvelä, M., Elabasy, A., Tuunanen, J., Poltojainen, V., Väyrynen, T., et al. (2025) · NMR in Biomedicine · doi:10.1002/nbm.70092 · Cited by 11
Cerebrospinal Fluid–Mediated Brain Clearance: Insights from Human Studies
Eide, P. K., Quesada, C. L. V., & Ringstad, G. A. (2026) · Annual Review of Physiology · doi:10.1146/annurev-physiol-043024-120520 · Cited by 16
Self-citationFu, S.-P., Yu, M., Xu, H., Liu, Q., Li, X., Wang, Y., Chen, Y., Meng, L., Qiu, Y., Jing, X., et al. (2021) · Frontiers in Genetics · doi:10.3389/fgene.2021.719201 · Cited by 12
Update on the Cognitive Presentations of iNPH for Clinicians
Langheinrich, T., Chen, C., & Thomas, O. M. T. (2022) · Frontiers in Neurology · doi:10.3389/fneur.2022.894617 · Cited by 11
Wang, X., Deng, H., Gao, S.-Q., Li, T., Gao, C.-C., Han, Y., Zhuang, Y.-S., Qiu, J.-Y., Miao, S.-H., & Zhou, M. (2023) · Frontiers in Pharmacology · doi:10.3389/fphar.2022.1061457 · Cited by 13
The cerebral lymphatic drainage system and its implications in epilepsy
Peng, T., Xie, Y., Liu, F., Lian, Y., Xie, Y., Ma, Y., Wang, C., & Xie, N. (2023) · Journal of Neuroscience Research · doi:10.1002/jnr.25267 · Cited by 12
In vivo distribution of cerebrospinal fluid tracer in human upper spinal cord and brain stem
Melin, E., Pripp, A. H., Eide, P. K., & Ringstad, G. A. (2023) · JCI Insight · doi:10.1172/jci.insight.173276 · Cited by 13
Self-citationMeningeal brain borders and migraine headache genesis
Christensen, S. L., & Levy, D. (2024) · Trends in Neurosciences · doi:10.1016/j.tins.2024.08.012 · Cited by 13
Keep, R. F., Jones, H. C., & Drewes, L. R. (2021) · Fluids and Barriers of the CNS · doi:10.1186/s12987-021-00258-z · Cited by 12
Cerebral biomimetic nano-drug delivery systems: A frontier strategy for immunotherapy
Tian, H., Yao, J., Ba, Q., Meng, Y., Cui, Y., Quan, L., Gong, W., Wang, Y., Yang, Y., Yang, M., et al. (2024) · Journal of Controlled Release · doi:10.1016/j.jconrel.2024.10.058 · Cited by 12
Therkelsen, H. E., Enger, R., Eide, P. K., & Ringstad, G. A. (2025) · Journal of Cerebral Blood Flow & Metabolism · doi:10.1177/0271678x251316392 · Cited by 11
Self-citationEvaluation of fluid channels in the human dura and superior sagittal sinus in older patients
Johnson, M. D. (2021) · Neuroscience Letters · doi:10.1016/j.neulet.2021.135649 · Cited by 11
Meningeal lymphatics as a therapeutic target for neurodegenerative disorders
Feng, Y., Wang, S., Xia, H., Jiang, X., Wu, M., Pan, S., & Song, W. (2025) · Translational Neurodegeneration · doi:10.1186/s40035-025-00528-y · Cited by 11
Zhang, J., Lei, Y., Wang, X., Yu, Q., Zhu, B., Zhang, H., Liu, Y., Li, H., Zhang, A., Wang, K., et al. (2023) · Translational Stroke Research · doi:10.1007/s12975-023-01227-4 · Cited by 10
Altered brain fluid dynamics in spontaneous intracranial hypotension
Eide, P. K., Hovd, M. H., Pripp, A. H., Gjertsen, Ø., Løvland, G., Lashkarivand, A., Lindstrøm, E. K., Valnes, L. M., & Ringstad, G. A. (2025) · Fluids and Barriers of the CNS · doi:10.1186/s12987-025-00679-0 · Cited by 10
Self-citationBarker, R. B., Karakaya, E., Baran, D., Ergul, A., Yağmurlu, K., Albayram, S., & Albayram, Ö. (2025) · Molecular and Cellular Neuroscience · doi:10.1016/j.mcn.2025.104031 · Cited by 9
Jain, A., Ang, P. S., Matrongolo, M. J., & Tischfield, M. A. (2023) · Cellular and Molecular Life Sciences · doi:10.1007/s00018-023-04984-5 · Cited by 10
The pitfalls of interpreting hyperintense FLAIR signal as lymph outside the human brain
Ringstad, G. A., & Eide, P. K. (2023) · Nature Communications · doi:10.1038/s41467-023-40508-2 · Cited by 10
Self-citationCerebrospinal Fluid Flow in Patients with Huntington's Disease
Hett, K., Eisma, J. J., Hernandez, A. B., McKnight, C. D., Song, A. K., Elenberger, J., Considine, C. M., Donahue, M. J., & Claassen, D. O. (2023) · Annals of Neurology · doi:10.1002/ana.26749 · Cited by 11
Extracranial transport of brain lymphatics via cranial nerve in human
Çavdar, S., Altınöz, D., Demir, T. D., Gürses, İ. A., & Özcan, G. (2024) · Neuroscience Letters · doi:10.1016/j.neulet.2024.137737 · Cited by 9
Mehta, R. I., & Mehta, R. I. (2024) · NMR in Biomedicine · doi:10.1002/nbm.5149 · Cited by 9
Hua, J., Sun, Y., Li, Y., Zhou, X. Y., Bian, Y., Paez, A. G., Meyer, B. P., & Levendovszky, S. R. (2025) · NeuroImage · doi:10.1016/j.neuroimage.2025.121239 · Cited by 10
Yoon, J., Ji, M., Hwang, I., Lee, W., Yu, S., Kim, J., Lee, C., Lee, H., Koh, B., Bae, H., et al. (2025) · Journal of Cerebral Blood Flow & Metabolism · doi:10.1177/0271678x251353142 · Cited by 10
New insight into DAVF pathology—Clues from meningeal immunity
Tu, T., Peng, Z., Song, Z., Ma, Y., & Zhang, H. (2022) · Frontiers in Immunology · doi:10.3389/fimmu.2022.858924 · Cited by 10
Cao, D., Sun, Y., Li, Y., Su, P., Pillai, J. J., Qiao, Y., Lu, H., van Zijl, P. C. M., Knutsson, L., & Hua, J. (2023) · NMR in Biomedicine · doi:10.1002/nbm.4984 · Cited by 9
Agarwal, N., Frigerio, G., Rizzato, G., Ciceri, T., Mani, E., Lanteri, F., Molteni, M., Carare, R. O., Losa, L., & Peruzzo, D. (2024) · Communications Medicine · doi:10.1038/s43856-024-00622-8 · Cited by 10
Mijnders, L. S., Steup, F. W., Lindhout, M., van der Kleij, P., Brink, W. M., & van der Molen, A. J. (2020) · Acta Radiologica · doi:10.1177/0284185120969950 · Cited by 9
Orexin effect on physiological pulsations of the human brain
Järvelä, M., Kananen, J., Helakari, H., Korhonen, V. O., Huotari, N., Väyrynen, T., Hautamäki, K., Raitamaa, L., Tuunanen, J., Kallio, M., et al. (2025) · Proceedings of the National Academy of Sciences · doi:10.1073/pnas.2501578122 · Cited by 10
Thomas, J., & Benveniste, H. (2022) · The Journal of Experimental Medicine · doi:10.1084/jem.20221719 · Cited by 8
Hett, K., McKnight, C. D., Leguizamon, M., Lindsey, J. S., Eisma, J. J., Elenberger, J., Stark, A. J., Song, A. K., Aumann, M. A., Considine, C. M., et al. (2024) · Fluids and Barriers of the CNS · doi:10.1186/s12987-024-00516-w · Cited by 8
Nakamichi, R., Taoka, T., Kawai, H., Yoshida, T., Sone, M., & Naganawa, S. (2021) · Japanese Journal of Radiology · doi:10.1007/s11604-021-01137-1 · Cited by 8
Neurofluids—Deep inspiration, cilia and preloading of the astrocytic network
Ludwig, H. C., Dreha‐Kulaczewski, S. F., & Bock, H. C. (2021) · Journal of Neuroscience Research · doi:10.1002/jnr.24935 · Cited by 10
Living on the border of the CNS: Dural immune cells in health and disease
Chen, Z., Liu, P., Xia, X., Wang, L., & Li, X. (2022) · Cellular Immunology · doi:10.1016/j.cellimm.2022.104545 · Cited by 9
Neurosurgery and the glymphatic system
Eide, P. K. (2024) · Acta Neurochirurgica · doi:10.1007/s00701-024-06161-4 · Cited by 9
Self-citationAdult Hydrocephalus and the Glymphatic System
Eide, P. K. (2025) · Neurosurgery Clinics of North America · doi:10.1016/j.nec.2024.11.002 · Cited by 9
Self-citationPhysiological brain clearance architecture revealed by neuronal protein tracing
Chayama, Y., Rao, N. R., Perla, D., Zhang, Z., Reid, M. M., Nelson, S., Wen, X., Ding, B., Blumenfeld, J. R., Apolonio, A., et al. (2026) · Cell · doi:10.1016/j.cell.2026.04.048 · Cited by 11
Sarker, A. K., Suh, M., Choi, Y., Park, J. Y., Kwon, S., Kim, H., Lee, E. J., Seo, H., Lee, Y., & Lee, D. S. (2022) · Nuclear Medicine and Molecular Imaging · doi:10.1007/s13139-022-00746-6 · Cited by 6
Moore, M. E., Karakaya, E., Altınbaş, Ö., Bartlett, M. J., Adilbay, D., Ergul, A., Yağmurlu, K., Albayram, M., & Albayram, Ö. (2026) · Neurobiology of Aging · doi:10.1016/j.neurobiolaging.2026.02.002 · Cited by 7
Comparative study of 3D-T2WI vs. 3D-T2-FLAIR MRI in displaying human meningeal lymphatics vessels
Fang, Y., Sun, Y., Lai, T., Song, X., Hu, T., Zhao, Y., Lin, Y., & Bao, Q. (2024) · Clinical Radiology · doi:10.1016/j.crad.2024.09.006 · Cited by 6
The parasagittal dural space of the human brain
Donahue, M. J., McKnight, C. D., Claassen, D. O., & Hett, K. (2025) · Brain · doi:10.1093/brain/awaf204 · Cited by 6
Meningeal lymphatic architecture and drainage dynamics surrounding the human middle meningeal artery
Albayram, S., Richmond, S. B., Yağmurlu, K., Tuna, İ. S., Karakaya, E., Ravichandran, H., Tufan, F., Lesha, E., Mut, M., Bunyak, F., et al. (2025) · iScience · doi:10.1016/j.isci.2025.113693 · Cited by 5
When blood hits the brain: altered glymphatic and dural lymphatic function after surface bleeds
Eide, P. K., Hovd, M. H., Valnes, L. M., Pripp, A. H., & Ringstad, G. A. (2026) · Acta Neurochirurgica · doi:10.1007/s00701-025-06760-9 · Cited by 5
Self-citationChen, Z., Jiang, D., Kong, Y., Zhang, J., Min, C., Bi, S., Yan, S., Ye, H., Li, J., Wang, L., et al. (2024) · Neurology · doi:10.1212/wnl.0000000000210055 · Cited by 5
Bito, Y., Ochi, H., Shirase, R., Yokohama, W., Harada, K., & Kudo, K. (2023) · Magnetic Resonance in Medical Sciences · doi:10.2463/mrms.mp.2023-0081 · Cited by 7
Glymphatic Magnetic Resonance Imaging: Part I—Methodologies for Evaluation of the Glymphatic System
Lee, H., Yoo, R., & Choi, S. H. (2023) · Investigative Magnetic Resonance Imaging · doi:10.13104/imri.2023.0031 · Cited by 6
Oriquat, G., Ali, A. M., Patel, P. N., Hanumanthayya, M., Priyadarshini‐Nayak, P., Bainsal, N., Urazbaeva, D., Xusinovna, D. M., & Ghahari, A. (2026) · Behavioural Brain Research · doi:10.1016/j.bbr.2026.116138 · Cited by 4
Ebrahimi, S.-M., Tuunanen, J., Saarela, V. O., Honkamo, M., Huotari, N., Raitamaa, L., Korhonen, V. O., Helakari, H., Järvelä, M., Kaakinen, M., et al. (2024) · Scientific Reports · doi:10.1038/s41598-023-51069-1 · Cited by 4
Bilgili, A., Tuna, İ. S., Rahman, M., Naney, T. D., & Albayram, S. (2022) · Magnetic Resonance Imaging · doi:10.1016/j.mri.2022.06.013 · Cited by 4
Glymphatics, Cranium, and the Brain Homeostasis
Zibitt, M., Makhoul, V., Yu, J. C.-K., Nguyen, K. D., & Williams, J. K. (2023) · FACE · doi:10.1177/27325016231160291 · Cited by 6
Turkin, A. M., Melnikova-Pitskhelauri, T. V., Fadeeva, L. M., Kozlov, A., Av, O., Кравчук, А. Д., Kozlova, Y. A., Petryaikin, A. V., Ryzhova, M. V., & Pronin, I. (2023) · Burdenko s Journal of Neurosurgery · doi:10.17116/neiro20238705145 · Cited by 4
Esmaeli, M. (2025) · Cell and Tissue Biology · doi:10.1134/s1990519x24600637 · Cited by 3
Koivula, A., Perkiömäki, V., Aho, M., Rasila, A., Poltojainen, V., Korhonen, V. O., Järvelä, M., Huotari, N., Helakari, H., Tuunanen, J., et al. (2025) · NeuroImage · doi:10.1016/j.neuroimage.2025.121503 · Cited by 3
Meningeal B cells: Emerging players at the brain border
Chen, D., & Xu, H. (2026) · Immunity · doi:10.1016/j.immuni.2026.01.013 · Cited by 4
Glymphatic Magnetic Resonance Imaging: Part II—Applications in Sleep and Neurodegenerative Diseases
Lee, H., Yoo, R., & Choi, S. H. (2023) · Investigative Magnetic Resonance Imaging · doi:10.13104/imri.2023.0032 · Cited by 3
Imaging evaluation and volumetric measurement of the space surrounding the diploic veins
Nakamichi, R., Taoka, T., Ito, R., Yoshida, T., Sone, M., & Naganawa, S. (2024) · Japanese Journal of Radiology · doi:10.1007/s11604-024-01572-w · Cited by 3
Metadata
- Authors
- Ringstad, G., & Eide, P. K.
- Affiliations
- Oslo University Hospital (NO)
- Corresponding author
- Eide, Per Kristian
- Venue
- Nature Communications
- Published
- 2020-01-17
- Volume
- 11
- Issue
- 1
- Pages
- 354-354
- ISSN
- 2041-1723 (ISSN-L)
- PMC
- PMC6969040
- OpenAlex
- W3000117238
- Semantic Scholar
- 4ebc1d939b7f614713ef61edcc2b62fdfbbad002
- Cited by
- 292
- References
- 23
- Citations by year
- 2026: 42 · 2025: 50 · 2024: 53 · 2023: 54 · 2022: 45 · 2021: 33 · 2020: 15
- FWCI
- 16.85
- Type
- journal article
- Language
- en
- Open access
- gold
- doi.org
- Locations
- Nature Communications (publishedVersion, cc-by)
- PubMed Central (publishedVersion, cc-by)
- PubMed (publishedVersion)
- RePEc: Research Papers in Economics (submittedVersion)
- DOAJ (DOAJ: Directory of Open Access Journals) (submittedVersion)
- DOAJ (DOAJ: Directory of Open Access Journals) (submittedVersion, cc-by-sa)
- NORA - Norwegian Open Research Archives (submittedVersion, cc-by)
- Funders
- Universitetet i Oslo
- Topics
- Health Sciences › Medicine › Clinical Neurology › Cerebrospinal fluid and hydrocephalus
- Health Sciences › Medicine › Clinical Neurology › Cerebral Venous Sinus Thrombosis
- Health Sciences › Medicine › Clinical Neurology › Neurosurgical Procedures and Complications
- Keywords
- cerebrospinal fluid, superior sagittal sinus, gadobutrol, cerebrospinal fluid clearance, cerebral veins
- MeSH terms
- Adult, Aged, Arachnoid, Biological Transport, Brain, Cerebrospinal Fluid, Contrast Media, Dura Mater, Humans, Lymphatic System, Magnetic Resonance Imaging, Middle Aged, Organometallic Compounds, Lymphatic Vessels, Young Adult
About these checks
Registry, retraction, Cites and statistics results are computed, not judged, with one exception: a printed reference that no index lists is read once by a model before it counts as a citation error. Claims are extracted by a model and kept only when their quote appears verbatim in the text; each cited source is then checked, with a model’s help, for whether it says what the claim relies on. Those verdicts can be wrong — read the claim’s quote and the cited source before relying on one.
A language model drew the claims from the paper on 2026-10-09, under version 3 of the claim definition (model deepseek-v4.1-flash, prompt extract-v3).
A second model labelled each claim on 2026-10-09 (model jev-1.13-20260917, definition revision gold-guideline-v0.2).
Statistics and arithmetic are recomputed, not judged.
Confidence bands are shown only for fields calibrated on our annotated test set. None is calibrated yet, so no band is shown.
What counts as a claim ›How we measure confidence ›How we check this ›
Are you an author, or do you see a problem with this page? Request a review
