

The DOI matches its Crossref record; 21 of the 21 references it cites were found in a registry or an index; 1 of the 13 sources its claims cite were checked for support.
Probing the physical limits of reliable DNA data retrieval.
Open accessAbstract
Synthetic DNA is gaining momentum as a potential storage medium for archival data storage. In this process, digital information is translated into sequences of nucleotides and the resulting synthetic DNA strands are then stored for later retrieval. Here, we demonstrate reliable file recovery with PCR-based random access when as few as ten copies per sequence are stored, on average. This results in density of about 17 exabytes/gram, nearly two orders of magnitude greater than prior work has shown. We successfully retrieve the same data in a complex pool of over 10 10 unique sequences per microliter with no evidence that we have begun to approach complexity limits. Finally, we also investigate the effects of file size and sequencing coverage on successful file retrieval and look for systematic DNA strand drop out. These findings substantiate the robustness and high data density of the process examined here.
Overview
AI snapshot
Written from the paper’s full text.
TL;DR
PCR-based random access recovered three DNA-encoded files reliably when each sequence was present at an average of only 10 copies, yielding a density of about 17 EB g−1. The same data were retrieved from pools with over 10^10 unique sequences per microliter, with no evidence that the complexity limit had been reached.
Key findings
- Successful file recovery with no bit errors required an average of 10 copies per sequence (SD 3), regardless of file size or pool complexity; the files encoded 0.1 KB (2,042 sequences), 1.7 KB (26,404 sequences), and 18 KB (271,447 sequences).
- The demonstrated density was 17 EB g−1, nearly two orders of magnitude greater than prior work; with 15% logical redundancy the maximum estimated density was 38 EB g−1, and with 50% logical redundancy it was 124 EB g−1, ignoring other errors.
- No distinguishable difference in sequence loss was found between water-diluted and 150 Nmer-diluted complex pools; for the large file, only three samples differed, with a mean difference of 0.98% missing sequences (SD 1.82%).
- Increasing sequencing coverage from 20× to 200× reduced missing sequences by only 1.8% on average (SD 1.1%); samples successfully recovered at the lowest copy number had mean sequencing coverage of 35× (SD 11×).
Methods
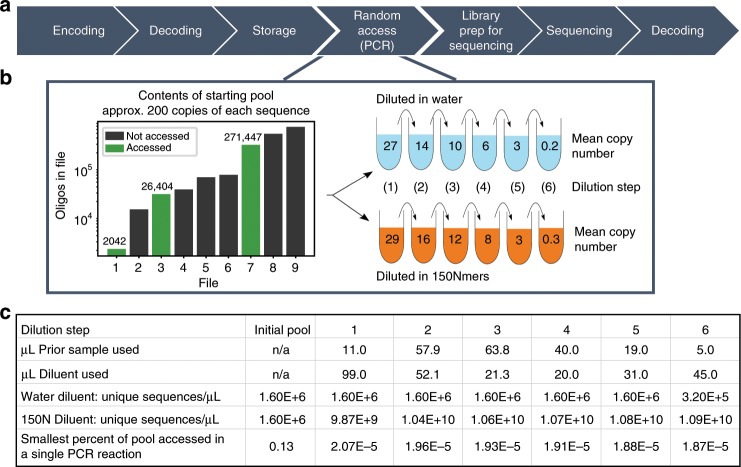
- Three files were randomly accessed from a DNA pool encoding nine files (1.6 M total oligonucleotides), then serially diluted either in water or in 1 ng μL−1 150 Nmers to raise complexity from 1.6 × 10^6 to over 10^10 unique sequences per microliter.
- Copy numbers were measured by triplicate qPCR; for small and medium files, diluted-sample copy numbers were calculated using the large file’s dilution factors because of amplification-efficiency differences.
- Sequencing data were randomly sub-sampled with replacement to 20× coverage 100 times per file per sample to estimate missing sequences; sequence loss was modeled with power regressions (R² 0.90–0.98).
Limitations
- The paper states that appropriate logical and physical redundancy depends on the specific DNA data storage workflow, since synthesis, sequencing, and wet-protocol errors can affect sequence recovery.
- The paper states that only one of the two dilution series was sequenced, and that small and medium file copy numbers for diluted samples were inferred from the large file’s dilution factors rather than measured directly by qPCR.
- The paper states that maximum density estimates of 38 and 124 EB g−1 ignore all other errors such as insertions, deletions, and substitutions; it also notes that increasing sequencing coverage is useful only as a last resort because of cost.
- No dedicated limitations section is present; the above are limitations stated in the text, not an external critique.
Model-written summary. Check it against the paper before relying on it.
Integrity signals
Registry
Cites
Statistics
Figures
Verification
Claims the paper makes
18 Own interpretation · 12 Not checked yet · 12 Own result · 3 No basis given · 1 Partly supported · accuracy not yet measured
The cited sources support only part of this claim — read each source’s verdict below.
In the paper
“A pool complexity emulating nearly 150 GB of digital data per PCR reaction did not hinder file recovery”
- Also stated in: § Reducing copy number and increasing pool complexity · plain
“At ~15.6 bytes of data encoded per strand10, this encoding scheme and experimental protocol emulate ~150 GB of digital data per microliter, and 7 TB in the final 50 μL solution.”
§ Probing the physical limits of reliable DNA data retrieval > Results > Reducing copy number and increasing pool complexity
What the sources say
- Partly supportedcites [10] Organick, L. et al. Random access in large-scale DNA data storage. Nat. Biotechnol. 36, 242–248 (2018). sourceExperimental — accuracy not yet measured
The scaling and random-access section (pp. 3–5) reports PCR-based file retrieval and recovery of all 200 MB of encoded data. It does not report a pool emulating nearly 150 GB per PCR reaction; the stated pool contains about 200 MB of digital data. (LLM, conf=0.88)
plain- Asserted: passes — The authors put it forward as true.
- Checkable: passes — It can be checked against evidence.
- Load-bearing: passes — The paper’s conclusions depend on it.
- Based: passes — The paper gives a reason why it holds.
- Also stated in: § Reducing copy number and increasing pool complexity · plain
A result the paper reports from its own data — it cites no other source for it, so there is none to check. The quote shows it is in the paper.
In the paper
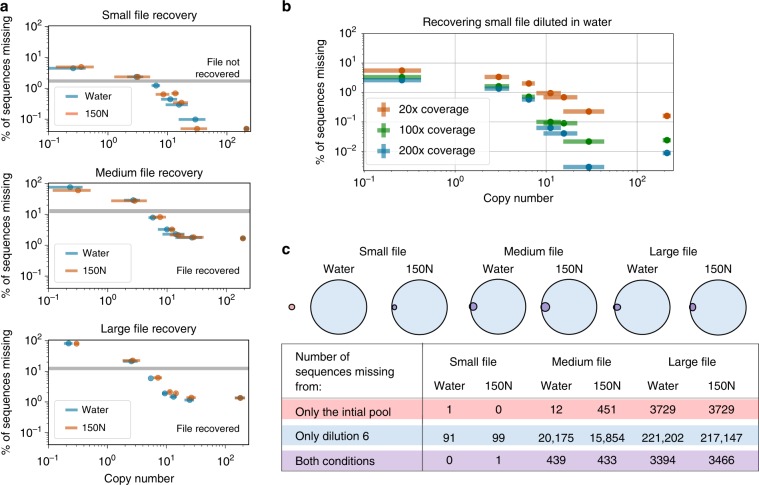
“many of the strands “reappear” in subsequent dilutions as shown briefly in Fig. 3c”
§ Probing the physical limits of reliable DNA data retrieval > Results > Sequence behavior
plain- Asserted: passes — The authors put it forward as true.
- Checkable: passes — It can be checked against evidence.
- Load-bearing: passes — The paper’s conclusions depend on it.
- Based: passes — The paper gives a reason why it holds.
The paper states this without a source or data behind it here, so there is nothing to check it against. The quote shows it is in the paper.
In the paper
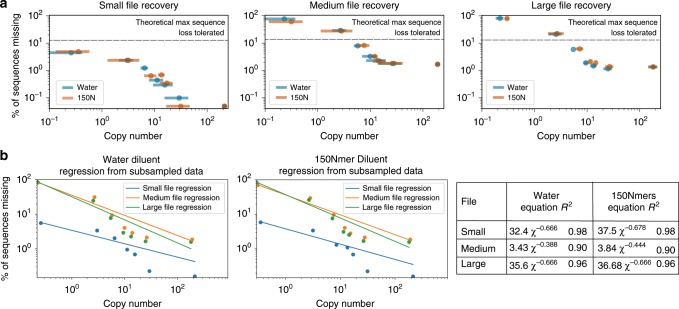
“However, though the medium and large files behaved almost indistinguishably, the small file did not lose sequences at a similar rate after the copy number fell below ~10 (see Fig. 2a). Instead, it lost fewer sequences than the larger two files.”
§ Probing the physical limits of reliable DNA data retrieval > Results > Reducing copy number and increasing pool complexity
plain- Asserted: passes — The authors put it forward as true.
- Checkable: passes — It can be checked against evidence.
- Load-bearing: unclear — It is unclear whether the paper’s conclusions depend on it.
- Based: passes — The paper gives a reason why it holds.
A result the paper reports from its own data — it cites no other source for it, so there is none to check. The quote shows it is in the paper.
In the paper
“This resulted in a mean of 1.8% fewer missing sequences for 200× coverage, with a standard deviation of 1.1% (Fig. 3b).”
§ Probing the physical limits of reliable DNA data retrieval > Results > Sequencing depth
plaindirect- Asserted: passes — The authors put it forward as true.
- Checkable: passes — It can be checked against evidence.
- Load-bearing: passes — The paper’s conclusions depend on it.
- Based: passes — The paper gives a reason why it holds.
A result the paper reports from its own data — it cites no other source for it, so there is none to check. The quote shows it is in the paper.
In the paper
“We successfully retrieve the same data in a complex pool of over 1010 unique sequences per microliter with no evidence that we have begun to approach complexity limits.”
- Also stated in: § Reducing copy number and increasing pool complexity · plain
“By diluting samples with 1 ng μL−1 150 Nmers, pool complexity increased from 1.6 × 10⁶ unique sequences in the initial pool (Fig. 1b) to over 1010 unique sequences per microliter (see Supplementary Note 2).”
§ Probing the physical limits of reliable DNA data retrieval > Abstract
plain- Asserted: passes — The authors put it forward as true.
- Checkable: passes — It can be checked against evidence.
- Load-bearing: passes — The paper’s conclusions depend on it.
- Based: passes — The paper gives a reason why it holds.
- Also stated in: § Reducing copy number and increasing pool complexity · plain
A result the paper reports from its own data — it cites no other source for it, so there is none to check. The quote shows it is in the paper.
In the paper
“We found no distinguishable difference when comparing sequence loss between water and complex 150 Nmer dilution conditions (Fig. 2a).”
§ Probing the physical limits of reliable DNA data retrieval > Results > Reducing copy number and increasing pool complexity
plain- Asserted: passes — The authors put it forward as true.
- Checkable: passes — It can be checked against evidence.
- Load-bearing: passes — The paper’s conclusions depend on it.
- Based: passes — The paper gives a reason why it holds.
A result the paper reports from its own data — it cites no other source for it, so there is none to check. The quote shows it is in the paper.
In the paper
“Here, we demonstrate reliable file recovery with PCR-based random access when as few as ten copies per sequence are stored, on average.”
- Also stated in: § Reducing copy number and increasing pool complexity · plain
“Regardless of pool complexity or size of file accessed, only 10 copies of each strand on average, with a standard deviation of 3, are required for successful recovery with no bit errors.”
§ Probing the physical limits of reliable DNA data retrieval > Abstract
boosteddirect- Asserted: passes — The authors put it forward as true.
- Checkable: passes — It can be checked against evidence.
- Load-bearing: passes — The paper’s conclusions depend on it.
- Based: passes — The paper gives a reason why it holds.
- Also stated in: § Reducing copy number and increasing pool complexity · plain
A result the paper reports from its own data — it cites no other source for it, so there is none to check. The quote shows it is in the paper.
In the paper
“Encouragingly, the size of the file being recovered also does not impact the copy number required in complex pool conditions (Figs. 2 and 3a).”
§ Probing the physical limits of reliable DNA data retrieval > Results > Reducing copy number and increasing pool complexity
plain- Asserted: passes — The authors put it forward as true.
- Checkable: passes — It can be checked against evidence.
- Load-bearing: passes — The paper’s conclusions depend on it.
- Based: passes — The paper gives a reason why it holds.
A result the paper reports from its own data — it cites no other source for it, so there is none to check. The quote shows it is in the paper.
In the paper
“We also look at the effects of increasing sequencing coverage to ten times greater than the coverage used in this work’s analysis and find that it is minimally effective at retrieving more sequences.”
- Also stated in: § Sequencing depth · plain
“This resulted in a mean of 1.8% fewer missing sequences for 200× coverage, with a standard deviation of 1.1% (Fig. 3b).”
§ Probing the physical limits of reliable DNA data retrieval > Introduction
plain- Asserted: passes — The authors put it forward as true.
- Checkable: passes — It can be checked against evidence.
- Load-bearing: passes — The paper’s conclusions depend on it.
- Based: passes — The paper gives a reason why it holds.
- Also stated in: § Sequencing depth · plain
A result the paper reports from its own data — it cites no other source for it, so there is none to check. The quote shows it is in the paper.
In the paper
“Yet we observed no difference in sequence behavior between the two different dilution conditions.”
§ Probing the physical limits of reliable DNA data retrieval > Results > Sequence behavior
plain- Asserted: passes — The authors put it forward as true.
- Checkable: passes — It can be checked against evidence.
- Load-bearing: passes — The paper’s conclusions depend on it.
- Based: passes — The paper gives a reason why it holds.
- It may state two separate claims as one. 14
- Probably not a substantial claim. 11
A result the paper reports from its own data — it cites no other source for it, so there is none to check. The quote shows it is in the paper.
In the paper
“We found that the samples successfully recovered at the lowest possible copy number had a mean sequencing coverage of 35× with a standard deviation 11×, with a mean copy number of 10 and a standard deviation of 3 when accounting for all files and all diluent conditions (Supplementary Note 7, Fig. 3a).”
§ Probing the physical limits of reliable DNA data retrieval > Results > Sequencing depth
plain- Asserted: passes — The authors put it forward as true.
- Checkable: passes — It can be checked against evidence.
- Load-bearing: passes — The paper’s conclusions depend on it.
- Based: passes — The paper gives a reason why it holds.
It may state two separate claims as one.
In the paper
“This results in density of about 17 exabytes/gram, nearly two orders of magnitude greater than prior work has shown.”
- Also stated in: § Data density · plain
“Determining the need for a minimum of ~10 copies of each DNA sequence in the PCR reaction to successfully recover a file enables us to calculate a density of 17 EB g−1, nearly two orders of magnitude denser than prior work7 and closer to the maximum theoretical density predicted for DNA data storage1 (see Supplementary Note 5).”
- Also stated in: § Discussion · boosted
“By demonstrating files with a copy number of approximately 10 can be successfully recovered, we present the most practically dense system to date at 17 EB g−1, nearly two orders of magnitude greater than the densest prior work7.”
§ Probing the physical limits of reliable DNA data retrieval > Abstract
What the sources say
- Not checked yetcites [7] Erlich, Y. & Zielinski, D. DNA Fountain enables a robust and efficient storage architecture. Science 355, 950–954 (2017). source
boosted- Asserted: passes — The authors put it forward as true.
- Checkable: passes — It can be checked against evidence.
- Load-bearing: passes — The paper’s conclusions depend on it.
- Based: passes — The paper gives a reason why it holds.
It may state two separate claims as one.
- Also stated in: § Data density · plain
In the paper
“At ~15.6 bytes of data encoded per strand10, this encoding scheme and experimental protocol emulate ~150 GB of digital data per microliter, and 7 TB in the final 50 μL solution.”
§ Probing the physical limits of reliable DNA data retrieval > Results > Reducing copy number and increasing pool complexity
What the sources say
- Not checked yetcites [10] Organick, L. et al. Random access in large-scale DNA data storage. Nat. Biotechnol. 36, 242–248 (2018). source
plain- Asserted: passes — The authors put it forward as true.
- Checkable: passes — It can be checked against evidence.
- Load-bearing: passes — The paper’s conclusions depend on it.
- Based: passes — The paper gives a reason why it holds.
It may state two separate claims as one.
In the paper
“Though the commonly analyzed human and mouse genome are both nearly 3 gigabases13, approximately two orders of magnitude fewer bases than examined in this work’s most complex condition, genomic libraries are often exceedingly complex because of the genome fragmentation process.”
§ Probing the physical limits of reliable DNA data retrieval > Introduction
What the sources say
- Not checked yetcites [13] Geer, L. Y. et al. The NCBI BioSystems database. Nucleic Acids Res. 38, D492–D496 (2010). source
plain- Asserted: passes — The authors put it forward as true.
- Checkable: passes — It can be checked against evidence.
- Load-bearing: fails — The paper’s conclusions may not depend on it.
- Based: passes — The paper gives a reason why it holds.
Probably not a substantial claim. The paper’s conclusions may not depend on it.
A conclusion the paper draws from its own results — it cites no other source for it, so there is none to check. The quote shows it is in the paper.
In the paper
“The logical redundancy used in this work was 15%, which tolerates a maximum of 13% of sequences missing (if there are 100 sequences and we apply 15% logical redundancy, there are now 100+15 sequences and we can tolerate 15/115 missing).”
§ Probing the physical limits of reliable DNA data retrieval > Results > Data density
plaindirect- Asserted: passes — The authors put it forward as true.
- Checkable: passes — It can be checked against evidence.
- Load-bearing: passes — The paper’s conclusions depend on it.
- Based: passes — The paper gives a reason why it holds.
It may state two separate claims as one.
A conclusion the paper draws from its own results — it cites no other source for it, so there is none to check. The quote shows it is in the paper.
In the paper
“A relatively small increase in logical redundancy allows for a disproportionately lower physical redundancy with no data loss. This results in higher overall data density.”
§ Probing the physical limits of reliable DNA data retrieval > Results > Data density
plaindirect- Asserted: passes — The authors put it forward as true.
- Checkable: passes — It can be checked against evidence.
- Load-bearing: passes — The paper’s conclusions depend on it.
- Based: passes — The paper gives a reason why it holds.
It may state two separate claims as one.
A conclusion the paper draws from its own results — it cites no other source for it, so there is none to check. The quote shows it is in the paper.
In the paper
“Both factors likely minimize interactions between the desired strands and the strands added for complexity.”
§ Probing the physical limits of reliable DNA data retrieval > Introduction
hedgedconditional- Asserted: passes — The authors put it forward as true.
- Checkable: passes — It can be checked against evidence.
- Load-bearing: fails — The paper’s conclusions may not depend on it.
- Based: fails — The paper may give no reason why it holds.
Probably not a substantial claim. The paper’s conclusions may not depend on it. The paper may give no reason why it holds.
A conclusion the paper draws from its own results — it cites no other source for it, so there is none to check. The quote shows it is in the paper.
In the paper
“These findings substantiate the robustness and high data density of the process examined here.”
§ Probing the physical limits of reliable DNA data retrieval > Abstract
plain- Asserted: passes — The authors put it forward as true.
- Checkable: passes — It can be checked against evidence.
- Load-bearing: passes — The paper’s conclusions depend on it.
- Based: passes — The paper gives a reason why it holds.
It may state two separate claims as one.
A conclusion the paper draws from its own results — it cites no other source for it, so there is none to check. The quote shows it is in the paper.
In the paper
“find no systematic sequence loss, thus showing sequence loss is stochastic and not due to sequence design.”
- Also stated in: § Sequence behavior · hedged
“Thus, sequences may be changing proportions or are observed to be missing due to stochastic variation in sub-sampling.”
- Also stated in: § Sequence behavior · hedged
“this indicates that these sequences disappeared and reappeared due to stochastic effects rather than systematic interactions that made certain sequences irretrievable.”
§ Probing the physical limits of reliable DNA data retrieval > Introduction
boosted- Asserted: passes — The authors put it forward as true.
- Checkable: passes — It can be checked against evidence.
- Load-bearing: passes — The paper’s conclusions depend on it.
- Based: passes — The paper gives a reason why it holds.
It may state two separate claims as one.
- Also stated in: § Sequence behavior · hedged
In the paper
“In more recent work, a different method of random access using bead extraction of desired strands prior to PCR random access utilized 1018 unique sequences11.”
§ Probing the physical limits of reliable DNA data retrieval > Introduction
What the sources say
- Not checked yetcites [11] Tomek, K. J. et al. Driving the scalability of DNA-based information storage systems. ACS Synth. Biol. 8, 1241–1248 (2019). source
plain- Asserted: passes — The authors put it forward as true.
- Checkable: passes — It can be checked against evidence.
- Load-bearing: fails — The paper’s conclusions may not depend on it.
- Based: passes — The paper gives a reason why it holds.
Probably not a substantial claim. The paper’s conclusions may not depend on it.
In the paper
“While the effect of homopolymers in the payload has recently found to be minimal in practice19, it is encouraging to note that the care taken to randomize payloads yields no systematic sequence loss.”
§ Probing the physical limits of reliable DNA data retrieval > Results > Sequence behavior
What the sources say
- Not checked yetcites [19] Chen, Y.-J. et al. Quantifying molecular bias in DNA data storage. Preprint at https://www.biorxiv.org/content/10.1101/566554v1 (2019). source
plain- Asserted: passes — The authors put it forward as true.
- Checkable: passes — It can be checked against evidence.
- Load-bearing: fails — The paper’s conclusions may not depend on it.
- Based: passes — The paper gives a reason why it holds.
Probably not a substantial claim. The paper’s conclusions may not depend on it.
A conclusion the paper draws from its own results — it cites no other source for it, so there is none to check. The quote shows it is in the paper.
In the paper
“Based on the rate at which sequences are lost (Fig. 2b) and ignoring all other errors (such as insertions, deletions, substitutions), the maximum data density is 38 EB g−1 for the scheme with 15% logical redundancy and 124 EB g−1 for 50% logical redundancy.”
§ Probing the physical limits of reliable DNA data retrieval > Results > Data density
plaindirect- Asserted: passes — The authors put it forward as true.
- Checkable: passes — It can be checked against evidence.
- Load-bearing: passes — The paper’s conclusions depend on it.
- Based: passes — The paper gives a reason why it holds.
It may state two separate claims as one.
In the paper
“It is important to note that the encoding scheme presented in prior work10 and used here encodes the payload between the primer regions by using a randomized seed to generate a random payload and exclude homopolymers.”
§ Probing the physical limits of reliable DNA data retrieval > Results > Sequence behavior
What the sources say
- Not checked yetcites [10] Organick, L. et al. Random access in large-scale DNA data storage. Nat. Biotechnol. 36, 242–248 (2018). source
plain- Asserted: passes — The authors put it forward as true.
- Checkable: passes — It can be checked against evidence.
- Load-bearing: fails — The paper’s conclusions may not depend on it.
- Based: passes — The paper gives a reason why it holds.
Probably not a substantial claim. The paper’s conclusions may not depend on it.
A conclusion the paper draws from its own results — it cites no other source for it, so there is none to check. The quote shows it is in the paper.
In the paper
“we demonstrate the ability of the storage method used in this work to enable efficient, reliable data retrieval in complex settings.”
§ Probing the physical limits of reliable DNA data retrieval > Discussion
boosteddirect- Asserted: passes — The authors put it forward as true.
- Checkable: passes — It can be checked against evidence.
- Load-bearing: passes — The paper’s conclusions depend on it.
- Based: passes — The paper gives a reason why it holds.
It may state two separate claims as one.
A conclusion the paper draws from its own results — it cites no other source for it, so there is none to check. The quote shows it is in the paper.
In the paper
“However, in addition to different random access techniques and strand architecture, those methods differ substantially from the methods presented here and make it difficult to compare to this work.”
§ Probing the physical limits of reliable DNA data retrieval > Introduction
plaindirect- Asserted: passes — The authors put it forward as true.
- Checkable: passes — It can be checked against evidence.
- Load-bearing: fails — The paper’s conclusions may not depend on it.
- Based: passes — The paper gives a reason why it holds.
Probably not a substantial claim. The paper’s conclusions may not depend on it. It may state two separate claims as one.
In the paper
“their methods employ mutagenetic PCR on template strands which introduces an approximate 5% error rate to the final PCR product12 while maintaining a conserved PCR primer region.”
§ Probing the physical limits of reliable DNA data retrieval > Introduction
What the sources say
- Not checked yetcites [12] Zaccolo, M. & Gherardi, E. The effect of high-frequency random mutagenesis on in vitro protein evolution: a study on tem-1 β-lactamase. J. Mol. Biol. 285, 775–783 (1999). source
plaindirect- Asserted: passes — The authors put it forward as true.
- Checkable: passes — It can be checked against evidence.
- Load-bearing: fails — The paper’s conclusions may not depend on it.
- Based: passes — The paper gives a reason why it holds.
Probably not a substantial claim. The paper’s conclusions may not depend on it.
A conclusion the paper draws from its own results — it cites no other source for it, so there is none to check. The quote shows it is in the paper.
In the paper
“Nevertheless, both works are consistent in concluding that the limit to random access complexity is not 1010 sequences per random access reaction.”
§ Probing the physical limits of reliable DNA data retrieval > Introduction
plain- Asserted: passes — The authors put it forward as true.
- Checkable: passes — It can be checked against evidence.
- Load-bearing: fails — The paper’s conclusions may not depend on it.
- Based: passes — The paper gives a reason why it holds.
Probably not a substantial claim. The paper’s conclusions may not depend on it.
A conclusion the paper draws from its own results — it cites no other source for it, so there is none to check. The quote shows it is in the paper.
In the paper
“This method of increasing sequencing coverage has the benefit of not requiring additional material from the original pool because there is extra material post library preparation to sequence many times over.”
§ Probing the physical limits of reliable DNA data retrieval > Results > Sequencing depth
plain- Asserted: passes — The authors put it forward as true.
- Checkable: passes — It can be checked against evidence.
- Load-bearing: fails — The paper’s conclusions may not depend on it.
- Based: passes — The paper gives a reason why it holds.
Probably not a substantial claim. The paper’s conclusions may not depend on it.
A conclusion the paper draws from its own results — it cites no other source for it, so there is none to check. The quote shows it is in the paper.
In the paper
“The finding that sequences are lost stochastically coupled with the finding that there is no recovery threshold difference between samples diluted with water and those in more complex settings diluted with 150 Nmers thus assures users of this encoding scheme that we have not yet reached the limit of how complex a pool can be before it inhibits the ability to recover desired information.”
§ Probing the physical limits of reliable DNA data retrieval > Results > Sequence behavior
plain- Asserted: passes — The authors put it forward as true.
- Checkable: passes — It can be checked against evidence.
- Load-bearing: passes — The paper’s conclusions depend on it.
- Based: passes — The paper gives a reason why it holds.
It may state two separate claims as one.
A conclusion the paper draws from its own results — it cites no other source for it, so there is none to check. The quote shows it is in the paper.
In the paper
“It is important to note that determining the appropriate logical and physical redundancy depends on the specific DNA data storage workflow, for errors incurred by DNA synthesis, sequencing, and wet protocols used can affect sequence recovery.”
§ Probing the physical limits of reliable DNA data retrieval > Results > Data density
plaindirect- Asserted: passes — The authors put it forward as true.
- Checkable: passes — It can be checked against evidence.
- Load-bearing: fails — The paper’s conclusions may not depend on it.
- Based: passes — The paper gives a reason why it holds.
Probably not a substantial claim. The paper’s conclusions may not depend on it. It may state two separate claims as one.
A conclusion the paper draws from its own results — it cites no other source for it, so there is none to check. The quote shows it is in the paper.
In the paper
“Theoretically, we would expect to encounter a duplicate sequence only after 4150 (2 × 1090) sequences had been synthesized; thus, we would expect each strand to be unique.”
§ Probing the physical limits of reliable DNA data retrieval > Results > Reducing copy number and increasing pool complexity
hedged- Asserted: passes — The authors put it forward as true.
- Checkable: passes — It can be checked against evidence.
- Load-bearing: passes — The paper’s conclusions depend on it.
- Based: passes — The paper gives a reason why it holds.
It may state two separate claims as one.
A conclusion the paper draws from its own results — it cites no other source for it, so there is none to check. The quote shows it is in the paper.
In the paper
“This is likely due to a combination of copy number being slightly higher than calculated, fewer sequences initially missing due to variation in synthesis, and the distribution of sequences being slightly more uniform (see Supplementary Note 3 for detailed analysis).”
§ Probing the physical limits of reliable DNA data retrieval > Results > Reducing copy number and increasing pool complexity
hedgedconditional- Asserted: passes — The authors put it forward as true.
- Checkable: passes — It can be checked against evidence.
- Load-bearing: fails — The paper’s conclusions may not depend on it.
- Based: passes — The paper gives a reason why it holds.
Probably not a substantial claim. The paper’s conclusions may not depend on it. It may state two separate claims as one.
Claims other papers make about this one
Each is checked against this paper’s own text: does it say what the citing paper says it does?
The source backs part of the claim, not all of it — or backs it for a different population, condition or comparison.
In the citing paper
“On the basis of its physical dimensions, DNA has a theoretical data density of 6 bits for every 1 nm of polymer, or ∼4.5 × 107 GB/g,6 which is orders of magnitude higher than the densities achievable using traditional devices.7,8”
From Emerging Approaches to DNA Data Storage: Challenges and Prospects (2022) · cites this paper as [6]
Experimental — accuracy not yet measuredIn the citing paper
“The storage density has increased from 2.2 PB/g (petabytes per gram DNA) to 17,000 PB/g (Erlich and Zielinski, 2017; Organick et al., 2020).”
From Large-Scale de Novo Oligonucleotide Synthesis for Whole-Genome Synthesis and Data Storage: Challenges and Opportunities (2021) · cites this paper as Organick et al., 2020
In the citing paper
“This represents the maximum data that can be stored within a single macroscopic storage container, and has been estimated to lie between a few TB up to a few hundred TB.56,6,70”
From Emerging Approaches to DNA Data Storage: Challenges and Prospects (2022) · cites this paper as [6]
In the citing paper
“Currently, the highest demonstrated data capacity for random access is on the order of terabytes of data.6,12,71”
From Emerging Approaches to DNA Data Storage: Challenges and Prospects (2022) · cites this paper as [6]
In the citing paper
“While this does not appear to be a hard limit,6 it is likely unpractical to scale random access by PCR-based addressing indefinitely because of the aforementioned difficulty of orthogonal primer design and the requirement for many amplification cycles given the associated impact of PCR bias.20”
From Emerging Approaches to DNA Data Storage: Challenges and Prospects (2022) · cites this paper as [6]
In the citing paper
“In this case, each PCR amplification may introduce stochastic variation in copy number of the file sequences, leading to up to 2% data loss per amplification19 if using ten-fold physical redundancy, as recently suggested18.”
From Random access DNA memory using Boolean search in an archival file storage system (2021) · cites this paper as [18]
Citations
Cites
Next-Generation Digital Information Storage in DNA
Church, G. M., Gao, Y., & Kosuri, S. (2012) · Science · doi:10.1126/science.1226355 · Cited by 1,441
Bayesian approach to single-cell differential expression analysis
Kharchenko, P. V., Silberstein, L., & Scadden, D. T. (2014) · Nature Methods · doi:10.1038/nmeth.2967 · Cited by 1,348
Towards Practical, High-Capacity, Low-Maintenance Information Storage in Synthesized DNA
Goldman, N., Bertone, P., Chen, S., Dessimoz, C., LeProust, E. M., Sipos, B., & Birney, E. (2013) · Nature · doi:10.1038/nature11875 · Cited by 1,220
DNA Fountain enables a robust and efficient storage architecture
Erlich, Y., & Zielinski, D. (2017) · Science · doi:10.1126/science.aaj2038 · Cited by 898
Geer, L. Y., Marchler-Bauer, A., Geer, R. C., Han, L., He, J., He, S., Liu, C., Shi, W., & Bryant, S. H. (2010) · Nucleic Acids Research · doi:10.1093/nar/gkp858 · Cited by 875
Random access in large-scale DNA data storage
Organick, L., Ang, S. D., Chen, Y.-J., Lopez, R., Yekhanin, S., Makarychev, K., Racz, M. Z., Kamath, G., Gopalan, P., Nguyen, B., et al. (2018) · Nature Biotechnology · doi:10.1038/nbt.4079 · Cited by 775
Self-citationRobust Chemical Preservation of Digital Information on DNA in Silica with Error-Correcting Codes
Grass, R. N., Heckel, R., Puddu, M., Paunescu, D., & Stark, W. J. (2015) · Angewandte Chemie International Edition · doi:10.1002/anie.201411378 · Cited by 754
Missing value estimation for DNA microarray gene expression data: local least squares imputation
Kim, H., Golub, G. H., & Park, H. (2004) · Bioinformatics · doi:10.1093/bioinformatics/bth499 · Cited by 482
A Rewritable, Random-Access DNA-Based Storage System
Tabatabaei Yazdi, S. M. H., Yuan, Y., Ma, J., Zhao, H., & Milenkovic, O. (2015) · Scientific Reports · doi:10.1038/srep14138 · Cited by 401
Portable and Error-Free DNA-Based Data Storage
Yazdi, S. M. H. T., Gabrys, R., & Milenkovic, O. (2017) · Scientific Reports · doi:10.1038/s41598-017-05188-1 · Cited by 361
Cited by
Sorted by citations
Items 101–134 of 134
Long Term Conservation of DNA at Ambient Temperature. Implications for DNA Data Storage
Coudy, D., Colotte, M., Luis, A., Tuffet, S., & Bonnet, J. (2022) · Applied Cell Biology · doi:10.53043/2320-1991.acb90017
Wang, Y. (2021) · DR-NTU (Nanyang Technological University) · doi:10.32657/10356/155241
Czy plastik może rozpocząć nową erę w archiwizacji danych?
Lizak, A., & Szweda, R. (2022) · Archeion · doi:10.4467/26581264arc.22.014.16667
Berleant, J., Banal, J. L., Rao, D. K., & Bathe, M. (2024) · medRxiv · doi:10.1101/2024.04.12.24305660
Preserving History with Synthetic DNA: An Innovative Data Storage Solution
Ghosh, N., Reddy, N. A., Sasank, V., Suvarchala, K., & Patkar, S. (2024) · IEEE International Conference on Electronics, Computing and Communication Technologies (CONECCT) · doi:10.1109/conecct62155.2024.10677101
Research Progress on Nucleic Acid Information Material
Song, L., Li, M., & Zuo, X. (2025) · 中国科学基金 · doi:10.3724/bnsfc-2025.02.19.0002
Design of Memristive DNA-Biosensors for in-Memory Sensing or in-Sensors Computing
Chen, J., & Carrara, S. (2025) · IEEE BioSensors Conference (BioSensors) · doi:10.1109/biosensors65002.2025.11239161
PERFECT PCR: Advancing DNA Data Storage to Near-Maximal DensityPreprint
Sabnis, R., Zhang, H., Li, B., Han, A., de Figueiredo, P., & Sun, Q. (2025) · bioRxiv (Cold Spring Harbor Laboratory) · doi:10.64898/2025.12.15.694532
A Hybridization-Based Novel DNA Storage Technology with Rapid Read PerformancePreprint
Zhang, Y., Jia, L., XiaoXia, W. A. N. G., Shi, Y., Wang, H., Zhang, D., Cheng, P., Zhao, Y., Xu, M., Zhang, X., et al. (2025) · bioRxiv (Cold Spring Harbor Laboratory) · doi:10.64898/2025.12.24.696143
Biologically Constrained DNA Encoding With Triplet Networks for Similarity Image Retrieval
Koike, T., Awano, H., & Sato, T. (2026) · IEEE Transactions on Computational Biology and Bioinformatics · doi:10.1109/tcbbio.2026.3673740
Synthesis of new alkoxyamine spacers for the elaboration of encoded polymers
Launay, K. (2020) · theses.fr (ABES) · doi:10.70675/b32012b4zca6az4075z86f4zd547cd9d0ab8
Sécurité des données stockées sur molécules d’ADN
Berton, C. (2024) · theses.fr (ABES) · doi:10.70675/0f5289f1z1beaz4311z8029za15b04416483
Propelling DNA-Based Archival Storage With an Algorithmic Mindset
Yang, Y., Wei, W., & Mou, M. (2026) · IEEE Transactions on Molecular Biological and Multi-Scale Communications · doi:10.1109/tmbmc.2026.3694522
RIDE: Random interleaving data encoding method for enhancing DNA storage efficiency
Bi, K., Ma, Z., Li, Z., Sun, Q., Lu, Z., & Zhao, X. (2026) · Results in Engineering · doi:10.1016/j.rineng.2026.111485
Bio-inspired approaches to in vivo DNA data storage systems
Zhang, Y., Liu, Y., Wan, S., Su, J., Zhang, H., Wang, F., & Liu, K. (2026) · Materials Horizons · doi:10.1039/d6mh00728g
Long-stranded XNA-cssDNA hybrids for robust data storage
Sun, X., Pei, Y., Tan, P., Bian, T., Wang, R. L., Wang, Y., Xie, J., Hong, L., & Song, J. (2026) · Science Advances · doi:10.1126/sciadv.aed2917
Liang, B., Tang, X., Meng, Y., Tian, Y., Deng, Z., Li, Z., 薛星美, Duan, J., Chen, C., & Xie, S. (2026) · Journal of Electroanalytical Chemistry · doi:10.1016/j.jelechem.2026.120376
Introduction to DNA Storage Technology
Gupta, M. K., Ping, Z., Rasool, A., Cao, B., & Burgi, P. (2026) · Springer eBooks · doi:10.1007/978-981-95-9450-4_1
Shield, Repair, Reconstruct: An Integrated Framework for Long-Term DNA Data Storage
Liu, L., Wu, J., Huang, Y., Wang, M., He, B., Song, L., & Sun, J. (2026) · Springer eBooks · doi:10.1007/978-981-95-9450-4_10
Security of DNA Data Storage and DNA for Cybersecurity: A Dual Perspective
Berton, C., Gasnier, H., Canève, M., Bellafqira, R., & Coatrieux, G. (2026) · Springer eBooks · doi:10.1007/978-981-95-9450-4_17
End to End Rewritable DNA Data Storage
Rajesh, A. (2026) · Springer eBooks · doi:10.1007/978-981-95-9450-4_15
Molecular access control for random-access DNA data storagePreprint
Bögels, B. W. A., Vermathen, R. T., Yurchenko, A., Takahashi, C. N., Markvoort, A. J., & de Greef, T. F. A. (2026) · bioRxiv (Cold Spring Harbor Laboratory) · doi:10.64898/2026.08.12.744375
CRISPR-Cas12a-based querying of DNA-stored MRI and PET imaging data
Fu, R., Hong, J., Qu, Q., Hong, Z., Jiang, Q., & Xianyu, Y. (2026) · Medical Image Analysis · doi:10.1016/j.media.2026.104272
Bódis, J., Berke, J., Nagy, B., Gulyás, I., Hersics, P., Várnagy, Á., & Kovács, K. (2026) · Frontiers in Endocrinology · doi:10.3389/fendo.2026.1861061
Optimization-Theoretic Analysis of Nanopore Sequencing Channels
Taricco, G. (2026) · IEEE International Symposium on Information Theory (ISIT) · doi:10.1109/isit62367.2026.11653717
Staple Codes: Bounds and Constructions
Wernhart, K. S., Cohen, T., Yaakobi, E., & Schroeder, F. (2026) · IEEE International Symposium on Information Theory (ISIT) · doi:10.1109/isit62367.2026.11653723
Nontraditional molecular-bit DNA storage
Liu, X., Wu, R., Liang, Y., Gong, Y., Zhang, Y., & Zhang, C. (2026) · Chinese Science Bulletin (Chinese Version) · doi:10.1360/csb-2026-0924
Self-citationTowards A System Model for DNA-based Storage
Schustermann, S., Kogan, L., Factor, M., Naor, D., & Yadgar, G. (2026) · ACM Workshop on Hot Topics in Storage and File Systems (HotStorage) · doi:10.1145/3837053.3837346
Zang, Z., Jia, S., Jia, S., Zhang, Q., Zhang, T., Wu, L., Wang, P., Shufang, 张. Z., Wu, H., & Yu, J. (2026) · Advanced Engineering Informatics · doi:10.1016/j.aei.2026.105296
ProbeFS: Hierarchical DNA File Systems via Biochemical Content Addressability and Parallelism
Li, R., Zhang, Y., Dong, M., Hao, Y., Wang, F., Fan, C., & Chen, H. (2026) · ACM SIGOPS Symposium on Operating Systems Principles (SOSP) · doi:10.1145/3830418.3843890
Toward sustainable DNA storage: Adaptive error-resilient encoding under biochemical constraints
NallappaBhavithran, G., & Selvakumar, R. (2026) · Systems and Soft Computing · doi:10.1016/j.sasc.2026.200625
Yang, S., Wang, D., Liu, Q., Lan, X., Zhao, Z., Wang, W., Xia, K., Gao, X., Luo, Y., & Zhao, J. (2026) · Microsystems & Nanoengineering · doi:10.1038/s41378-026-01456-1
Archival data storage using DNA proximity graphsPreprint
Perry, E., Tiepelt, J., & Jacobson, J. (2026) · bioRxiv (Cold Spring Harbor Laboratory) · doi:10.64898/2026.10.12.758707
Metadata
- Authors
- Organick, L., Chen, Y.-J., Dumas Ang, S., Lopez, R., Liu, X., Strauss, K., & Ceze, L.
- Affiliations
- University of Washington (US)
- Microsoft (United States) (US)
- Corresponding author
- Organick, Lee
- Strauss, Karin
- Venue
- Nature Communications
- Published
- 2020-01-30
- Volume
- 11
- Issue
- 1
- Pages
- 616-616
- ISSN
- 2041-1723 (ISSN-L)
- PMC
- PMC6992699
- OpenAlex
- W3003918453
- Semantic Scholar
- a5133ffd70b88f4999335667a3014d88e383353c
- Cited by
- 135
- References
- 21
- Citations by year
- 2026: 25 · 2025: 20 · 2024: 24 · 2023: 13 · 2022: 16 · 2021: 26 · 2020: 11
- FWCI
- 5.35
- Type
- journal article
- Language
- en
- Update notices
- correction (2020-02-21)
- Open access
- gold
- doi.org
- Locations
- Nature Communications (publishedVersion, cc-by)
- PubMed Central (publishedVersion, cc-by)
- PubMed (publishedVersion)
- RePEc: Research Papers in Economics (submittedVersion)
- DOAJ (DOAJ: Directory of Open Access Journals) (submittedVersion, cc-by-sa)
- DOAJ (DOAJ: Directory of Open Access Journals) (submittedVersion)
- Funders
- Microsoft
- United States Department of Defense | Defense Advanced Research Projects Agency
- Topics
- Physical Sciences › Mathematics › Theoretical Computer Science › DNA and Biological Computing
- Physical Sciences › Computer Science › Computer Networks and Communications › Advanced Data Storage Technologies
- Life Sciences › Biochemistry, Genetics and Molecular Biology › Molecular Biology › Advanced biosensing and bioanalysis techniques
- Keywords
- DNA data storage, synthetic DNA, data archiving, file recovery, data density, sequencing depth, nucleotide sequence
- MeSH terms
- Base Sequence, DNA, Genetic Engineering, Information Science, Information Storage and Retrieval, Gene Dosage, Databases, Nucleic Acid, High-Throughput Nucleotide Sequencing
About these checks
Registry, retraction, Cites and statistics results are computed, not judged, with one exception: a printed reference that no index lists is read once by a model before it counts as a citation error. Claims are extracted by a model and kept only when their quote appears verbatim in the text; each cited source is then checked, with a model’s help, for whether it says what the claim relies on. Those verdicts can be wrong — read the claim’s quote and the cited source before relying on one.
A language model drew the claims from the paper on 2026-10-09, under version 3 of the claim definition (model deepseek-v4.1-flash, prompt extract-v3).
A second model labelled each claim on 2026-10-09 (model jev-1.13-20260917, definition revision gold-guideline-v0.2).
Cited sources are checked with a language model’s help (gpt-6-sol).
Statistics and arithmetic are recomputed, not judged.
Confidence bands are shown only for fields calibrated on our annotated test set. None is calibrated yet, so no band is shown.
What counts as a claim ›How we measure confidence ›How we check this ›
Are you an author, or do you see a problem with this page? Request a review
