Cited by 81

The DOI matches its Crossref record; 5 of the 5 references it cites were found in a registry or an index.

Pan-cancer analysis reveals cooperativity of both strands of microRNA that regulate tumorigenesis and patient survival

Mitra, Ramkrishna, Adams, Clare M., Jiang, Wei, Greenawalt, Evan, Eischen, Christine M.·2020·Nature Communications

Abstract

Recently, both 5p and 3p miRNA strands are being recognized as functional instead of only one, leaving many miRNA strands uninvestigated. To determine whether both miRNA strands, which have different mRNA-targeting sequences, cooperate to regulate pathways/functions across cancer types, we evaluate genomic, epigenetic, and molecular profiles of >5200 patient samples from 14 different cancers, and RNA interference and CRISPR screens in 290 cancer cell lines. We identify concordantly dysregulated miRNA 5p/3p pairs that coordinately modulate oncogenic pathways and/or cell survival/growth across cancers. Down-regulation of both strands of miR-30a and miR-145 recurrently increased cell cycle pathway genes and significantly reduced patient survival in multiple cancers. Forced expression of all four strands show cooperativity, reducing cell cycle pathways and inhibiting lung cancer cell proliferation and migration. Therefore, we identify miRNA whose 5p/3p strands function together to regulate core tumorigenic processes/pathways and reveal a previously unknown pan-cancer miRNA signature with patient prognostic power.

Overview

The claims and statistics of this paper haven’t been checked yet.

Run the check — free, no account needed. It reads the open-access text and checks the sources it cites.

A few free checks a day · papers already verified open instantly · results are public

Integrity signals

Registry

Crossref · 10.1038/s41467-020-14713-2

Cites

5 of 5 references verified0 citation errors · 0 not checkable

Statistics

Figures

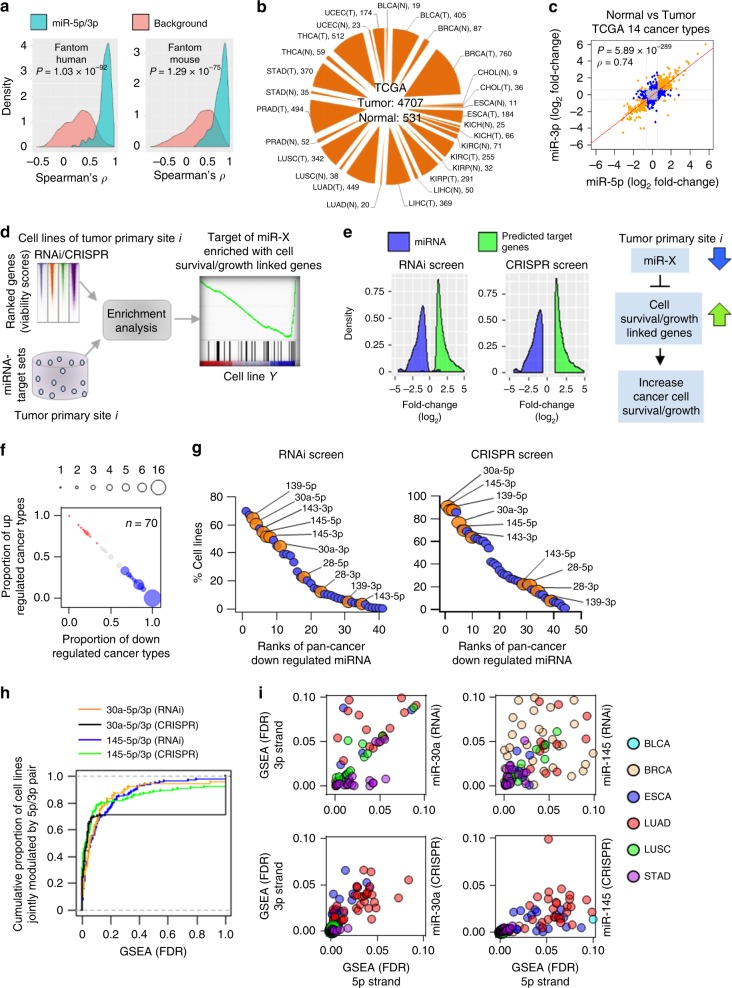
Fig. 1 Associations between miRNA 5p/3p concordant expression changes and cancer cell viability/growth. a Density plots showing distribution of 5p/3p expression correlations (green) compared to the background miRNA pairs (red). P-values determined by two-tailed Wilcoxon rank-sum test. b Number of TCGA normal (N) and tumor (T) samples by cancer type used for analysis. c Scatterplot with regression line, Spearman correlation test score (ρ) and P-value (two-tailed) indicates degree of global concordance observed in expression fold-changes of 5p/3p pairs across 14 cancer types compared with the corresponding normal samples. Each dot represents fold-change of one 5p/3p pair in one cancer type. Significant differential expressions of both, one, and no strands denoted by orange, blue, and gray dots, respectively. d Integrative approach to predict whether individual miRNA target set is enriched with cell survival/growth-associated genes. e Density plots showing distribution of survival/growth-associated miRNA and gene expression changes in the tumor tissues compared with the respective normal tissues. Schematic diagram indicates potential association between miRNA downregulation and induced cell survival/growth. f Pan-cancer (≥5 cancer types) dysregulated miRNA (n = 70) were plotted. Blue and red dots indicate a trend of consistent down and upregulation, respectively, across the cancer types. Gray dots indicate random up- or downregulation. The proportion of down- or upregulations was indicated on the x- and y-axis, respectively. Size of individual dots correlates with number of miRNA. g List of miRNA (blue and orange circles) that were predicted to be associated with cancer cell viability/growth from RNAi or CRISPR screening data. y-axis indicates percentage of the cell lines with which these miRNA had association. Orange dots represent the 5p and 3p strands of a miRNA that both modulate cancer cell survival/growth. h Empirical cumulative distribution of cell lines (y-axis) whose survival/growth might be coordinately regulated by the indicated miRNA 5p/3p pairs, as determined by the GSEA with 10% FDR (x-axis). i Distribution of cancer cells of indicated cancer type whose survival/growth may be regulated by both miR-30a-5p and 3p (left) or both miR-145-5p and 3p (right) as determined from RNAi (top) and CRISPR (bottom) screening data. Dots represent cancer cell lines.
Fig. 1 Associations between miRNA 5p/3p concordant expression changes and cancer cell viability/growth. a Density plots showing distribution of 5p/3p expression correlations (green) compared to the background miRNA pairs (red). P-values determined by two-tailed Wilcoxon rank-sum test. b Number of TCGA normal (N) and tumor (T) samples by cancer type used for analysis. c Scatterplot with regression line, Spearman correlation test score (ρ) and P-value (two-tailed) indicates degree of global concordance observed in expression fold-changes of 5p/3p pairs across 14 cancer types compared with the corresponding normal samples. Each dot represents fold-change of one 5p/3p pair in one cancer type. Significant differential expressions of both, one, and no strands denoted by orange, blue, and gray dots, respectively. d Integrative approach to predict whether individual miRNA target set is enriched with cell survival/growth-associated genes. e Density plots showing distribution of survival/growth-associated miRNA and gene expression changes in the tumor tissues compared with the respective normal tissues. Schematic diagram indicates potential association between miRNA downregulation and induced cell survival/growth. f Pan-cancer (≥5 cancer types) dysregulated miRNA (n = 70) were plotted. Blue and red dots indicate a trend of consistent down and upregulation, respectively, across the cancer types. Gray dots indicate random up- or downregulation. The proportion of down- or upregulations was indicated on the x- and y-axis, respectively. Size of individual dots correlates with number of miRNA. g List of miRNA (blue and orange circles) that were predicted to be associated with cancer cell viability/growth from RNAi or CRISPR screening data. y-axis indicates percentage of the cell lines with which these miRNA had association. Orange dots represent the 5p and 3p strands of a miRNA that both modulate cancer cell survival/growth. h Empirical cumulative distribution of cell lines (y-axis) whose survival/growth might be coordinately regulated by the indicated miRNA 5p/3p pairs, as determined by the GSEA with 10% FDR (x-axis). i Distribution of cancer cells of indicated cancer type whose survival/growth may be regulated by both miR-30a-5p and 3p (left) or both miR-145-5p and 3p (right) as determined from RNAi (top) and CRISPR (bottom) screening data. Dots represent cancer cell lines.CC BY · PubMed Central
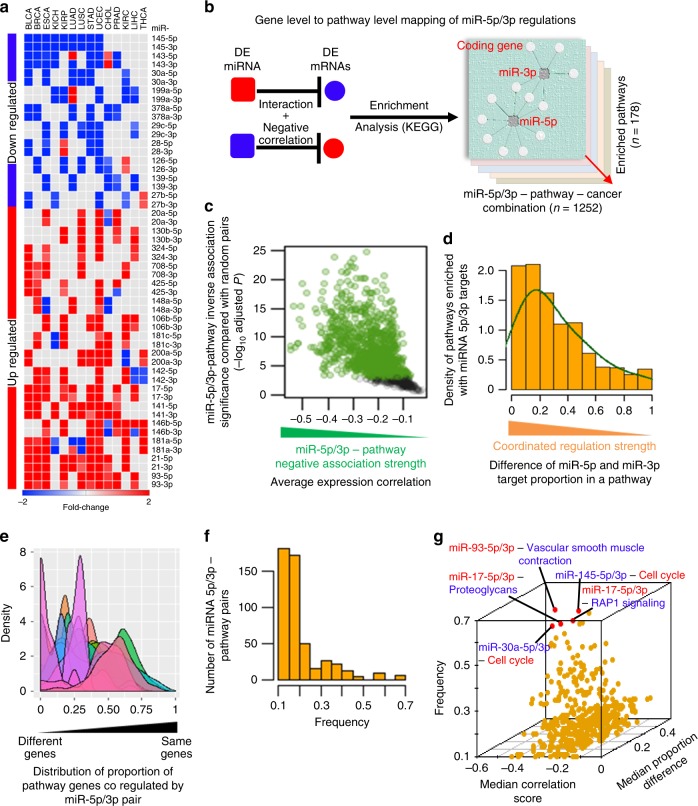
Fig. 2 Identifying pan-cancer dysregulated miRNA 5p/3p pairs and their recurrent associations with oncogenic pathways across cancer types. a Heat map represents pan-cancer dysregulated 5p/3p pairs. Cancer types with red or blue color represent significant up- or downregulation, respectively, of the indicated mature miRNA. b Overview of approach used to identify miRNA 5p/3p regulated KEGG pathways in cancer. c, d Determining high-confidence 5p/3p pair–pathway associations based on whether c they had strong (green dots) inverse associations (x-axis) or not (black dots) comparing with the random pairs (y-axis); each dot represents one miRNA-pathway pair, and d the pathway genes were coordinately regulated by the 5p/3p pair. e Determining which 5p/3p pairs coordinately regulate pathways with a trend of co-targeting the same genes (x-axis, toward 1) or different genes (x-axis, toward 0) in the same pathway. Each density curve represents one 5p/3p pair and its potentially regulated pathways across cancer types. f Determination of pathways that were recurrently regulated by miRNA 5p/3p pairs across the cancer types. x-axis denotes frequency (number of cancer types with 5p/3p–pathway association divided by the number of cancer types the regulating 5p/3p pair had concordant dysregulation). g Three-dimensional scatter plot summarizes inversely associated (x-axis), coordinately regulated (y-axis) 5p/3p–pathway pairs that recurrently (z-axis) associated with cancer types where the corresponding regulating 5p/3p pairs had concordant dysregulation. Top five associations are indicated (red dots); red and blue words denotes up- and downregulation in cancer, respectively, compared to normal samples.
Fig. 2 Identifying pan-cancer dysregulated miRNA 5p/3p pairs and their recurrent associations with oncogenic pathways across cancer types. a Heat map represents pan-cancer dysregulated 5p/3p pairs. Cancer types with red or blue color represent significant up- or downregulation, respectively, of the indicated mature miRNA. b Overview of approach used to identify miRNA 5p/3p regulated KEGG pathways in cancer. c, d Determining high-confidence 5p/3p pair–pathway associations based on whether c they had strong (green dots) inverse associations (x-axis) or not (black dots) comparing with the random pairs (y-axis); each dot represents one miRNA-pathway pair, and d the pathway genes were coordinately regulated by the 5p/3p pair. e Determining which 5p/3p pairs coordinately regulate pathways with a trend of co-targeting the same genes (x-axis, toward 1) or different genes (x-axis, toward 0) in the same pathway. Each density curve represents one 5p/3p pair and its potentially regulated pathways across cancer types. f Determination of pathways that were recurrently regulated by miRNA 5p/3p pairs across the cancer types. x-axis denotes frequency (number of cancer types with 5p/3p–pathway association divided by the number of cancer types the regulating 5p/3p pair had concordant dysregulation). g Three-dimensional scatter plot summarizes inversely associated (x-axis), coordinately regulated (y-axis) 5p/3p–pathway pairs that recurrently (z-axis) associated with cancer types where the corresponding regulating 5p/3p pairs had concordant dysregulation. Top five associations are indicated (red dots); red and blue words denotes up- and downregulation in cancer, respectively, compared to normal samples.CC BY · PubMed Central
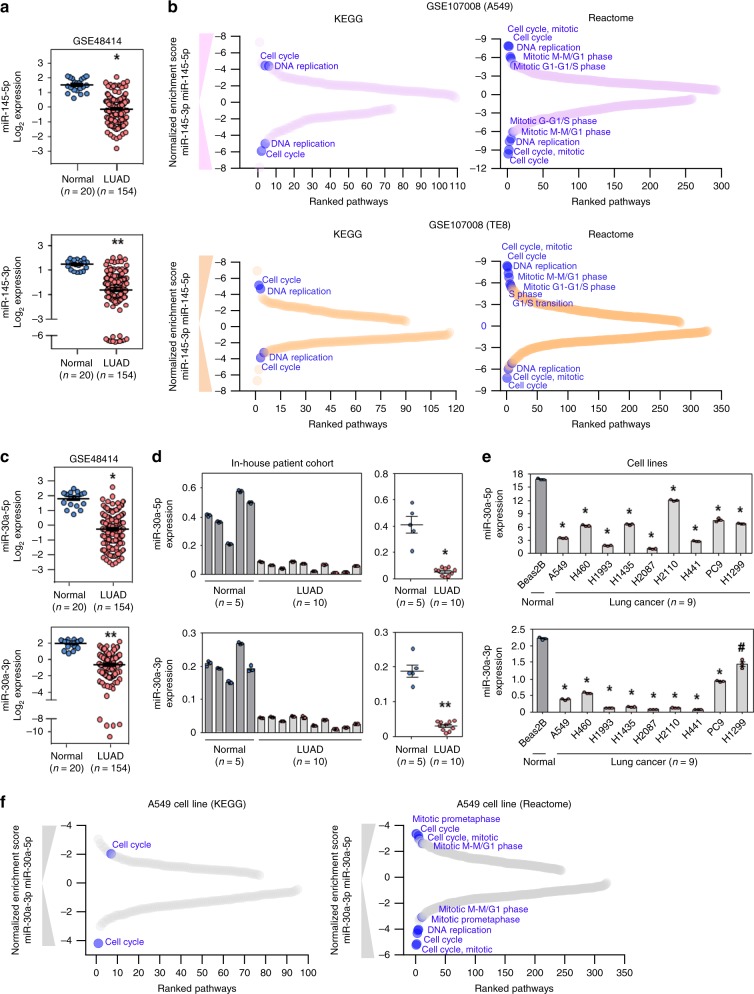
Fig. 3 Individual strands of miR-145 and miR-30a independently modulate cell cycle-associated pathways. a, c Microarray to measure expression differences of miR-145-5p (*P = 2.52 × 10⁻¹⁶; a top), miR-145-3p (**P = 2.64 × 10⁻²¹; a bottom), miR-30a-5p (*P = 1.0 × 10⁻¹⁹; c top), and miR-30a-3p (**P = 7.08 × 10⁻²⁵; c bottom) in an independent cohort of lung adenocarcinoma patient samples (n = 154) compared to normal (n = 20) lung tissue; two-tailed t-tests. b, f GSEA demonstrated downregulated pathways in miR-145-5p or miR-145-3p transfected A549 cells (b top) or TE8 cells (b bottom), and miR-30a-5p or miR-30a-3p transfected A549 cells (f), compared to the control cell line. Pathways were ranked (x-axis) on the basis of negative normalized enrichment scores (y-axis). Cell cycle-associated pathways that are within the top ten pathway list, are indicated and were significantly enriched (FDR < 0.05). d qRT-PCR (in triplicate) for miR-30a-5p (top) and miR-30a-3p (bottom) expression in patient samples of lung adenocarcinoma and normal lung tissue. Individual samples (left) and mean expression (right) shown; *P = 1.98 × 10⁻⁶, **P = 2.60 × 10⁻⁸, two-tailed t-tests. e qRT-PCR (in triplicate) for miR-30a-5p (top) and miR-30a-3p (bottom) levels in lung adenocarcinoma lines and a normal bronchial epithelial line; #P = 6.62 × 10⁻⁴, *P < 6.05 × 10⁻⁶, two-tailed t-tests. For qRT-PCR (d and e), miRNA expression was normalized to endogenous small RNA RNU6B and presented as 2−∆Ct. Data are presented as mean values ± SEM in a and c–e. Source data are provided as a Source Data file.
Fig. 3 Individual strands of miR-145 and miR-30a independently modulate cell cycle-associated pathways. a, c Microarray to measure expression differences of miR-145-5p (*P = 2.52 × 10⁻¹⁶; a top), miR-145-3p (**P = 2.64 × 10⁻²¹; a bottom), miR-30a-5p (*P = 1.0 × 10⁻¹⁹; c top), and miR-30a-3p (**P = 7.08 × 10⁻²⁵; c bottom) in an independent cohort of lung adenocarcinoma patient samples (n = 154) compared to normal (n = 20) lung tissue; two-tailed t-tests. b, f GSEA demonstrated downregulated pathways in miR-145-5p or miR-145-3p transfected A549 cells (b top) or TE8 cells (b bottom), and miR-30a-5p or miR-30a-3p transfected A549 cells (f), compared to the control cell line. Pathways were ranked (x-axis) on the basis of negative normalized enrichment scores (y-axis). Cell cycle-associated pathways that are within the top ten pathway list, are indicated and were significantly enriched (FDR < 0.05). d qRT-PCR (in triplicate) for miR-30a-5p (top) and miR-30a-3p (bottom) expression in patient samples of lung adenocarcinoma and normal lung tissue. Individual samples (left) and mean expression (right) shown; *P = 1.98 × 10⁻⁶, **P = 2.60 × 10⁻⁸, two-tailed t-tests. e qRT-PCR (in triplicate) for miR-30a-5p (top) and miR-30a-3p (bottom) levels in lung adenocarcinoma lines and a normal bronchial epithelial line; #P = 6.62 × 10⁻⁴, *P < 6.05 × 10⁻⁶, two-tailed t-tests. For qRT-PCR (d and e), miRNA expression was normalized to endogenous small RNA RNU6B and presented as 2−∆Ct. Data are presented as mean values ± SEM in a and c–e. Source data are provided as a Source Data file.CC BY · PubMed Central
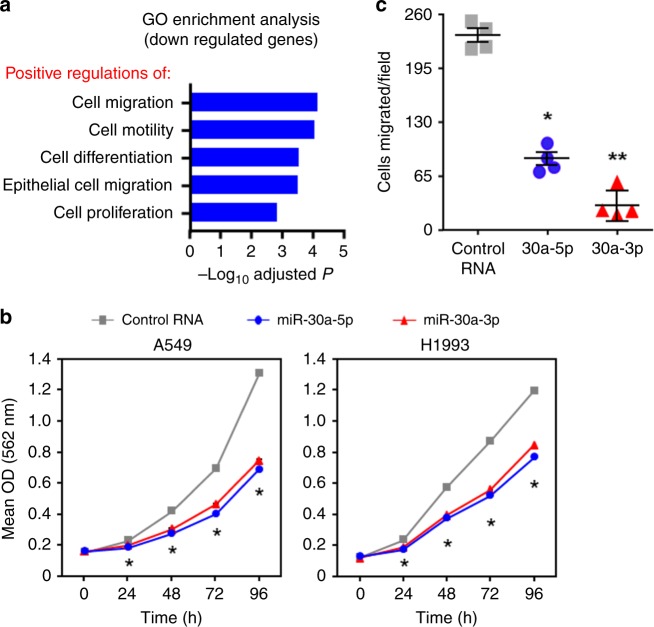
Fig. 4 Increased levels of miR-30a-5p and miR-30a-3p decreased lung cancer cell growth and migration. a Gene Ontology enrichment analysis based on genes that were significantly downregulated by either miR-30a-5p or miR-30a-3p determined from our RNA-seq data (GSE142695). Biological processes that were significantly enriched with downregulated genes are indicated. b Lung adenocarcinoma lines were transfected with 100 nM miR-30a-5p mimic, miR-30a-3p mimic, or a negative control RNA. MTT assays were performed at the indicated intervals in quadruplicate. Each assay was performed at least four independent times for both cell lines; a representative experiment is shown. For A549, *P < 2.43 × 10⁻³; for H1993, *P < 2.91 × 10⁻⁶; two-tailed t-tests (comparing 5p or 3p mimic to control RNA); error bars are within the symbols. c A549 cells transfected with miR-30a-5p mimic, miR-30a-3p mimic, or control RNA and transwell migration assays performed. Results from one representative experiment from two independent experiments performed is shown; *P = 1.11 × 10⁻⁵, **P = 3.15 × 10⁻⁶, two-tailed t-tests (comparing 5p or 3p mimic to control RNA, respectively). Data are presented as mean values ± SEM in b and c. Source data are provided as a Source Data file.
Fig. 4 Increased levels of miR-30a-5p and miR-30a-3p decreased lung cancer cell growth and migration. a Gene Ontology enrichment analysis based on genes that were significantly downregulated by either miR-30a-5p or miR-30a-3p determined from our RNA-seq data (GSE142695). Biological processes that were significantly enriched with downregulated genes are indicated. b Lung adenocarcinoma lines were transfected with 100 nM miR-30a-5p mimic, miR-30a-3p mimic, or a negative control RNA. MTT assays were performed at the indicated intervals in quadruplicate. Each assay was performed at least four independent times for both cell lines; a representative experiment is shown. For A549, *P < 2.43 × 10⁻³; for H1993, *P < 2.91 × 10⁻⁶; two-tailed t-tests (comparing 5p or 3p mimic to control RNA); error bars are within the symbols. c A549 cells transfected with miR-30a-5p mimic, miR-30a-3p mimic, or control RNA and transwell migration assays performed. Results from one representative experiment from two independent experiments performed is shown; *P = 1.11 × 10⁻⁵, **P = 3.15 × 10⁻⁶, two-tailed t-tests (comparing 5p or 3p mimic to control RNA, respectively). Data are presented as mean values ± SEM in b and c. Source data are provided as a Source Data file.CC BY · PubMed Central
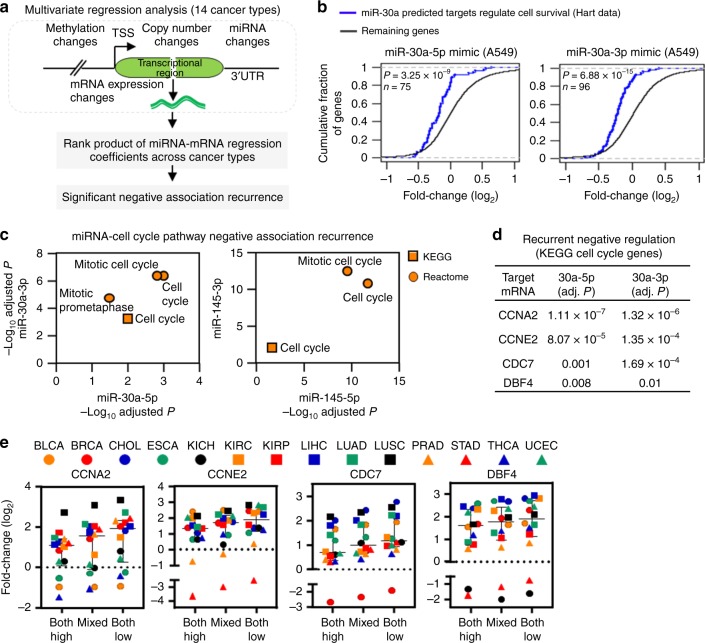
Fig. 5 Cooperative effects of miRNA 5p/3p-mediated gene regulation in cancer cell proliferation and movement. a Identifying miR-30a and miR-145 5p/3p-mediated gene expression changes across 14 cancer types. A linear regression function was modeled to predict miRNA–mRNA association after controlling for the impact of DNA methylation and gene copy number changes. The rank product statistic was employed to aggregate the miRNA–mRNA regression coefficients across the 14 cancer types and predict significant miRNA–mRNA-negative association recurrence (BH adjusted P < 0.05). b Expression changes of miRNA-target essential genes after transfection of the miR-30-5p or 3p mimics in A549 lung adenocarcinoma cells (the miRNA perturbation profile from our RNA-seq data, GSE142695). The miRNA-essential gene pairs were obtained from regression analysis in TCGA LUAD. Indicated P-values were determined from two-tailed Kolmogorov–Smironov test. n denotes number of predicted target essential genes of the corresponding miRNA. We extracted a common essential gene list from the Hart laboratory (http://hart-lab.org/). c Pathway enrichment analysis to determine pathways that are enriched with recurrently associated genes of the corresponding regulating miRNA indicated on the x- and y-axis. d Recurrent association strength of four cell cycle pathway-associated genes with predicted binding sites for both miR-30a-5p and miR-30a-3p. Adj. P denotes BH adjusted P-value derived from rank product test statistic. e Fold-change (log2) of the expression of the four genes in the indicated sample categories across the 14 cancer types. High or low: Samples with higher or lower expression of both miR-30a-5p and 3p. Mixed: Remaining samples. Data are presented as median with interquartile range. Source data are provided as a Source Data file.
Fig. 5 Cooperative effects of miRNA 5p/3p-mediated gene regulation in cancer cell proliferation and movement. a Identifying miR-30a and miR-145 5p/3p-mediated gene expression changes across 14 cancer types. A linear regression function was modeled to predict miRNA–mRNA association after controlling for the impact of DNA methylation and gene copy number changes. The rank product statistic was employed to aggregate the miRNA–mRNA regression coefficients across the 14 cancer types and predict significant miRNA–mRNA-negative association recurrence (BH adjusted P < 0.05). b Expression changes of miRNA-target essential genes after transfection of the miR-30-5p or 3p mimics in A549 lung adenocarcinoma cells (the miRNA perturbation profile from our RNA-seq data, GSE142695). The miRNA-essential gene pairs were obtained from regression analysis in TCGA LUAD. Indicated P-values were determined from two-tailed Kolmogorov–Smironov test. n denotes number of predicted target essential genes of the corresponding miRNA. We extracted a common essential gene list from the Hart laboratory (http://hart-lab.org/). c Pathway enrichment analysis to determine pathways that are enriched with recurrently associated genes of the corresponding regulating miRNA indicated on the x- and y-axis. d Recurrent association strength of four cell cycle pathway-associated genes with predicted binding sites for both miR-30a-5p and miR-30a-3p. Adj. P denotes BH adjusted P-value derived from rank product test statistic. e Fold-change (log2) of the expression of the four genes in the indicated sample categories across the 14 cancer types. High or low: Samples with higher or lower expression of both miR-30a-5p and 3p. Mixed: Remaining samples. Data are presented as median with interquartile range. Source data are provided as a Source Data file.CC BY · PubMed Central
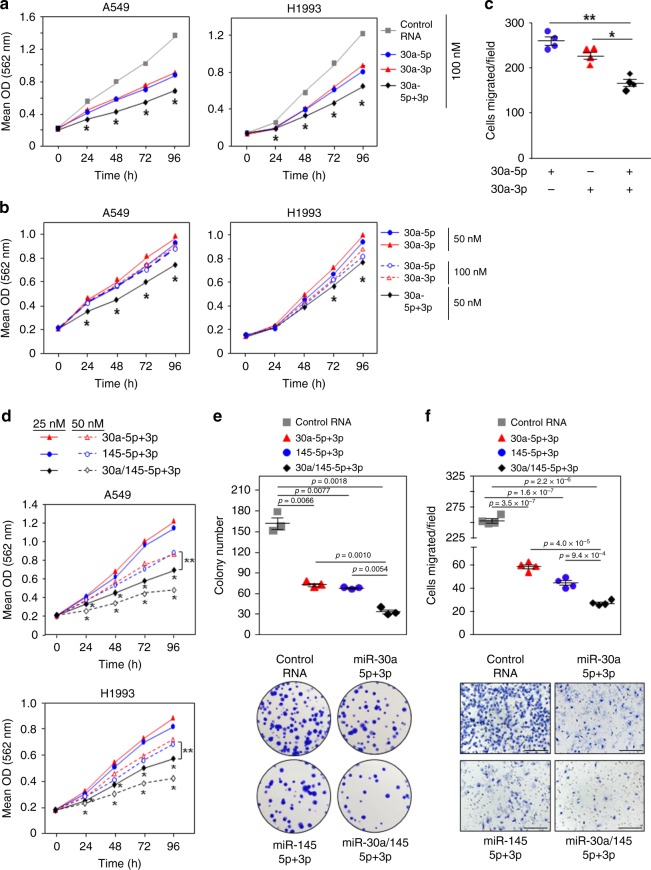
Fig. 6 Cooperation of all four strands of miR-30a and miR-145 in cancer cell growth and movement. Lung adenocarcinoma lines transfected with miR-30a-5p, miR-30a-3p, miR-145-5p, and/or miR-145-3p miRNA mimic, or control RNA at the indicated concentrations. Control RNA was also added to equalize the total amount of RNA transfected. a, b, d MTT assays performed at intervals, in quadruplicate. Each assay was performed 2–4 independent times for both cell lines and one representative experiment is shown. For a, A549 *P < 6.18 × 10⁻⁵, H1993 *P < 2.36 × 10⁻² (comparing 5p + 3p to 5p or 3p alone); for b, A549 *P < 9.21 × 10⁻⁶, H1993 *P < 1.91 × 10⁻² (comparing 5p + 3p to 5p or 3p alone at both concentrations); for d, A549 *P < 1.69 × 10⁻⁴ and **P < 7.02 × 10⁻⁵, H1993 *P < 4.27 × 10⁻⁴ and **P < 2.82 × 10⁻³ (*, comparing 30a-5p/3p+145-5p/3p to 30a-5p/3p or 145-5p/3p at both concentrations and **, comparing 25 nM 30a-5p/3p+145-5p/3p to 50 nM 30a-5p/3p or 145-5p/3p); two-tailed t-tests. c, f Transwell migration assays were performed 2 (c) or 4 (f) independent times and results from one representative experiment are shown for each. For c, *P = 2.3 × 10⁻³ and **P = 2.0 × 10⁻⁴; for f, P-values indicated; two-tailed t-tests. Representative images shown in f (x10 magnification; scale bars, 200 μm). e Colony formation assays were performed two independent times, in triplicate, and a representative experiment and images (no magnification) are shown. P-values indicated; two-tailed t-tests. Data are presented as mean values ± SEM; error bars are within the symbols in a, b, and d. Source data are provided as a Source Data file.
Fig. 6 Cooperation of all four strands of miR-30a and miR-145 in cancer cell growth and movement. Lung adenocarcinoma lines transfected with miR-30a-5p, miR-30a-3p, miR-145-5p, and/or miR-145-3p miRNA mimic, or control RNA at the indicated concentrations. Control RNA was also added to equalize the total amount of RNA transfected. a, b, d MTT assays performed at intervals, in quadruplicate. Each assay was performed 2–4 independent times for both cell lines and one representative experiment is shown. For a, A549 *P < 6.18 × 10⁻⁵, H1993 *P < 2.36 × 10⁻² (comparing 5p + 3p to 5p or 3p alone); for b, A549 *P < 9.21 × 10⁻⁶, H1993 *P < 1.91 × 10⁻² (comparing 5p + 3p to 5p or 3p alone at both concentrations); for d, A549 *P < 1.69 × 10⁻⁴ and **P < 7.02 × 10⁻⁵, H1993 *P < 4.27 × 10⁻⁴ and **P < 2.82 × 10⁻³ (*, comparing 30a-5p/3p+145-5p/3p to 30a-5p/3p or 145-5p/3p at both concentrations and **, comparing 25 nM 30a-5p/3p+145-5p/3p to 50 nM 30a-5p/3p or 145-5p/3p); two-tailed t-tests. c, f Transwell migration assays were performed 2 (c) or 4 (f) independent times and results from one representative experiment are shown for each. For c, *P = 2.3 × 10⁻³ and **P = 2.0 × 10⁻⁴; for f, P-values indicated; two-tailed t-tests. Representative images shown in f (x10 magnification; scale bars, 200 μm). e Colony formation assays were performed two independent times, in triplicate, and a representative experiment and images (no magnification) are shown. P-values indicated; two-tailed t-tests. Data are presented as mean values ± SEM; error bars are within the symbols in a, b, and d. Source data are provided as a Source Data file.CC BY · PubMed Central
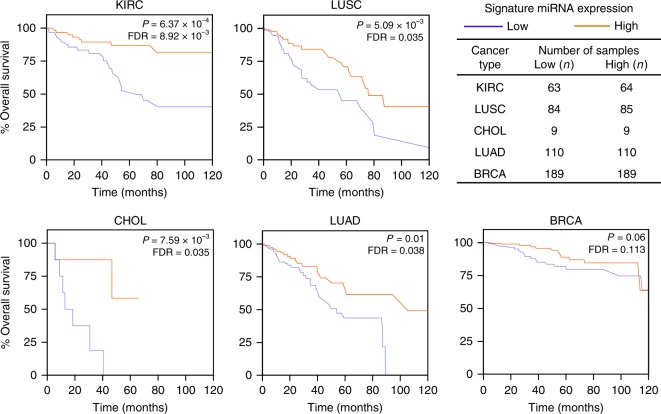
Fig. 7 A four-miRNA expression signature correlates with patient overall survival across diverse cancer types. Kaplan–Meier plots of overall survival according to a survival predictor based on the average expression of miR-145-5p, miR-145-3p, miR-30a-5p, and miR-30a-3p. For each cancer type, patient samples were ranked according to the average expression of the four miRNA and divided into four quartiles. Lowest (blue lines) and highest (orange lines) quartile groups were used for Kaplan–Meier survival analyses; statistical significance was measured using log-rank test. False-discovery rate (FDR) values were determined.
Fig. 7 A four-miRNA expression signature correlates with patient overall survival across diverse cancer types. Kaplan–Meier plots of overall survival according to a survival predictor based on the average expression of miR-145-5p, miR-145-3p, miR-30a-5p, and miR-30a-3p. For each cancer type, patient samples were ranked according to the average expression of the four miRNA and divided into four quartiles. Lowest (blue lines) and highest (orange lines) quartile groups were used for Kaplan–Meier survival analyses; statistical significance was measured using log-rank test. False-discovery rate (FDR) values were determined.CC BY · PubMed Central

Verification

Claims the paper makes

The claims and statistics of this paper haven’t been checked yet.

Run the check — free, no account needed. It reads the open-access text and checks the sources it cites.

A few free checks a day · papers already verified open instantly · results are public

Claims other papers make about this one

Each is checked against this paper’s own text: does it say what the citing paper says it does?

Self-check

Percentages, sums and reported differences re-computed from the paper’s own numbers.

The self-check needs the paper’s full text.

Citations

Cites

Research works printed but not linked: 53

  1. Drusco, A. & Croce, C. M. MicroRNAs and cancer: a long story for short RNAs. Adv. Cancer Res. 135, 1–24 (2017). · DOI
  2. Alles, J. et al. An estimate of the total number of true human miRNAs. Nucleic Acids Res. 47, 3353–3364 (2019). · DOI · Paper page
  3. Kozomara, A. & Griffiths-Jones, S. miRBase: annotating high confidence microRNAs using deep sequencing data. Nucleic Acids Res. 42, D68–D73 (2014). · DOI · Paper page
  4. Kozomara, A., Birgaoanu, M. & Griffiths-Jones, S. miRBase: from microRNA sequences to function. Nucleic Acids Res. 47, D155–D162 (2019). · DOI · Paper page
  5. Mitra, R., Lin, C. C., Eischen, C. M., Bandyopadhyay, S. & Zhao, Z. Concordant dysregulation of miR-5p and miR-3p arms of the same precursor microRNA may be a mechanism in inducing cell proliferation and tumorigenesis: a lung cancer study. RNA 21, 1055–1065 (2015). · DOI
  6. Mitra, R., Sun, J. & Zhao, Z. microRNA regulation in cancer: One arm or two arms? Int J. Cancer 137, 1516–1518 (2015). · DOI
  7. Jacobsen, A. et al. Analysis of microRNA-target interactions across diverse cancer types. Nat. Struct. Mol. Biol. 20, 1325–1332 (2013). · DOI
  8. Wu, X. L. et al. MicroRNA-143 suppresses gastric cancer cell growth and induces apoptosis by targeting COX-2. World J. Gastroenterol. 19, 7758–7765 (2013). · DOI
  9. Fornari, F. et al. MiR-199a-3p regulates mTOR and c-Met to influence the doxorubicin sensitivity of human hepatocarcinoma cells. Cancer Res. 70, 5184–5193 (2010). · DOI
  10. Lin, M. H. et al. Comprehensive identification of microRNA arm selection preference in lung cancer: miR-324-5p and -3p serve oncogenic functions in lung cancer. Oncol. Lett. 15, 9818–9826 (2018).
  11. Tsang, F. H. et al. MicroRNA-142-3p and microRNA-142-5p are downregulated in hepatocellular carcinoma and exhibit synergistic effects on cell motility. Front. Med. 9, 331–343 (2015). · DOI
  12. Qin, D. et al. MicroRNA-223-5p and -3p cooperatively suppress necroptosis in ischemic/reperfused hearts. J. Biol. Chem. 291, 20247–20259 (2016). · DOI
  13. Uchino, K. et al. Therapeutic effects of microRNA-582-5p and -3p on the inhibition of bladder cancer progression. Mol. Ther. 21, 610–619 (2013). · DOI
  14. Almeida, M. I. et al. Strand-specific miR-28-5p and miR-28-3p have distinct effects in colorectal cancer cells. Gastroenterology 142, 886–896 e889 (2012). · DOI · Paper page
  15. Chang, K. W. et al. Passenger strand miRNA miR-31* regulates the phenotypes of oral cancer cells by targeting RhoA. Oral. Oncol. 49, 27–33 (2013). · DOI
  16. Shan, S. W. et al. Mature miR-17-5p and passenger miR-17-3p induce hepatocellular carcinoma by targeting PTEN, GalNT7 and vimentin in different signal pathways. J. Cell Sci. 126, 1517–1530 (2013). · DOI
  17. Yang, X. et al. Both mature miR-17-5p and passenger strand miR-17-3p target TIMP3 and induce prostate tumor growth and invasion. Nucleic Acids Res. 41, 9688–9704 (2013). · DOI
  18. Zhang, Z. et al. microRNA arm-imbalance in part from complementary targets mediated decay promotes gastric cancer progression. Nat. Commun. 10, 4397 (2019). · DOI · Paper page
  19. Hamilton, M. P. et al. Identification of a pan-cancer oncogenic microRNA superfamily anchored by a central core seed motif. Nat. Commun. 4, 2730 (2013). · DOI
  20. Benjamini, Y. & Hochberg, Y. Controlling the false discovery rate-a practical and powerful approach to multiple testing. J. R. Stat. Soc. Ser. B-Methodol. 57, 289–300 (1995). · DOI · Paper page
  21. Tsherniak, A. et al. Defining a cancer dependency map. Cell 170, 564–576 e516 (2017). · DOI · Paper page
  22. McFarland, J. M. et al. Improved estimation of cancer dependencies from large-scale RNAi screens using model-based normalization and data integration. Nat. Commun. 9, 4610 (2018). · DOI
  23. Meyers, R. M. et al. Computational correction of copy number effect improves specificity of CRISPR-Cas9 essentiality screens in cancer cells. Nat. Genet. 49, 1779–1784 (2017). · DOI · Paper page
  24. Zhang, B., Kirov, S. & Snoddy, J. WebGestalt: an integrated system for exploring gene sets in various biological contexts. Nucleic Acids Res. 33, W741–W748 (2005). · DOI
  25. Kanehisa, M. & Goto, S. KEGG: kyoto encyclopedia of genes and genomes. Nucleic Acids Res. 28, 27–30 (2000). · DOI · Paper page
  26. Westermarck, J. & Kahari, V. M. Regulation of matrix metalloproteinase expression in tumor invasion. FASEB J. 13, 781–792 (1999). · DOI
  27. Page-McCaw, A., Ewald, A. J. & Werb, Z. Matrix metalloproteinases and the regulation of tissue remodelling. Nat. Rev. Mol. Cell Biol. 8, 221–233 (2007). · DOI · Paper page
  28. Garbicz, F. et al. Increased expression of the microRNA 106b~25 cluster and its host gene MCM7 in corticotroph pituitary adenomas is associated with tumor invasion and Crooke’s cell morphology. Pituitary 20, 450–463 (2017). · DOI
  29. Bjaanaes, M. M. et al. Unique microRNA-profiles in EGFR-mutated lung adenocarcinomas. Int J. Cancer 135, 1812–1821 (2014). · DOI
  30. Barrett, T. & Edgar, R. Gene expression omnibus: microarray data storage, submission, retrieval, and analysis. Methods Enzymol. 411, 352–369 (2006). · DOI
  31. Fabregat, A. et al. The reactome pathway knowledgebase. Nucleic Acids Res. 46, D649–D655 (2018). · DOI
  32. Barbie, D. A. et al. Systematic RNA interference reveals that oncogenic KRAS-driven cancers require TBK1. Nature 462, 108–112 (2009). · DOI
  33. Misono, S. et al. Dual strands of the miR-145 duplex (miR-145-5p and miR-145-3p) regulate oncogenes in lung adenocarcinoma pathogenesis. J. Hum. Genet. 63, 1015–1028 (2018). · DOI
  34. Mataki, H. et al. Dual-strand tumor-suppressor microRNA-145 (miR-145-5p and miR-145-3p) coordinately targeted MTDH in lung squamous cell carcinoma. Oncotarget 7, 72084–72098 (2016). · DOI
  35. Matsushita, R. et al. Regulation of UHRF1 by dual-strand tumor-suppressor microRNA-145 (miR-145-5p and miR-145-3p): Inhibition of bladder cancer cell aggressiveness. Oncotarget 7, 28460–28487 (2016). · DOI
  36. Yuan, Y. et al. Overexpression of miR-30a in lung adenocarcinoma A549 cell line inhibits migration and invasion via targeting EYA2. Acta Biochim. Biophys. Sin. (Shanghai) 48, 220–228 (2016). · DOI
  37. Hart, T. et al. High-resolution CRISPR screens reveal fitness genes and genotype-specific cancer liabilities. Cell 163, 1515–1526 (2015). · DOI · Paper page
  38. Del Carratore, F. et al. RankProd 2.0: a refactored bioconductor package for detecting differentially expressed features in molecular profiling datasets. Bioinformatics 33, 2774–2775 (2017). · DOI
  39. Breitling, R., Armengaud, P., Amtmann, A. & Herzyk, P. Rank products: a simple, yet powerful, new method to detect differentially regulated genes in replicated microarray experiments. FEBS Lett. 573, 83–92 (2004). · DOI
  40. Shaffer, A. L. et al. Signatures of the immune response. Immunity 15, 375–385 (2001). · DOI
  41. Liu, S. S. et al. Oncogenic microRNA signature for early diagnosis of cervical intraepithelial neoplasia and cancer. Mol. Oncol. 12, 2009–2022 (2018). · DOI
  42. Mitra, R. et al. Reproducible combinatorial regulatory networks elucidate novel oncogenic microRNAs in non-small cell lung cancer. RNA 20, 1356–1368 (2014). · DOI
  43. Mitra, R. et al. Decoding critical long non-coding RNA in ovarian cancer epithelial-to-mesenchymal transition. Nat. Commun. 8, 1604 (2017). · DOI
  44. Jia, D., Jolly, M. K., Kulkarni, P. & Levine, H. Phenotypic plasticity and cell fate decisions in cancer: insights from dynamical systems theory. Cancers (Basel) 9, pii: E70 (2017). · DOI
  45. Lim, E. L. et al. Comprehensive miRNA sequence analysis reveals survival differences in diffuse large B-cell lymphoma patients. Genome Biol. 16, 18 (2015). · DOI
  46. Robinson, M. D., McCarthy, D. J. & Smyth, G. K. edgeR: a Bioconductor package for differential expression analysis of digital gene expression data. Bioinformatics 26, 139–140 (2010). · DOI · Paper page
  47. Mestdagh, P. et al. A novel and universal method for microRNA RT-qPCR data normalization. Genome Biol. 10, R64 (2009). · DOI · Paper page
  48. Agarwal V., Bell G. W., Nam J. W. & Bartel D. P. Predicting effective microRNA target sites in mammalian mRNAs. Elife 4, e05005 (2015). · DOI · Paper page
  49. Bandyopadhyay, S. & Mitra, R. TargetMiner: microRNA target prediction with systematic identification of tissue-specific negative examples. Bioinformatics 25, 2625–2631 (2009). · DOI
  50. Chou, C. H. et al. miRTarBase update 2018: a resource for experimentally validated microRNA-target interactions. Nucleic Acids Res. 46, D296–D302 (2018). · DOI
  51. Dobin, A. et al. STAR: ultrafast universal RNA-seq aligner. Bioinformatics 59, 15–21 (2013). · DOI · Paper page
  52. Anders, S., Pyl, P. T. & Huber, W. HTSeq—a Python framework to work with high-throughput sequencing data. Bioinformatics 31, 166–169 (2015). · DOI · Paper page
  53. Greenawalt, E. J. et al. Targeting of SGK1 by miR-576-3p inhibits lung adenocarcinoma migration and invasion. Mol. Cancer Res. 17, 289–298 (2019). · DOI

Cited by

Sorted by citations

See all 81

Metadata

Authors
Mitra, R., Adams, C. M., Jiang, W., Greenawalt, E., & Eischen, C. M.
Venue
Nature Communications
Published
2020-02-20
Volume
11
Issue
1
ISSN
2041-1723
Cited by
81
References
5
Language
en
Funders
U.S. Department of Health & Human Services | NIH | National Cancer Institute (R01CA177786, P30CA056036)

About these checks

Registry, retraction, Cites and statistics results are computed, not judged, with one exception: a printed reference that no index lists is read once by a model before it counts as a citation error. Claims are extracted by a model and kept only when their quote appears verbatim in the text; each cited source is then checked, with a model’s help, for whether it says what the claim relies on. Those verdicts can be wrong — read the claim’s quote and the cited source before relying on one.

Statistics and arithmetic are recomputed, not judged.

Confidence bands are shown only for fields calibrated on our annotated test set. None is calibrated yet, so no band is shown.

What counts as a claim ›How we measure confidence ›How we check this ›

Are you an author, or do you see a problem with this page? Request a review