

The DOI matches its Crossref record; 72 of the 72 references it cites were found in a registry or an index.
Exercise enhances skeletal muscle regeneration by promoting senescence in fibro-adipogenic progenitors
Open accessAbstract
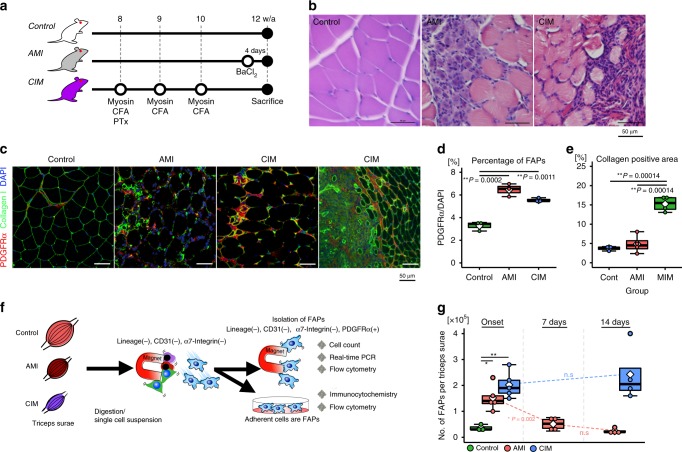
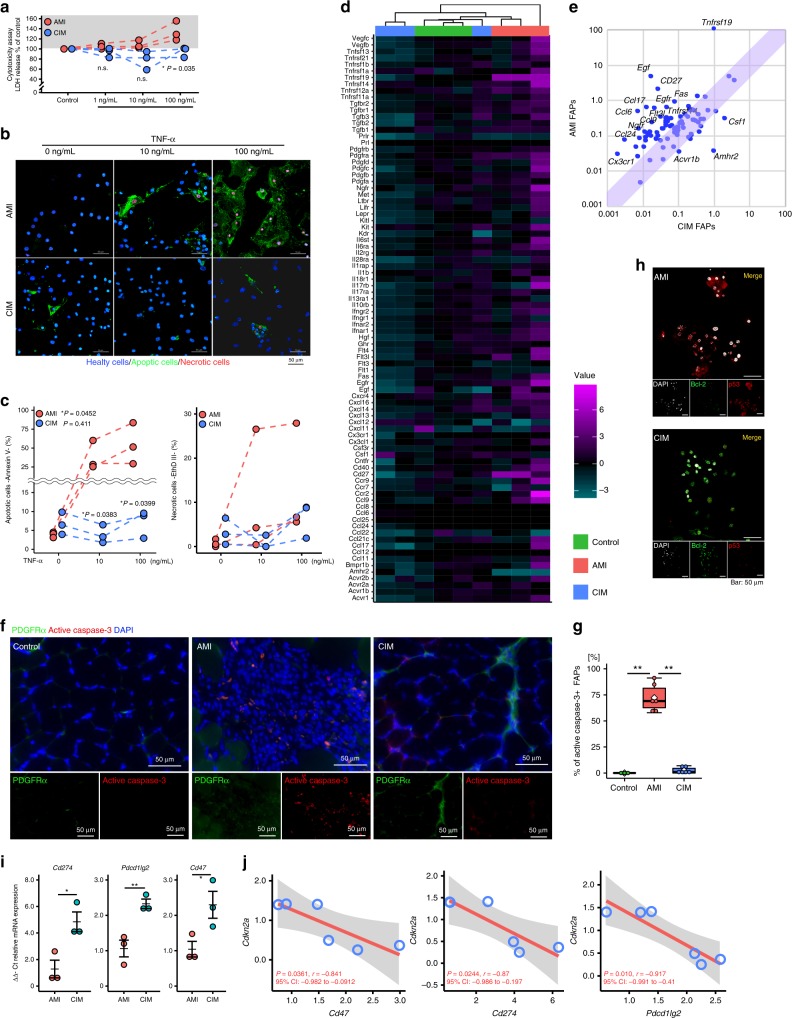
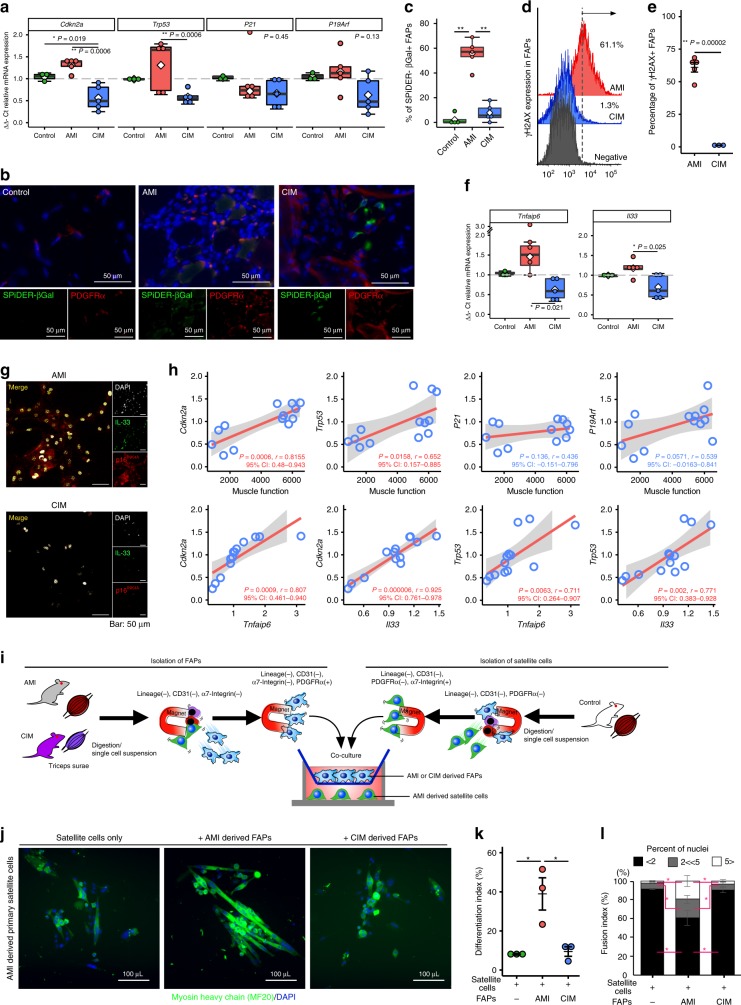
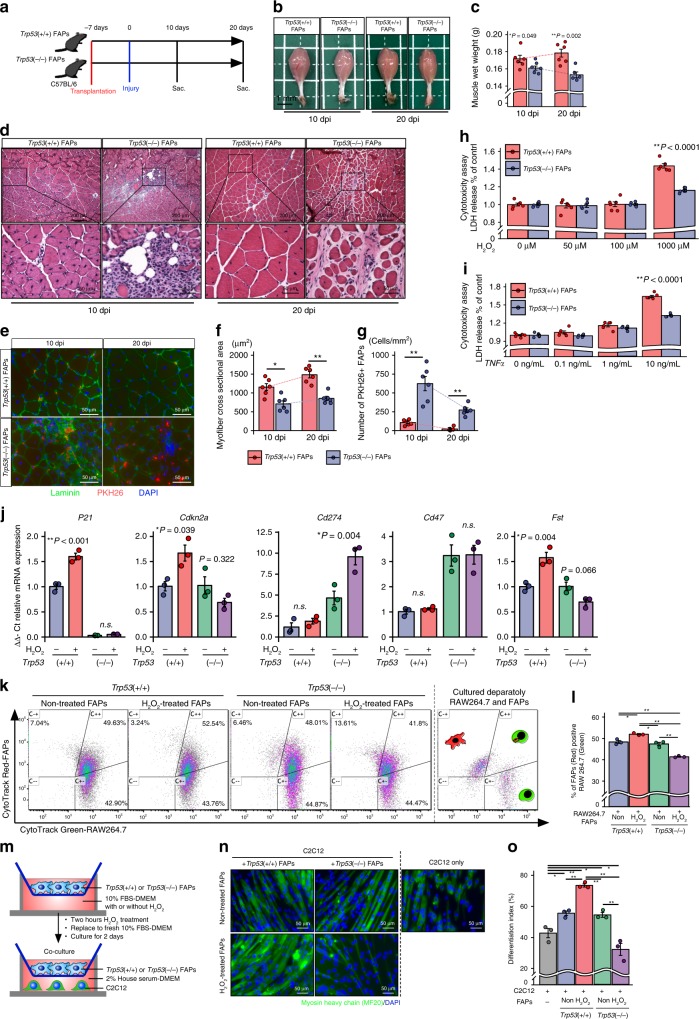
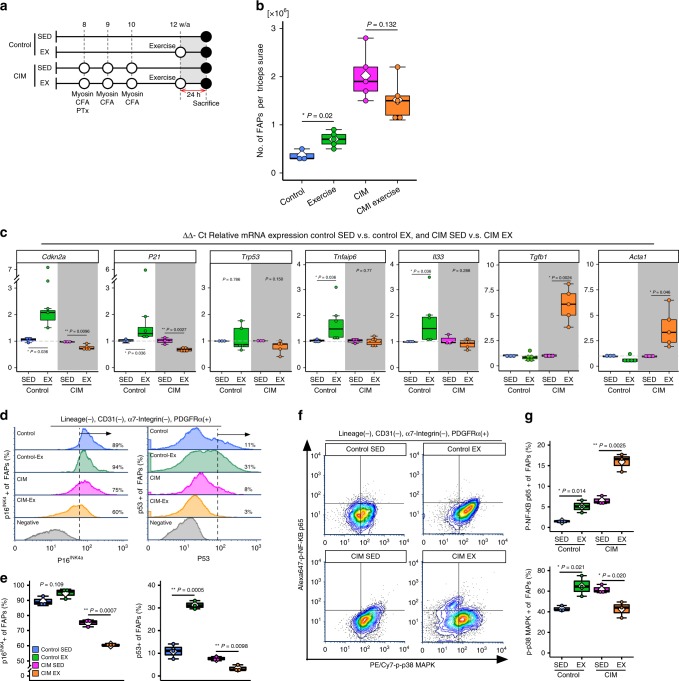
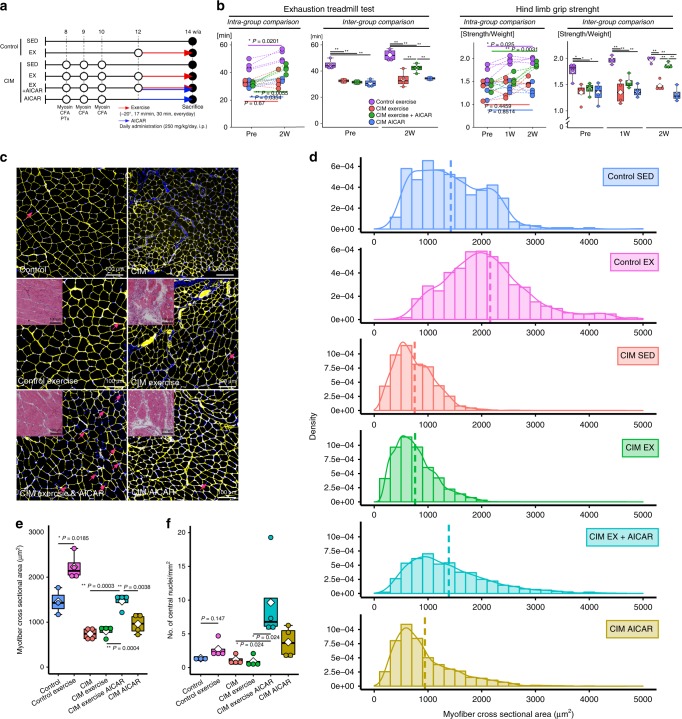
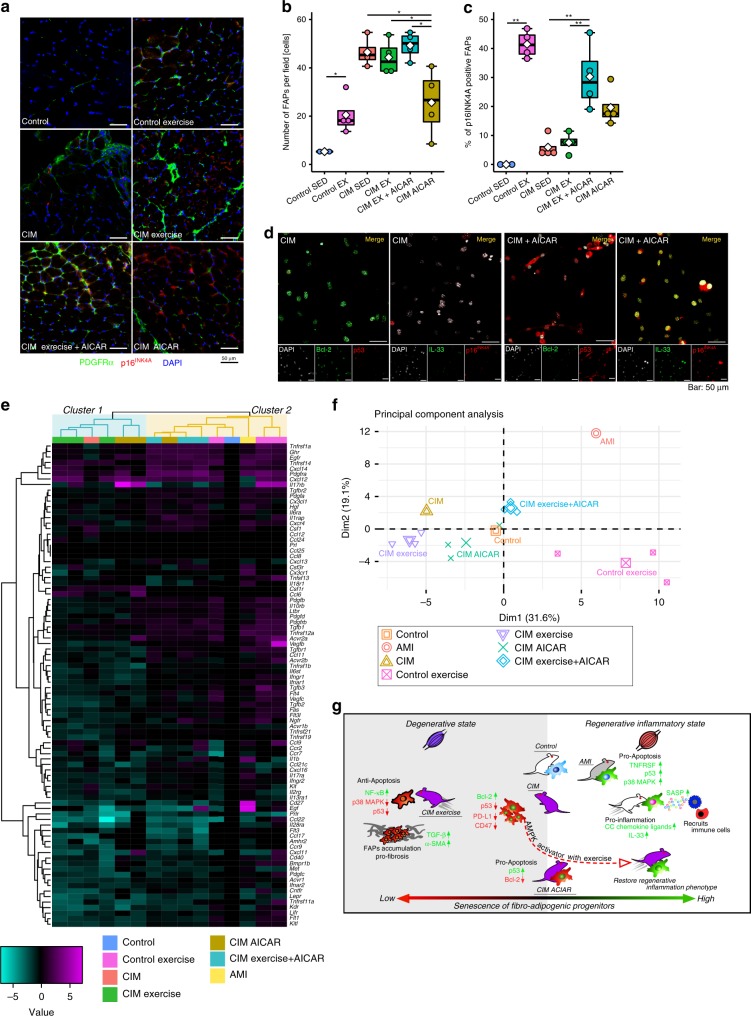
Idiopathic inflammatory myopathies cause progressive muscle weakness and degeneration. Since high-dose glucocorticoids might not lead to full recovery of muscle function, physical exercise is also an important intervention, but some exercises exacerbate chronic inflammation and muscle fibrosis. It is unknown how physical exercise can have both beneficial and detrimental effects in chronic myopathy. Here we show that senescence of fibro-adipogenic progenitors (FAPs) in response to exercise-induced muscle damage is needed to establish a state of regenerative inflammation that induces muscle regeneration. In chronic inflammatory myopathy model mice, exercise does not promote FAP senescence or resistance against tumor necrosis factor-mediated apoptosis. Pro-senescent intervention combining exercise and pharmacological AMPK activation reverses FAP apoptosis resistance and improves muscle function and regeneration. Our results demonstrate that the absence of FAP senescence after exercise leads to muscle degeneration with FAP accumulation. FAP-targeted pro-senescent interventions with exercise and pharmacological AMPK activation may constitute a therapeutic strategy for chronic inflammatory myopathy.
Overview
The claims and statistics of this paper haven’t been checked yet.
Run the check — free, no account needed. It reads the open-access text and checks the sources it cites.
Integrity signals
Registry
Cites
Statistics
Figures
Verification
Claims the paper makes
The claims and statistics of this paper haven’t been checked yet.
Run the check — free, no account needed. It reads the open-access text and checks the sources it cites.
Claims other papers make about this one
Each is checked against this paper’s own text: does it say what the citing paper says it does?
In the citing paper
“In a recent study, an acute bout of 14 d of downhill running promoted a senescent phenotype in skeletal muscle fibroadipogenic progenitors from young wild-type mice but not from mice with chronic inflammatory myopathy (58).”
From Exercise Counters the Age-Related Accumulation of Senescent Cells (2022) · cites this paper as [58]
In the citing paper
“Induction of senescence with exercise and pharmacological activation of AMPK using 5-aminoimidazole-4-carboxamide ribonucleotide improved muscle function, cross-sectional area, and regeneration in the chronic inflammatory myopathy model.”
From Exercise Counters the Age-Related Accumulation of Senescent Cells (2022) · cites this paper as [58]
In the citing paper
“senescent FAPs improved skeletal muscle fiber size and performance on treadmill and grip strength tests”
From Skeletal muscle aging, cellular senescence, and senotherapeutics: current knowledge and future directions (2021) · cites this paper as Saito et al., 2020
In the citing paper
“in young (3-months) mice muscle damage caused by downhill treadmill running activated the expression of senescence markers, including p16 and p21 in FAPs”
From Skeletal muscle aging, cellular senescence, and senotherapeutics: current knowledge and future directions (2021) · cites this paper as Saito et al., 2020
In the citing paper
“possibly through the pro-inflammatory expression profile of FAPs which facilitates muscle regeneration”
From Skeletal muscle aging, cellular senescence, and senotherapeutics: current knowledge and future directions (2021) · cites this paper as Saito et al., 2020
Self-check
Percentages, sums and reported differences re-computed from the paper’s own numbers.
The self-check needs the paper’s full text.
Citations
Cites
Investigation of the freely available easy-to-use software ‘EZR’ for medical statistics
Kanda, Y. (2012) · Bone Marrow Transplantation · doi:10.1038/bmt.2012.244 · Cited by 18,876
Macrophage plasticity and polarization: in vivo veritas
Sica, A., & Mantovani, A. (2012) · Journal of Clinical Investigation · doi:10.1172/jci59643 · Cited by 6,335
AMPK: a nutrient and energy sensor that maintains energy homeostasis
Hardie, D. G., Ross, F. A., & Hawley, S. A. (2012) · Nature Reviews Molecular Cell Biology · doi:10.1038/nrm3311 · Cited by 4,602
The AMPK signalling pathway coordinates cell growth, autophagy and metabolism
Mihaylova, M. M., & Shaw, R. J. (2011) · Nature Cell Biology · doi:10.1038/ncb2329 · Cited by 2,923
A DNA damage checkpoint response in telomere-initiated senescence
Fagagna, F. D. D., Reaper, P. M., Clay-Farrace, L., Fiegler, H., Carr, P., von Zglinicki, T., Saretzki, G., Carter, N. P., & Jackson, S. P. (2003) · Nature · doi:10.1038/nature02118 · Cited by 2,917
Cellular senescence: from physiology to pathology
Muñoz-Espín, D., & Serrano, M. (2014) · Nature Reviews Molecular Cell Biology · doi:10.1038/nrm3823 · Cited by 2,818
Zou, W., Wolchok, J. D., & Chen, L. (2016) · Science Translational Medicine · doi:10.1126/scitranslmed.aad7118 · Cited by 2,400
PD-1 expression by tumour-associated macrophages inhibits phagocytosis and tumour immunity
Gordon, S. R., Maute, R. L., Dulken, B. W., Hutter, G., George, B. M., McCracken, M. N., Gupta, R., Tsai, J. M., Sinha, R., Corey, D., et al. (2017) · Nature · doi:10.1038/nature22396 · Cited by 2,247
Senescence of Activated Stellate Cells Limits Liver Fibrosis
Krizhanovsky, V., Yon, M., Dickins, R. A., Hearn, S., Simon, J., Miething, C., Yee, H., Zender, L., & Lowe, S. W. (2008) · Cell · doi:10.1016/j.cell.2008.09.015 · Cited by 2,027
Arnold, L., Henry, A., Poron, F., Baba-Amer, Y., van Rooijen, N., Plonquet, A., Gherardi, R. K., & Chazaud, B. (2007) · The Journal of Experimental Medicine · doi:10.1084/jem.20070075 · Cited by 2,002
Cited by
Sorted by citations
Senolytic drugs: from discovery to translation
Kirkland, J. L., & Tchkonia, T. (2020) · Journal of Internal Medicine · doi:10.1111/joim.13141 · Cited by 1,227
Kidney fibrosis: from mechanisms to therapeutic medicines
Huang, R., Fu, P., & Ma, L. (2023) · Signal Transduction and Targeted Therapy · doi:10.1038/s41392-023-01379-7 · Cited by 876
Senescence atlas reveals an aged-like inflamed niche that blunts muscle regeneration
Moiseeva, V., Cisneros, A., Sica, V., Deryagin, O., Lai, Y., Jung, S., Andrés, E., An, J., Segalés, J., Ortet, L., et al. (2023) · Nature · doi:10.1038/s41586-022-05535-x · Cited by 423
Exercise sustains the hallmarks of health
Qiu, Y., Fernández-García, B., Lehmann, H. I., Li, G., Kroemer, G., López-Otín, C., & Xiao, J. (2023) · Journal of Sport and Health Science · doi:10.1016/j.jshs.2022.10.003 · Cited by 270
A Senescence-Centric View of Aging: Implications for Longevity and Disease
Borghesan, M., Hoogaars, W. M. H., Varela-Eirin, M., Talma, N., & Demaria, M. (2020) · Trends in Cell Biology · doi:10.1016/j.tcb.2020.07.002 · Cited by 267
Characterization of cellular senescence in aging skeletal muscle
Zhang, X., Habiballa, L., Aversa, Z., Ng, Y. E., Sakamoto, A. E., Englund, D. A., Pearsall, V. M., White, T. A., Robinson, M. M., Rivas, D. A., et al. (2022) · Nature Aging · doi:10.1038/s43587-022-00250-8 · Cited by 206
Molecular mechanisms of exercise contributing to tissue regeneration
Chen, J., Zhou, R. J., Ye, F., & Cheng, L. (2022) · Signal Transduction and Targeted Therapy · doi:10.1038/s41392-022-01233-2 · Cited by 185
Aging of mesenchymal stem cell: machinery, markers, and strategies of fighting
Al‐Azab, M., Safi, M., Idiiatullina, E., Al‐Shaebi, F., & Zaky, M. Y. (2022) · Cellular & Molecular Biology Letters · doi:10.1186/s11658-022-00366-0 · Cited by 178
Contreras, O., Rossi, F. M. V., & Théret, M. (2021) · Skeletal Muscle · doi:10.1186/s13395-021-00265-6 · Cited by 163
Théret, M., Rossi, F. M. V., & Contreras, O. (2021) · Frontiers in Physiology · doi:10.3389/fphys.2021.673404 · Cited by 154
Giuliani, G., Rosina, M., & Reggio, A. (2021) · FEBS Journal · doi:10.1111/febs.16080 · Cited by 144
Espino-González, E., Dalbram, E., Mounier, R., Gondin, J., Farup, J., Jessen, N., & Treebak, J. T. (2024) · Cell Metabolism · doi:10.1016/j.cmet.2024.02.014 · Cited by 141
Bidirectional roles of skeletal muscle fibro-adipogenic progenitors in homeostasis and disease
Chen, W., You, W., Valencak, T. G., & Shan, T. (2022) · Ageing Research Reviews · doi:10.1016/j.arr.2022.101682 · Cited by 120
Paramos-de-Carvalho, D., Jacinto, A., & Saúde, L. (2021) · eLife · doi:10.7554/elife.72449 · Cited by 111
Role of cellular senescence in inflammation and regeneration
Saito, Y., Yamamoto, S., & Chikenji, T. (2024) · Inflammation and Regeneration · doi:10.1186/s41232-024-00342-5 · Cited by 127
Self-citationEffects of exercise on cellular and tissue aging
Carapeto, P. V., & Aguayo-Mazzucato, C. (2021) · Aging · doi:10.18632/aging.203051 · Cited by 107
“beneficial, such as the appearance of fibro-adipogenic progenitors in response to muscle damage, and leads to regenerative inflammation [102].”
BackgroundTripathi, U., Misra, A., Tchkonia, T., & Kirkland, J. L. (2021) · Mechanisms of Ageing and Development · doi:10.1016/j.mad.2021.111548 · Cited by 104
Deletion of SA β‐Gal+ cells using senolytics improves muscle regeneration in old mice
Dungan, C. M., Murach, K. A., Zdunek, C. J., Tang, Z. J., Nolt, G. L., Brightwell, C. R., Hettinger, Z. R., Englund, D. A., Liu, Z., Fry, C. S., et al. (2021) · Aging Cell · doi:10.1111/acel.13528 · Cited by 107
Englund, D. A., Zhang, X., Aversa, Z., & LeBrasseur, N. K. (2021) · Mechanisms of Ageing and Development · doi:10.1016/j.mad.2021.111595 · Cited by 94
Is exercise a senolytic medicine? A systematic review
Chen, X., Yi, Z., Wong, G. T., Hasan, K. M. M., Kwan, J. S., Ma, A. C., & Chang, R. C. (2021) · Aging Cell · doi:10.1111/acel.13294 · Cited by 88
DNA Damage-Induced Inflammatory Microenvironment and Adult Stem Cell Response
Cinat, D., Coppes, R. P., & Barazzuol, L. (2021) · Frontiers in Cell and Developmental Biology · doi:10.3389/fcell.2021.729136 · Cited by 79
Autophagy in muscle regeneration: potential therapies for myopathies
Chen, W., Chen, Y., Liu, Y., & Wang, X. (2022) · Journal of Cachexia Sarcopenia and Muscle · doi:10.1002/jcsm.13000 · Cited by 80
The role of cellular senescence in tissue repair and regeneration
Antelo-Iglesias, L., Picallos-Rabina, P., Estévez‐Souto, V., Silva‐Álvarez, S. D., & Collado, M. (2021) · Mechanisms of Ageing and Development · doi:10.1016/j.mad.2021.111528 · Cited by 79
Targeting cellular senescence in metabolic disease
Palmer, A. K., Tchkonia, T., & Kirkland, J. L. (2022) · Molecular Metabolism · doi:10.1016/j.molmet.2022.101601 · Cited by 76
Flores‐Opazo, M., Kopinke, D., Helmbacher, F., Fernández‐Verdejo, R., Tuñón‐Suárez, M., Lynch, G. S., & Contreras, O. (2024) · Molecular Aspects of Medicine · doi:10.1016/j.mam.2024.101277 · Cited by 66
Exercise Counters the Age-Related Accumulation of Senescent Cells
Zhang, X., Englund, D. A., Aversa, Z., Jachim, S. K., White, T. A., & LeBrasseur, N. K. (2022) · Exercise and Sport Sciences Reviews · doi:10.1249/jes.0000000000000302 · Cited by 63
Kang, X., Qian, J., Shi, Y.-X., Bian, X., Zhang, L., Li, G., Wang, L., Zhao, J., Dong, Z., Yang, M., et al. (2024) · Cell stem cell · doi:10.1016/j.stem.2023.12.011 · Cited by 59
Modulating tumor physical microenvironment for fueling CAR-T cell therapy
Luo, Z. Y., Yao, X., Li, M., Fang, D., Fei, Y., Cheng, Z., Xu, Y., & Zhu, B. (2022) · Advanced Drug Delivery Reviews · doi:10.1016/j.addr.2022.114301 · Cited by 59
In vivo analysis of γH2AX+ cells in skeletal muscle from aged and obese humans
Dungan, C. M., Peck, B. D., Walton, R. G., Huang, Z., Bamman, M. M., Kern, P. A., & Peterson, C. A. (2020) · The FASEB Journal · doi:10.1096/fj.202000111rr · Cited by 61
Cellular senescence and wound healing in aged and diabetic skin
Kita, A., Yamamoto, S., Saito, Y., & Chikenji, T. (2024) · Frontiers in Physiology · doi:10.3389/fphys.2024.1344116 · Cited by 64
Self-citationSignalling by senescent melanocytes hyperactivates hair growth
Wang, X., Ramos, R., Phan, A. Q., Yamaga, K., Flesher, J. L., Jiang, S., Oh, J. W., Jin, S., Jahid, S., Kuan, C., et al. (2023) · Nature · doi:10.1038/s41586-023-06172-8 · Cited by 57
Cardone, N., Taglietti, V., Baratto, S., Kefi, K., Periou, B., Gitiaux, C., Barnérias, C., Lafuste, P., Leturcq, F., Nectoux, J., et al. (2023) · Acta Neuropathologica Communications · doi:10.1186/s40478-023-01657-z · Cited by 57
Diverse Roles of Cellular Senescence in Skeletal Muscle Inflammation, Regeneration, and Therapeutics
Saito, Y., & Chikenji, T. (2021) · Frontiers in Pharmacology · doi:10.3389/fphar.2021.739510 · Cited by 53
Self-citationYoung, L. V., Wakelin, G., Cameron, A., Springer, S. A., Ross, J. P., Wolters, G., Murphy, J. P., Arsenault, M. G., Ng, S. Y., Collao, N., et al. (2022) · The FASEB Journal · doi:10.1096/fj.202200289rr · Cited by 47
Senescent cells limit p53 activity via multiple mechanisms to remain viable
Sturmlechner, I., Sine, C. C., Jeganathan, K. B., Zhang, C., Velasco, R. O. F., Baker, D. J., Li, H., & van Deursen, J. M. (2022) · Nature Communications · doi:10.1038/s41467-022-31239-x · Cited by 45
Senolysis induced by 25-hydroxycholesterol targets CRYAB in multiple cell types
Limbad, C., Doi, R., McGirr, J., Ciotlos, S., Pérez, K., Clayton, Z. S., Daya, R., Seals, D. R., Campisi, J., & Melov, S. (2022) · iScience · doi:10.1016/j.isci.2022.103848 · Cited by 46
An energetics perspective on geroscience: mitochondrial protonmotive force and aging
Berry, B. J., & Kaeberlein, M. R. (2021) · GeroScience · doi:10.1007/s11357-021-00365-7 · Cited by 44
Kita, A., Saito, Y., Miura, N., Miyajima, M., Yamamoto, S., Sato, T., Yotsuyanagi, T., Fujimiya, M., & Chikenji, T. (2022) · Communications Biology · doi:10.1038/s42003-022-03266-3 · Cited by 45
Self-citationWang, X., Chen, J., Homma, S. T., Wang, Y., Smith, G. R., Ruf-Zamojski, F. M., Sealfon, S. C., & Zhou, L. (2022) · iScience · doi:10.1016/j.isci.2022.105775 · Cited by 45
Tissue cross talks governing limb muscle development and regeneration
Helmbacher, F., & Stricker, S. (2020) · Seminars in Cell and Developmental Biology · doi:10.1016/j.semcdb.2020.05.005 · Cited by 42
Role of fibro-adipogenic progenitor cells in muscle atrophy and musculoskeletal diseases
Parker, E. J., & Hamrick, M. W. (2021) · Current Opinion in Pharmacology · doi:10.1016/j.coph.2021.03.003 · Cited by 38
Marzetti, E., Lozanoska‐Ochser, B., Calvani, R., Landi, F., Coelho‐Júnior, H. J., & Picca, A. (2024) · Biomolecules · doi:10.3390/biom14040415 · Cited by 36
Guo, Q., Luo, Q., & Song, G. (2024) · Journal of Cachexia Sarcopenia and Muscle · doi:10.1002/jcsm.13440 · Cited by 35
Tuñón‐Suárez, M., Reyes, A. P., Godoy-Órdenes, R., Quezada, N., & Flores‐Opazo, M. (2021) · Physical Therapy · doi:10.1093/ptj/pzab162 · Cited by 34
Xu, L., Xiaojuan, S., Zhu, G., Mao, J., Baban, B., & Qin, X. (2020) · Journal of Cellular and Molecular Medicine · doi:10.1111/jcmm.16058 · Cited by 34
Ahsan, M., Garneau, L., & Aguer, C. (2022) · Frontiers in Physiology · doi:10.3389/fphys.2022.1040809 · Cited by 31
Taniguchi, M., Fukumoto, Y., Yagi, M., Hirono, T., Yamagata, M., Asayama, A., Okada, S., Nakai, R., Kobayashi, M., & Ichihashi, N. (2023) · Arthritis Research & Therapy · doi:10.1186/s13075-023-03048-0 · Cited by 28
Li, F., Zhang, F., Shi, H., Xia, H., Wei, X., Liu, S., Wu, T., Li, Y., Feng, S., Chen, M., et al. (2024) · Journal of Cachexia Sarcopenia and Muscle · doi:10.1002/jcsm.13526 · Cited by 28
Liu, X., Zhao, L., Gao, Y., Chen, Y., Tian, Q., Son, J. S., Chae, S. A., de Avila, J. M., Zhu, M. J., & Du, . (2022) · Journal of Cachexia Sarcopenia and Muscle · doi:10.1002/jcsm.13150 · Cited by 27
Nolt, G. L., Keeble, A. R., Wen, Y., Strong, A. C., Thomas, N. T., Valentino, T. R., Brightwell, C. R., Murach, K. A., Patrizia, S., Weinstabl, H., et al. (2023) · GeroScience · doi:10.1007/s11357-023-00976-2 · Cited by 27
Lifestyle interventions to delay senescence
Martel, J., Ojcius, D. M., & Young, J. D. (2023) · Biomedical Journal · doi:10.1016/j.bj.2023.100676 · Cited by 30
Zhang, B., Chen, Q., Chen, Q., & Zhang, H. (2025) · Metabolism · doi:10.1016/j.metabol.2025.156333 · Cited by 31
Iio, R., Manaka, T., Takada, N., Orita, K., Nakazawa, K., Hirakawa, Y., Ito, Y. M., & Nakamura, H. (2023) · The American Journal of Sports Medicine · doi:10.1177/03635465231190389 · Cited by 25
Nanomaterial‐Mediated Reprogramming of Macrophages to Inhibit Refractory Muscle Fibrosis
Cheng, X., Sui, H., Chen, F., Li, C., Du, M., Zhang, S., Chen, J., Dou, J., Huang, Y., Xie, X., et al. (2024) · Advanced Materials · doi:10.1002/adma.202410368 · Cited by 24
Ageing and Obesity Shared Patterns: From Molecular Pathogenesis to Epigenetics
Ghanemi, A., Yoshioka, M., & St‐Amand, J. (2021) · Diseases · doi:10.3390/diseases9040087 · Cited by 26
Mechanism of high-mannose N-glycan breakdown and metabolism by Bifidobacterium longum
Cordeiro, R. L., dos Santos, C. R., Domingues, M. N., Lima, T. B., Pirolla, R. A. S., Morais, M. A. B., Colombari, F. M., Miyamoto, R. Y., Persinoti, G. F., Borges, A. C., et al. (2022) · Nature Chemical Biology · doi:10.1038/s41589-022-01202-4 · Cited by 24
Tian, J., Li, J., Yin, H., Ma, L., Zhang, J., Zhai, Q., Duan, S., & Zhang, L. (2020) · The Science of The Total Environment · doi:10.1016/j.scitotenv.2020.143152 · Cited by 23
Arrighi, N., Moratal, C., Savary, G., Fassy, J., Nottet, N., Pons, N., Clément, N., Fellah, S., Larrue, R., Magnone, V., et al. (2021) · Cells · doi:10.3390/cells10071832 · Cited by 25
Determinants of epigenetic resistance to HDAC inhibitors in dystrophic fibro‐adipogenic progenitors
Consalvi, S., Tucciarone, L., Macrì, E., Bardi, M. D., Picozza, M., Salvatori, I., Renzini, A., Valente, S., Mai, A., Moresi, V., et al. (2022) · EMBO Reports · doi:10.15252/embr.202254721 · Cited by 26
Collao, N., Sanders, O., Caminiti, T., Messeiller, L., & Lisio, M. D. (2023) · Journal of Cachexia Sarcopenia and Muscle · doi:10.1002/jcsm.13185 · Cited by 22
Dungan, C. M., Wells, J. M., & Murach, K. A. (2023) · American Journal of Physiology-Cell Physiology · doi:10.1152/ajpcell.00553.2022 · Cited by 21
Wei, X., Nicoletti, C., & Puri, P. (2021) · Seminars in Cell and Developmental Biology · doi:10.1016/j.semcdb.2021.07.013 · Cited by 22
Misquitta, N. S., Ravel‐Chapuis, A., & Jasmin, B. J. (2022) · Human Molecular Genetics · doi:10.1093/hmg/ddac222 · Cited by 20
Anti-inflammatory therapy enables robot-actuated regeneration of aged muscle
McNamara, S. L., Seo, B. R., Freedman, B. R., Roloson, E. B., Alvarez, J. T., O’Neill, C., Vandenburgh, H. H., Walsh, C. J., & Mooney, D. J. (2023) · Science Robotics · doi:10.1126/scirobotics.add9369 · Cited by 22
Exercise Promotes Tissue Regeneration: Mechanisms Involved and Therapeutic Scope
Liu, C., Wu, X., Vulugundam, G., Gokulnath, P., Li, G., & Xiao, J. (2023) · Sports Medicine - Open · doi:10.1186/s40798-023-00573-9 · Cited by 26
Pathogenic role and therapeutic potential of fibro-adipogenic progenitors in muscle disease
Hogarth, M. W., Uapinyoying, P., Mázala, D. A. G., & Jaiswal, J. K. (2021) · Trends in Molecular Medicine · doi:10.1016/j.molmed.2021.10.003 · Cited by 20
Crescioli, C. (2021) · International Journal of Molecular Sciences · doi:10.3390/ijms22041760 · Cited by 20
New Trends in Aging Drug Discovery
Benhamú, B., Martín‐Fontecha, M., Vázquez‐Villa, H., López-Rodríguez, M. L., & Ortega‐Gutiérrez, S. (2022) · Biomedicines · doi:10.3390/biomedicines10082006 · Cited by 20
Li, Q., Wang, Z., Shi, N., Yang, Q., Yao, W., Yu, J., & Lu, Y. (2023) · Smart Medicine · doi:10.1002/smmd.20230030 · Cited by 19
Yao, Y., Luo, Y., Liang, X., Zhong, L., Wang, Y., Hong, Z., Song, C., Xu, Z., Wang, J., & Zhang, M. (2025) · Stem Cell Research & Therapy · doi:10.1186/s13287-025-04242-4 · Cited by 21
Programmed Cell Death Pathways in the Pathogenesis of Idiopathic Inflammatory Myopathies
Shi, J., Tang, M., Zhou, S., Xu, D., Zhao, J., Wu, C., Wang, Q., Tian, X., Li, M., & Zeng, X. (2021) · Frontiers in Immunology · doi:10.3389/fimmu.2021.783616 · Cited by 18
Exercise and tissue fibrosis: recent advances in therapeutic potential and molecular mechanisms
Zhao, Z., Zhu, Y., & Wan, D. (2025) · Frontiers in Endocrinology · doi:10.3389/fendo.2025.1557797 · Cited by 19
Muscle Injuries Induce a Prostacyclin‐PPARγ/PGC1a‐FAO Spike That Boosts Regeneration
Luo, L., Chua, B. Y.-J., Liu, T., Liang, K., Min‐Wen, J. C., Ma, W., Goh, J., Wang, Y., Su, J., Ho, Y. S., et al. (2023) · Advanced Science · doi:10.1002/advs.202301519 · Cited by 19
Pérez‐Díaz, S., Koumaiha, Z., Borok, M. J., Aurade, F., Pini, M., Periou, B., Rouault, C., Baba‐Amer, Y., Clément, K., Dérumeaux, G., et al. (2022) · Matrix Biology · doi:10.1016/j.matbio.2022.08.006 · Cited by 16
Stromal vascular fraction in the treatment of myositis
Gandolfi, S., Pileyre, B., Drouot, L., Dubus, I., Auquit-Auckbur, I., & Martinet, J. (2023) · Cell Death Discovery · doi:10.1038/s41420-023-01605-9 · Cited by 17
Ijima, S., Saito, Y., Yamamoto, S., Nagaoka, K., Iwamoto, T., Kita, A., Miyajima, M., Sato, T., Miyazaki, A., & Chikenji, T. (2023) · Immunity & Ageing · doi:10.1186/s12979-023-00400-5 · Cited by 17
Self-citationExercise, exerkines and exercise mimetic drugs: Molecular mechanisms and therapeutics
Samant, V., & Prabhu, A. (2024) · Life Sciences · doi:10.1016/j.lfs.2024.123225 · Cited by 15
Parker, E. J., Khayrullin, A., Kent, A., Mendhe, B., Baradie, K. B. Y. E., Yu, K., Pihkala, J. P. S., Liu, Y., McGee‐Lawrence, M. E., Johnson, M. H., et al. (2022) · Frontiers in Cell and Developmental Biology · doi:10.3389/fcell.2021.790437 · Cited by 16
Yao, H., Qian, J., Bian, X., Tang, Y., ye, X., He, G., Tang, H., liu, X., Zhang, A., xie, Q., et al. (2024) · Journal of Orthopaedic Surgery and Research · doi:10.1186/s13018-024-04733-9 · Cited by 15
Muscle regeneration and muscle stem cells in metabolic disease
Chung, J. D., Porrello, E. R., & Lynch, G. S. (2024) · Free Radical Biology and Medicine · doi:10.1016/j.freeradbiomed.2024.11.041 · Cited by 16
Garg, K., Brockhouse, J., McAndrew, C. M., Reiter, A. J., Owens, J. G., Mueller, R. J., Pena, G., Ridolfo, A., & Johnson, D. L. (2025) · The Journal of Physiology · doi:10.1113/jp286551 · Cited by 14
Chambers, T. L., Wells, J. M., Koopmans, P. J., da Silva, F. M., Malik, Z. B., Greene, N. P., Filareto, A., Franti, M., Sini, P., Weinstabl, H., et al. (2025) · Aging Cell · doi:10.1111/acel.70068 · Cited by 14
Individual transcriptomic response to strength training for patients with myotonic dystrophy type 1
Davey, E. E., Légaré, C., Planco, L., Shaughnessy, S., Lennon, C. D., Roussel, M., Shorrock, H. K., Hung, M., Cleary, J. D., Duchesne, É., et al. (2023) · JCI Insight · doi:10.1172/jci.insight.163856 · Cited by 14
Wei, S., Schell, J. R., Qian, W., Silguero, M., Baseviciene, A., Chen, W. H., Trevino, R., Chocrón, E. S., Ogle, M. M., Varmazyad, M., et al. (2025) · Cell Reports · doi:10.1016/j.celrep.2025.116026 · Cited by 15
Guzman, S. D., Judge, J., Shigdar, S. M., Paul, T. A., Davis, C. S., Macpherson, P. C. D., Markworth, J. F., Remmen, H. V., Richardson, A. G., McArdle, A., et al. (2022) · Frontiers in Aging · doi:10.3389/fragi.2021.821904 · Cited by 14
Endurance exercise remodels skeletal muscle by suppressing Ythdf1-mediated myostatin expression
Huang, X., Xu, C., Zhang, J., Wu, W., Wang, Z., Pang, Q., Liu, Z., & Liu, B. (2025) · Cell Death and Disease · doi:10.1038/s41419-025-07379-5 · Cited by 14
Senescent cells in tissue engineering
Chin, A. F., & Elisseeff, J. H. (2022) · Current Opinion in Biotechnology · doi:10.1016/j.copbio.2022.102737 · Cited by 11
Falvino, A., Bonanni, R., Tarantino, U., Tancredi, V., & Cariati, I. (2025) · International Journal of Molecular Sciences · doi:10.3390/ijms26157573 · Cited by 12
Exercise, Diet and Sleeping as Regenerative Medicine Adjuvants: Obesity and Ageing as Illustrations
Ghanemi, A., Yoshioka, M., & St‐Amand, J. (2022) · Medicines · doi:10.3390/medicines9010007 · Cited by 11
Aging microvasculature: Effects on immune cell trafficking and inflammatory diseases
Reglero-Real, N., Rolas, L., & Nourshargh, S. (2025) · The Journal of Experimental Medicine · doi:10.1084/jem.20242154 · Cited by 11
Yoo, K., Jo, Y., Yoo, T., Hann, S., Park, I., Kim, Y.-E., Kim, Y. L., Rhee, J., Song, I.-W., Kim, J.-H., et al. (2024) · eLife · doi:10.7554/elife.97662.3 · Cited by 10
Wang, X., Chen, C., Li, C., Chen, X., Xu, R., Chen, M., Li, Y., Liu, Y., Liu, X., Chen, Y., et al. (2024) · Science China Life Sciences · doi:10.1007/s11427-024-2696-5 · Cited by 10
McKay, J., Nasb, M., & Hafsi, K. (2021) · International Orthopaedics · doi:10.1007/s00264-021-05253-5 · Cited by 10
CDKN2A Gene Expression as a Potential Aging Biomarker in Dogs
Sándor, S., Tátrai, K., Czeibert, K., Egyed, B., & Kubinyi, E. (2021) · Frontiers in Veterinary Science · doi:10.3389/fvets.2021.660435 · Cited by 11
Iijima, H., Ambrosio, F., & Matsui, Y. (2023) · The Journal of Physiology · doi:10.1113/jp285349 · Cited by 10
Ruple, B. A., Mattingly, M. L., Godwin, J. S., McIntosh, M. C., Kontos, N. J., Agyin-Birikorang, A., Michel, J. M., Plotkin, D. L., Chen, S., Ziegenfuss, T. N., et al. (2024) · The FASEB Journal · doi:10.1096/fj.202302103rrr · Cited by 9
Buras, E. D., Woo, M., Verma, R. K., Kondisetti, S. H., Davis, C. S., Claflin, D. R., Converso‐Baran, K., Michele, D. E., Brooks, S. V., & Chun, T. (2024) · JCI Insight · doi:10.1172/jci.insight.175047 · Cited by 9
Fibro-Adipogenic Progenitors require autocrine IGF-I in homeostatic and regenerating skeletal musclePreprint
Luo, Y. E., Abe-Teh, Z., Alsaghir, T. Y., Kuo, L.-Y., Yu, F., Stoker, B. E., Appu, A. B., Zhou, Y., Yue, F., Kopinke, D., et al. (2025) · bioRxiv (Cold Spring Harbor Laboratory) · doi:10.1101/2025.04.11.648330 · Cited by 9
FAP senescence: a critical event in muscle regeneration
Kang, X., Gao, Y., Fukada, S., & Miao, H. (2023) · Signal Transduction and Targeted Therapy · doi:10.1038/s41392-023-01411-w · Cited by 8
Yi, X., He, Y., Li, R., Zhao, T., He, Z., & Pang, W.-J. (2024) · Agriculture Communications · doi:10.1016/j.agrcom.2024.100026 · Cited by 9
Metadata
- Authors
- Saito, Y., Chikenji, T. S., Matsumura, T., Nakano, M., & Fujimiya, M.
- Affiliations
- Sapporo Medical University (JP)
- Corresponding author
- Chikenji, Takako S.
- Venue
- Nature Communications
- Published
- 2020-02-14
- Volume
- 11
- Issue
- 1
- Pages
- 889-889
- ISSN
- 2041-1723 (ISSN-L)
- PMC
- PMC7021787
- OpenAlex
- W3005549618
- Cited by
- 196
- References
- 72
- Citations by year
- 2026: 35 · 2025: 29 · 2024: 36 · 2023: 28 · 2022: 32 · 2021: 26 · 2020: 10
- FWCI
- 7.79
- Type
- journal article
- Language
- en
- Open access
- gold
- doi.org
- Locations
- Nature Communications (publishedVersion, cc-by)
- PubMed Central (publishedVersion, cc-by)
- PubMed (publishedVersion)
- Institutional Repositories DataBase (IRDB) (publishedVersion)
- RePEc: Research Papers in Economics (submittedVersion)
- DOAJ (DOAJ: Directory of Open Access Journals) (submittedVersion, cc-by-sa)
- Hokkaido University Collection of Scholarly and Academic Papers (Hokkaido University) (submittedVersion, cc-by)
- Institutional Repositories DataBase (IRDB) (submittedVersion, cc-by)
- Funders
- Japan Society for the Promotion of Science (18K16668, 18K17722, 16K16430)
- Topics
- Life Sciences › Biochemistry, Genetics and Molecular Biology › Molecular Biology › Muscle Physiology and Disorders
- Health Sciences › Medicine › Rheumatology › Inflammatory Myopathies and Dermatomyositis
- Health Sciences › Medicine › Physiology (medical) › Exercise and Physiological Responses
- Keywords
- physical activity, skeletal muscle regeneration, fibro-adipogenic progenitors, cellular senescence, exercise-induced muscle damage, AMPK activation, TNF-α, apoptosis resistance, muscle fibrosis, muscle degeneration
- MeSH terms
- Aging, Animals, Exercise Therapy, Female, Humans, Mice, Inbred BALB C, Mice, Inbred C57BL, Muscular Diseases, Regeneration, Apoptosis, Muscle, Skeletal, Mice, Mesenchymal Stem Cells
About these checks
Registry, retraction, Cites and statistics results are computed, not judged, with one exception: a printed reference that no index lists is read once by a model before it counts as a citation error. Claims are extracted by a model and kept only when their quote appears verbatim in the text; each cited source is then checked, with a model’s help, for whether it says what the claim relies on. Those verdicts can be wrong — read the claim’s quote and the cited source before relying on one.
Statistics and arithmetic are recomputed, not judged.
Confidence bands are shown only for fields calibrated on our annotated test set. None is calibrated yet, so no band is shown.
What counts as a claim ›How we measure confidence ›How we check this ›
Are you an author, or do you see a problem with this page? Request a review
