

The DOI matches its Crossref record; 78 of the 79 references it cites were found in a registry or an index.
Multiplexed relative and absolute quantitative immunopeptidomics reveals MHC I repertoire alterations induced by CDK4/6 inhibition
Open accessPublished version of a preprint
Abstract
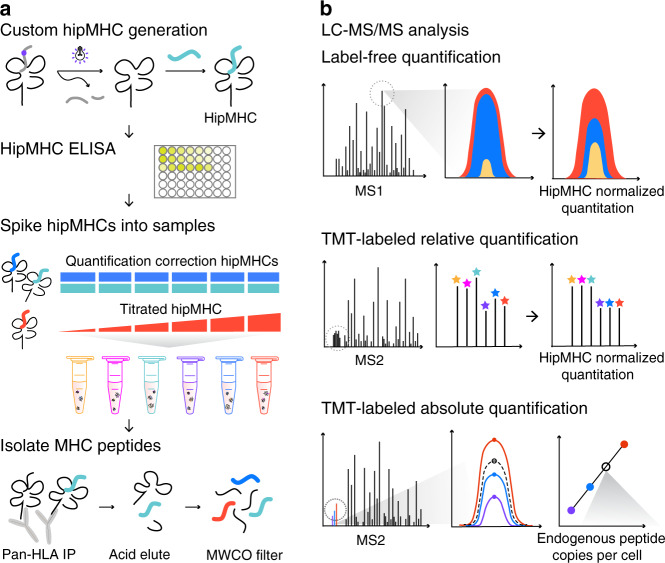
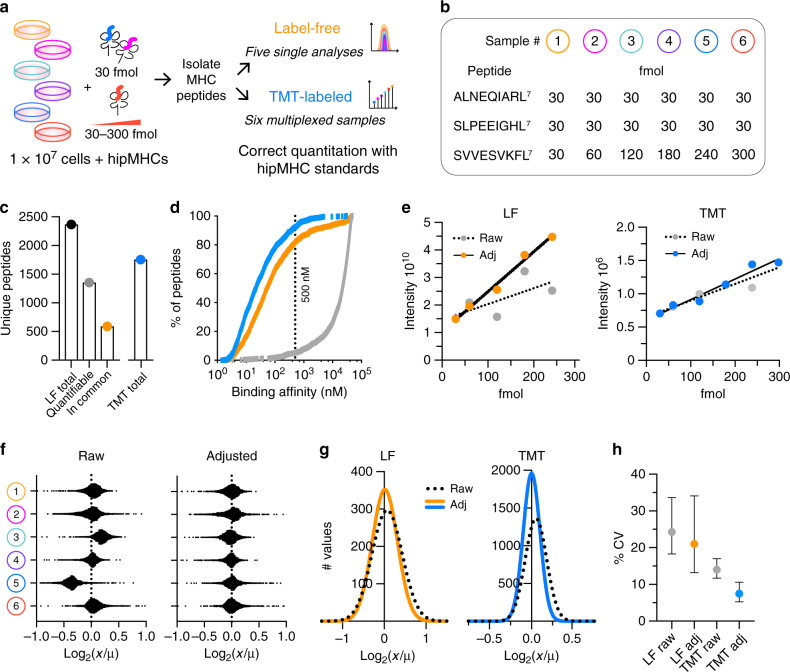
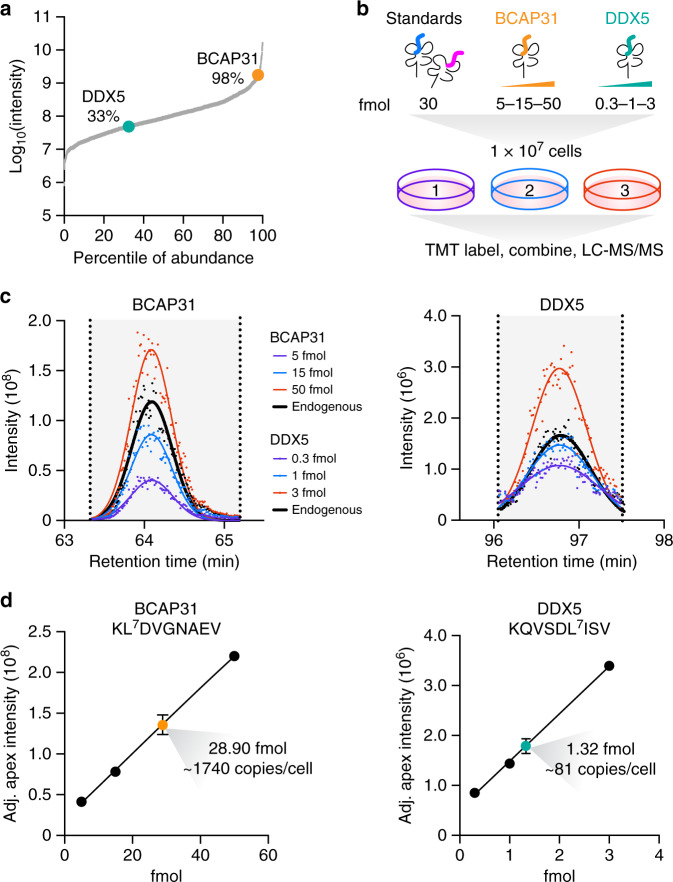
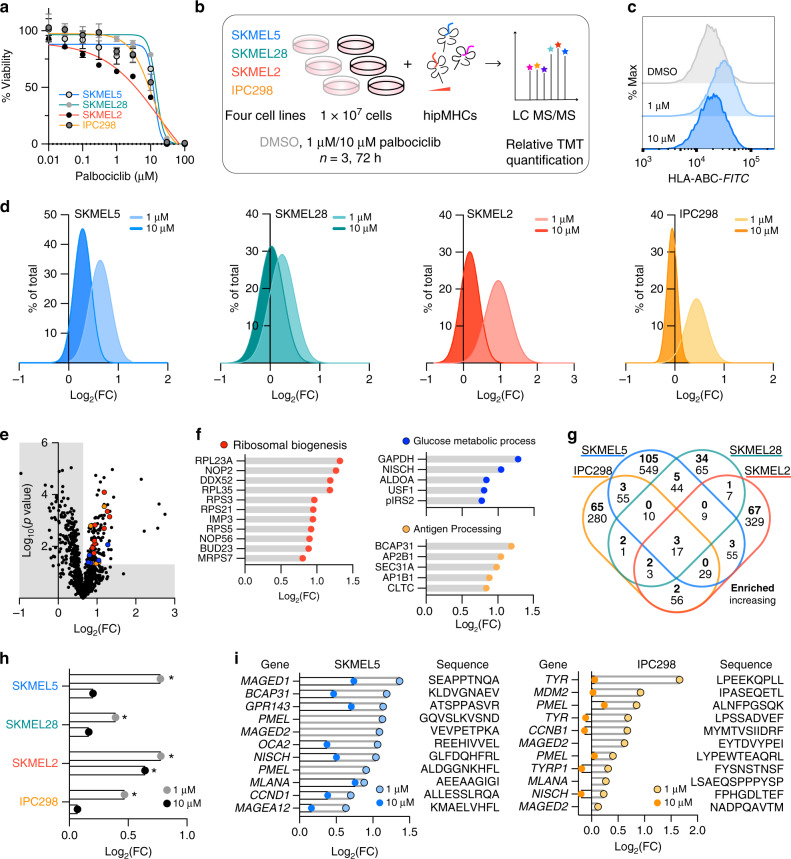
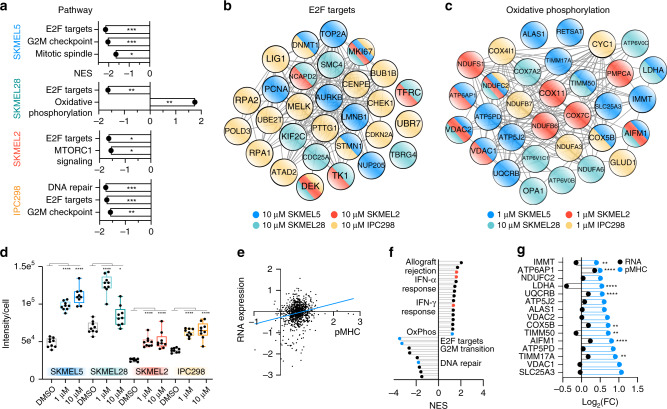
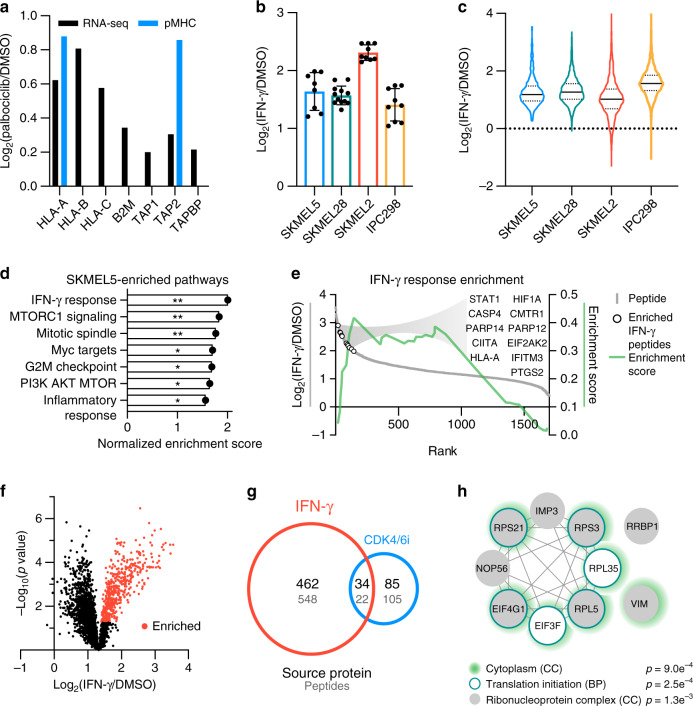
Peptides bound to class I major histocompatibility complexes (MHC) play a critical role in immune cell recognition and can trigger an antitumor immune response in cancer. Surface MHC levels can be modulated by anticancer agents, altering immunity. However, understanding the peptide repertoire's response to treatment remains challenging and is limited by quantitative mass spectrometry-based strategies lacking normalization controls. We describe an experimental platform that leverages recombinant heavy isotope-coded peptide MHCs (hipMHCs) and multiplex isotope tagging to quantify peptide repertoire alterations using low sample input. HipMHCs improve quantitative accuracy of peptide repertoire changes by normalizing for variation across analyses and enable absolute quantification using internal calibrants to determine copies per cell of MHC antigens, which can inform immunotherapy design. Applying this platform in melanoma cell lines to profile the immunopeptidome response to CDK4/6 inhibition and interferon-γ - known modulators of antigen presentation - uncovers treatment-specific alterations, connecting the intracellular response to extracellular immune presentation.
Overview
The claims and statistics of this paper haven’t been checked yet.
Run the check — free, no account needed. It reads the open-access text and checks the sources it cites.
Integrity signals
Registry
Cites
Statistics
Figures
Verification
Claims the paper makes
The claims and statistics of this paper haven’t been checked yet.
Run the check — free, no account needed. It reads the open-access text and checks the sources it cites.
Claims other papers make about this one
Each is checked against this paper’s own text: does it say what the citing paper says it does?
In the citing paper
“the MHC class I peptidome of human melanoma cells exposed to the CDK4/CDK6 inhibitor palbociclib is enriched for tumor-associated antigens (TAAs) and peptides from E2F target proteins that are directly implicated in cell cycle blockage (Stopfer et al., 2020).”
From Immunomodulation by targeted anticancer agents (2021) · cites this paper as Stopfer et al., 2020
Self-check
Percentages, sums and reported differences re-computed from the paper’s own numbers.
The self-check needs the paper’s full text.
Citations
Cites
The Sequence Alignment/Map format and SAMtools
Li, H., Handsaker, B., Wysoker, A., Fennell, T., Ruan, J., Homer, N., Marth, G., Abecasis, G., Durbin, R., & 1000 Genome Project Data Processing Subgroup (2009) · Bioinformatics · doi:10.1093/bioinformatics/btp352 · Cited by 62,041
Subramanian, A., Tamayo, P., Mootha, V. K., Mukherjee, S., Ebert, B. L., Gillette, M. A., Paulovich, A., Pomeroy, S. L., Golub, T. R., Lander, E. S., et al. (2005) · Proceedings of the National Academy of Sciences · doi:10.1073/pnas.0506580102 · Cited by 53,625
STAR: ultrafast universal RNA-seq aligner
Dobin, A., Davis, C. A., Schlesinger, F., Drenkow, J., Zaleski, C., Jha, S., Batut, P., Chaisson, M., & Gingeras, T. R. (2013) · Bioinformatics · doi:10.1093/bioinformatics/bts635 · Cited by 51,709
Gene Ontology: tool for the unification of biology
Ashburner, M., Ball, C. A., Blake, J. A., Botstein, D., Butler, H., Cherry, J. M., Davis, A. P., Dolinski, K., Dwight, S. S., Eppig, J. T., et al. (2000) · Nature Genetics · doi:10.1038/75556 · Cited by 43,206
RSEM: accurate transcript quantification from RNA-Seq data with or without a reference genome
Li, B., & Dewey, C. N. (2011) · BMC Bioinformatics · doi:10.1186/1471-2105-12-323 · Cited by 22,179
Szklarczyk, D., Gable, A. L., Lyon, D., Junge, A., Wyder, S., Huerta-Cepas, J., Simonovic, M., Doncheva, N. T., Morris, J. H., Bork, P., et al. (2019) · Nucleic Acids Research · doi:10.1093/nar/gky1131 · Cited by 17,749
Differential expression analysis for sequence count data
Anders, S., & Huber, W. (2010) · Genome Biology · doi:10.1186/gb-2010-11-10-r106 · Cited by 15,581
The Molecular Signatures Database Hallmark Gene Set Collection
Liberzon, A., Birger, C., Thorvaldsdóttir, H., Ghandi, M., Mesirov, J. P., & Tamayo, P. (2015) · Cell Systems · doi:10.1016/j.cels.2015.12.004 · Cited by 13,807
WebLogo: A Sequence Logo Generator: Figure 1Preprint
Crooks, G. E., Hon, G. C., Chandonia, J., & Brenner, S. E. (2004) · Genome Research · doi:10.1101/gr.849004 · Cited by 12,480
Mootha, V. K., Lindgren, C. M., Eriksson, K.-F., Subramanian, A., Sihag, S., Lehar, J., Puigserver, P., Carlsson, E., Ridderstråle, M., Laurila, E., et al. (2003) · Nature Genetics · doi:10.1038/ng1180 · Cited by 10,197
Primary, Adaptive, and Acquired Resistance to Cancer Immunotherapy
Sharma, P., Hu-Lieskovan, S., Wargo, J. A., & Ribas, A. (2017) · Cell · doi:10.1016/j.cell.2017.01.017 · Cited by 5,588
The Gene Ontology Resource: 20 years and still GOing strong
The Gene Ontology Consortium (2019) · Nucleic Acids Research · doi:10.1093/nar/gky1055 · Cited by 4,747
Skyline: an open source document editor for creating and analyzing targeted proteomics experiments
MacLean, B., Tomazela, D. M., Shulman, N., Chambers, M., Finney, G. L., Frewen, B., Kern, R., Tabb, D. L., Liebler, D. C., & MacCoss, M. J. (2010) · Bioinformatics · doi:10.1093/bioinformatics/btq054 · Cited by 4,697
Adverse effects of immune-checkpoint inhibitors: epidemiology, management and surveillance
Martins, F., Sofiya, L., Sykiotis, G. P., Lamine, F., Maillard, M., Fraga, M., Shabafrouz, K., Ribi, C., Cairoli, A., Guex-Crosier, Y., et al. (2019) · Nature Reviews Clinical Oncology · doi:10.1038/s41571-019-0218-0 · Cited by 2,314
Reits, E. A., Hodge, J. W., Herberts, C. A., Groothuis, T. A., Chakraborty, M., K.Wansley, E., Camphausen, K., Luiten, R. M., de Ru, A. H., Neijssen, J., et al. (2006) · The Journal of Experimental Medicine · doi:10.1084/jem.20052494 · Cited by 1,737
CDK4/6 inhibition triggers anti-tumour immunity
Goel, S., DeCristo, M. J., Watt, A. C., BrinJones, H., Sceneay, J., Li, B. B., Khan, N., Ubellacker, J. M., Xie, S., Metzger-Filho, O., et al. (2017) · Nature · doi:10.1038/nature23465 · Cited by 1,513
Jurtz, V. I., Paul, S., Andreatta, M., Marcatili, P., Peters, B., & Nielsen, M. (2017) · The Journal of Immunology · doi:10.4049/jimmunol.1700893 · Cited by 1,476
Characterization of Peptides Bound to the Class I MHC Molecule HLA-A2.1 by Mass Spectrometry
Hunt, D. F., Henderson, R. A., Shabanowitz, J., Sakaguchi, K., Michel, H., Sevilir, N., Cox, A. L., Appella, E., & Engelhard, V. H. (1992) · Science · doi:10.1126/science.1546328 · Cited by 1,198
CDK4/6 Inhibition Augments Antitumor Immunity by Enhancing T-cell Activation
Deng, J., Wang, E. S., Jenkins, R. W., Li, S., Dries, R., Yates, K., Chhabra, S., Huang, W., Liu, H., Aref, A. R., et al. (2018) · Cancer Discovery · doi:10.1158/2159-8290.cd-17-0915 · Cited by 770
Bassani-Sternberg, M., Bräunlein, E., Klar, R., Engleitner, T., Sinitcyn, P., Audehm, S., Straub, M., Weber, J., Slotta-Huspenina, J., Specht, K., et al. (2016) · Nature Communications · doi:10.1038/ncomms13404 · Cited by 693
Emerging Concepts for Immune Checkpoint Blockade-Based Combination Therapies
Zappasodi, R., Merghoub, T., & Wolchok, J. D. (2018) · Cancer Cell · doi:10.1016/j.ccell.2018.03.005 · Cited by 525
Targeting CDK4/6 in patients with cancer
Hamilton, E. P., & Infante, J. R. (2016) · Cancer Treatment Reviews · doi:10.1016/j.ctrv.2016.03.002 · Cited by 495
Immunotherapy and targeted therapy combinations in metastatic breast cancer
Esteva, F. J., Hubbard-Lucey, V. M., Tang, J., & Pusztai, L. (2019) · The Lancet Oncology · doi:10.1016/s1470-2045(19)30026-9 · Cited by 458
Liu, L., Mayes, P. A., Eastman, S., Shi, H., Yadavilli, S., Zhang, T., Yang, J., Seestaller-Wehr, L., Zhang, S.-Y., Hopson, C., et al. (2015) · Clinical Cancer Research · doi:10.1158/1078-0432.ccr-14-2339 · Cited by 446
Bassani‐Sternberg, M., Pletscher-Frankild, S., Jensen, L. J., & Mann, M. (2015) · Molecular & Cellular Proteomics · doi:10.1074/mcp.m114.042812 · Cited by 420
Huang, J., Brameshuber, M. O., Zeng, X., Xie, J., Li, Q., Chien, Y., Valitutti, S., & Davis, M. M. (2013) · Immunity · doi:10.1016/j.immuni.2013.08.036 · Cited by 388
Liu, W. M., Fowler, D. W., Smith, P., & Dalgleish, A. G. (2009) · British Journal of Cancer · doi:10.1038/sj.bjc.6605465 · Cited by 362
Mass spectrometry–based identification of MHC-bound peptides for immunopeptidomics
Purcell, A. W., Ramarathinam, S. H., & Ternette, N. (2019) · Nature Protocols · doi:10.1038/s41596-019-0133-y · Cited by 362
Dabrafenib, trametinib and pembrolizumab or placebo in BRAF-mutant melanoma
Ascierto, P. A., Ferrucci, P. F., Fisher, R. A., Vecchio, M. D., Atkinson, V. G., Schmidt, H., Schachter, J., Queirolo, P., Long, G. V., Giacomo, A. M. D., et al. (2019) · Nature Medicine · doi:10.1038/s41591-019-0448-9 · Cited by 331
Proteomics of Melanoma Response to Immunotherapy Reveals Mitochondrial Dependence
Harel, M., Ortenberg, R., Varanasi, S. K., Mangalhara, K. C., Mardamshina, M., Markovits, E., Baruch, E. N., Tripple, V., Arama-Chayoth, M., Greenberg, E., et al. (2019) · Cell · doi:10.1016/j.cell.2019.08.012 · Cited by 328
Generation of peptide–MHC class I complexes through UV-mediated ligand exchange
Rodenko, B., Toebes, M., Hadrup, S. R., van Esch, W. J. E., Molenaar, A. M., Schumacher, T. N., & Ovaa, H. (2006) · Nature Protocols · doi:10.1038/nprot.2006.121 · Cited by 320
Signaling through cyclin D-dependent kinases
Choi, Y., & Anders, L. (2013) · Oncogene · doi:10.1038/onc.2013.137 · Cited by 289
Current State of Immunotherapy for Treatment of Glioblastoma
McGranahan, T. M., Therkelsen, K. E., Ahmad, S., & Nagpal, S. (2019) · Current Treatment Options in Oncology · doi:10.1007/s11864-019-0619-4 · Cited by 287
Antigen presentation profiling reveals recognition of lymphoma immunoglobulin neoantigens
Khodadoust, M. S., Olsson, N., Wagar, L. E., Haabeth, O. A. W., Chen, B., Swaminathan, K., Rawson, K., Liu, C. L., Steiner, D. F., Lund, P. J., et al. (2017) · Nature · doi:10.1038/nature21433 · Cited by 261
Yang, Y., Xiang, Z., Ertl, H. C. J., & Wilson, J. M. (1995) · Proceedings of the National Academy of Sciences · doi:10.1073/pnas.92.16.7257 · Cited by 260
Bassani‐Sternberg, M., Chong, C., Guillaume, P., Solleder, M., Pak, H., Gannon, P. O., Kandalaft, L. E., Coukos, G., & Gfeller, D. (2017) · PLoS Computational Biology · doi:10.1371/journal.pcbi.1005725 · Cited by 242
Atezolizumab plus cobimetinib and vemurafenib in BRAF-mutated melanoma patients
Sullivan, R. J., Hamid, O., Gonzalez, R. C., Infante, J. R., Patel, M. R., Hodi, F. S., Lewis, K. D., Tawbi, H. A., Hernandez, G., Wongchenko, M. J., et al. (2019) · Nature Medicine · doi:10.1038/s41591-019-0474-7 · Cited by 242
Gallien, S., Kim, S.-Y., & Domon, B. (2015) · Molecular & Cellular Proteomics · doi:10.1074/mcp.o114.043968 · Cited by 213
CDK 4/6 Inhibitors as Single Agent in Advanced Solid Tumors
Schettini, F., Santo, I. D., Rea, C. G., Placido, P. D., Formisano, L., Giuliano, M., Arpino, G., Laurentiis, M. D., Puglisi, F., Placido, S. D., et al. (2018) · Frontiers in Oncology · doi:10.3389/fonc.2018.00608 · Cited by 201
Franco, J., Balaji, U., Freinkman, E., Witkiewicz, A. K., & Knudsen, E. S. (2016) · Cell Reports · doi:10.1016/j.celrep.2015.12.094 · Cited by 199
Identification of class I MHC-associated phosphopeptides as targets for cancer immunotherapy
Zarling, A. L., Polefrone, J. M., Evans, A. M., Mikesh, L. M., Shabanowitz, J., Lewis, S. T., Engelhard, V. H., & Hunt, D. F. (2006) · Proceedings of the National Academy of Sciences · doi:10.1073/pnas.0604045103 · Cited by 196
Chong, C., Marino, F., Pak, H., Racle, J., Daniel, R. T., Müller, M., Gfeller, D., Coukos, G., & Bassani‐Sternberg, M. (2017) · Molecular & Cellular Proteomics · doi:10.1074/mcp.tir117.000383 · Cited by 188
Ribosome Biogenesis and Control of Cell Proliferation: p53 Is Not Alone
Donati, G., Montanaro, L., & Derenzini, M. (2012) · Cancer Research · doi:10.1158/0008-5472.can-11-3992 · Cited by 175
Kinase Regulation of Human MHC Class I Molecule Expression on Cancer Cells
Brea, E. J., Oh, C. Y., Manchado, E., Budhu, S., Gejman, R. S., Mo, G., Mondello, P., Han, J. E., Jarvis, C. A., Ulmert, D., et al. (2016) · Cancer Immunology Research · doi:10.1158/2326-6066.cir-16-0177 · Cited by 171
Ovarian Cancer Immunotherapy: Turning up the Heat
Ghisoni, E., Imbimbo, M., Zimmermann, S., & Valabrega, G. (2019) · International Journal of Molecular Sciences · doi:10.3390/ijms20122927 · Cited by 162
The MHC I immunopeptidome conveys to the cell surface an integrative view of cellular regulation
Caron, É., Vincent, K., Fortier, M., Laverdure, J., Bramoullé, A., Hardy, M., Voisin, G., Roux, P. P., Lemieux, S., Thibault, P., et al. (2011) · Molecular Systems Biology · doi:10.1038/msb.2011.68 · Cited by 126
Combination of Immunotherapy With Targeted Therapy: Theory and Practice in Metastatic Melanoma
Yu, C., Liu, X., Yang, J., Zhang, M., Jin, H., Ma, X., & Shi, H. (2019) · Frontiers in Immunology · doi:10.3389/fimmu.2019.00990 · Cited by 126
Schittenhelm, R. B., Sian, T. C. C. L. K., Wilmann, P. G., Dudek, N. L., & Purcell, A. W. (2014) · Arthritis & Rheumatology · doi:10.1002/art.38963 · Cited by 122
Hashizume, R., Zhang, A., Mueller, S., Prados, M. D., Lulla, R. R., Goldman, S., Saratsis, A. M., Mazar, A. P., Stegh, A. H., Cheng, S., et al. (2016) · Neuro-Oncology · doi:10.1093/neuonc/now106 · Cited by 121
The nature and extent of contributions by defective ribosome products to the HLA peptidome
Bourdetsky, D., Schmelzer, C. E. H., & Admon, A. (2014) · Proceedings of the National Academy of Sciences · doi:10.1073/pnas.1321902111 · Cited by 102
A catalog of HLA type, HLA expression, and neo-epitope candidates in human cancer cell lines
Boegel, S., Löwer, M., Bukur, T., Şahin, U., & Castle, J. C. (2014) · OncoImmunology · doi:10.4161/21624011.2014.954893 · Cited by 102
Wu, T., Guan, J. Z., Handel, A., Tscharke, D. C., Sidney, J., Sette, A., Wakim, L. M., Sng, X. Y. X., Thomas, P. G., Croft, N. P., et al. (2019) · Nature Communications · doi:10.1038/s41467-019-10661-8 · Cited by 98
A Chemoproteomic Strategy for Direct and Proteome-Wide Covalent Inhibitor Target-Site Identification
Browne, C. M., Jiang, B., Ficarro, S. B., Doctor, Z. M., Johnson, J. L., Card, J. D., Sivakumaren, S. C., Alexander, W. M., Yaron, T. M., Murphy, C. J., et al. (2018) · Journal of the American Chemical Society · doi:10.1021/jacs.8b07911 · Cited by 94
Scholtalbers, J., Boegel, S., Bukur, T., Byl, M., Goerges, S., Sorn, P., Löewer, M., Şahin, U., & Castle, J. C. (2015) · Genome Medicine · doi:10.1186/s13073-015-0240-5 · Cited by 89
George, S., Rini, B. I., & Hammers, H. J. (2019) · JAMA Oncology · doi:10.1001/jamaoncol.2018.4604 · Cited by 84
Nyamao, R. M., Wu, J., Li, Y., Xiao, X., & Zhang, F. (2018) · Biochimica et Biophysica Acta (BBA) - Reviews on Cancer · doi:10.1016/j.bbcan.2018.11.003 · Cited by 83
Direct Detection and Quantification of Neoantigens
Wang, Q., Douglass, J., Hwang, M. S., Hsiue, E. H.-C., Mog, B. J., Zhang, M., Papadopoulos, N., Kinzler, K. W., Zhou, S., & Vogelstein, B. (2019) · Cancer Immunology Research · doi:10.1158/2326-6066.cir-19-0107 · Cited by 81
He, S., Yin, T., Li, D., Gao, X., Wan, Y., Ma, X., Ye, T., Guo, F., Sun, J., Lin, Z., et al. (2013) · Journal of Translational Medicine · doi:10.1186/1479-5876-11-186 · Cited by 76
Hassan, C., Kester, M. G. D., Oudgenoeg, G., de Ru, A. H., Janssen, G. M. C., Drijfhout, J. W., Spaapen, R. M., Jiménez, C. R., Heemskerk, M. H. M., Falkenburg, J. H. F., et al. (2014) · Journal of Proteomics · doi:10.1016/j.jprot.2014.07.009 · Cited by 75
Bozzacco, L., Yu, H., Zebroski, H. A., Dengjel, J., Deng, H., Mojsov, S., & Steinman, R. M. (2011) · Journal of Proteome Research · doi:10.1021/pr200503g · Cited by 68
Specific MHC-I Peptides Are Induced Using PROTACs
Jensen, S. M., Potts, G. K., Ready, D. B., & Patterson, M. J. S. (2018) · Frontiers in Immunology · doi:10.3389/fimmu.2018.02697 · Cited by 67
Direct quantitation of MHC‐bound peptide epitopes by selected reaction monitoring
Tan, C. T., Croft, N. P., Dudek, N. L., Williamson, N. A., & Purcell, A. W. (2011) · PROTEOMICS · doi:10.1002/pmic.201000531 · Cited by 64
Rebalancing Protein Homeostasis Enhances Tumor Antigen Presentation
Jaeger, A. M., Stopfer, L. E., Lee, S., Gaglia, G., Sandel, D. A., Santagata, S., Lin, N., Trepel, J. B., White, F. M., Jacks, T., et al. (2019) · Clinical Cancer Research · doi:10.1158/1078-0432.ccr-19-0596 · Cited by 61
Khallouf, H., Märten, A., Serba, S., Teichgräber, V., Büchler, M. W., Jäger, D., & Schmidt, J. (2012) · Journal of Immunotherapy · doi:10.1097/cji.0b013e31824b3a76 · Cited by 58
Mapping the HLA Ligandome of Colorectal Cancer Reveals an Imprint of Malignant Cell Transformation
Loeffler, M. W., Kowalewski, D. J., Backert, L., Bernhardt, J., Adam, P., Schuster, H., Dengler, F., Backes, D., Kopp, H., Beckert, S., et al. (2018) · Cancer Research · doi:10.1158/0008-5472.can-17-1745 · Cited by 55
Beyond the Cell Cycle: Enhancing the Immune Surveillance of Tumors Via CDK4/6 Inhibition
Chaikovsky, A. C., & Sage, J. (2018) · Molecular Cancer Research · doi:10.1158/1541-7786.mcr-18-0201 · Cited by 50
Gloger, A., Ritz, D., Fugmann, T., & Neri, D. (2016) · Cancer Immunology Immunotherapy · doi:10.1007/s00262-016-1897-3 · Cited by 45
Moritz, A., Anjanappa, R., Wagner, C., Bunk, S., Hofmann, M., Pszolla, G., Saikia, A., García-Alai, M., Meijers, R., Rammensee, H., et al. (2019) · Science Immunology · doi:10.1126/sciimmunol.aav0860 · Cited by 43
Hogan, K. T., Sutton, J. N., Chu, K. U., Busby, J., Shabanowitz, J., Hunt, D. F., & Slingluff, C. L. (2004) · Cancer Immunology Immunotherapy · doi:10.1007/s00262-004-0592-y · Cited by 42
Zarling, A. L., Obeng, R. C., Desch, A. N., Pinczewski, J., Cummings, K. L., Deacon, D. H., Conaway, M. R., Slingluff, C. L., & Engelhard, V. H. (2014) · Cancer Research · doi:10.1158/0008-5472.can-14-0043 · Cited by 37
Murphy, J. P., Yu, Q., Konda, P., Paulo, J. A., Jedrychowski, M. P., Kowalewski, D. J., Schuster, H., Kim, Y., Clements, D. R., Jain, A., et al. (2019) · Analytical Chemistry · doi:10.1021/acs.analchem.8b05616 · Cited by 36
Labots, M., van der Mijn, J. C., Beekhof, R., Piersma, S. R., Haas, R. R. D. G., Pham, T. V., Knol, J. C., Dekker, H., van Grieken, N. C. T., Verheul, H. M. W., et al. (2017) · Journal of Proteomics · doi:10.1016/j.jprot.2017.04.014 · Cited by 34
Lista, A., Arbilla, S., & Langer, S. Z. (1988) · Journal of Neurochemistry · doi:10.1111/j.1471-4159.1988.tb01106.x · Cited by 26
Bogunović, B., Srinivasan, P., Ueda, Y., Tomita, Y. A., & Marić, M. (2010) · PLoS ONE · doi:10.1371/journal.pone.0010599 · Cited by 25
Shetty, V., Nickens, Z., Testa, J. S., Hafner, J., Sinnathamby, G., & Philip, R. (2012) · Journal of Proteomics · doi:10.1016/j.jprot.2012.03.044 · Cited by 25
Bijen, H. M., Hassan, C., Kester, M. G. D., Janssen, G. M. C., Hombrink, P., de Ru, A. H., Drijfhout, J. W., Meiring, H. D., de Jong, A. P. J. M., Falkenburg, J. H. F., et al. (2017) · PROTEOMICS · doi:10.1002/pmic.201700250 · Cited by 22
Salvucci, M., Poynter, L., Minerzami, R., Carberry, S., O’Byrne, R., Cremona, M., Hennessy, B. T., Veselkov, K., Kinross, J. K., & Prehn, J. H. M. (2018) · Cancer Research · doi:10.1158/1538-7445.am2018-4627 · Cited by 10
Cited by
Sorted by citations
A guide to antigen processing and presentation
Pishesha, N., Harmand, T. J., & Ploegh, H. L. (2022) · Nature Reviews Immunology · doi:10.1038/s41577-022-00707-2 · Cited by 805
Cellular Senescence Is Immunogenic and Promotes Antitumor Immunity
Marín, I., Boix, O., García-Garijo, A., Sirois, I., Caballé, A., Zarzuela, E., Ruano, I., Attolini, C. S., Prats, N., Lopez-Dominguez, J. A., et al. (2022) · Cancer Discovery · doi:10.1158/2159-8290.cd-22-0523 · Cited by 365
Proteomics of Melanoma Response to Immunotherapy Reveals Mitochondrial Dependence
Harel, M., Ortenberg, R., Varanasi, S. K., Mangalhara, K. C., Mardamshina, M., Markovits, E., Baruch, E. N., Tripple, V., Arama-Chayoth, M., Greenberg, E., et al. (2019) · Cell · doi:10.1016/j.cell.2019.08.012 · Cited by 328
Towards targeting of shared mechanisms of cancer metastasis and therapy resistance
Weiß, F., Lauffenburger, D. A., & Friedl, P. (2022) · Nature reviews. Cancer · doi:10.1038/s41568-021-00427-0 · Cited by 295
Identification of tumor antigens with immunopeptidomics
Chong, C., Coukos, G., & Bassani-Sternberg, M. (2022) · Nature Biotechnology · doi:10.1038/s41587-021-01038-8 · Cited by 232
Metadata
- Authors
- Stopfer, L. E., Mesfin, J. M., Joughin, B. A., Lauffenburger, D. A., & White, F. M.
- Affiliations
- Koch Institute for Integrative Cancer Research At MIT (US)
- Massachusetts Institute of Technology (US)
- Corresponding author
- White, Forest M.
- Venue
- Nature Communications
- Published
- 2020-06-02
- Volume
- 11
- Issue
- 1
- Pages
- 2760-2760
- ISSN
- 2041-1723 (ISSN-L)
- PMC
- PMC7265461
- OpenAlex
- W3031716951
- Cited by
- 109
- References
- 79
- Citations by year
- 2026: 17 · 2025: 21 · 2024: 11 · 2023: 23 · 2022: 14 · 2021: 16 · 2020: 6
- FWCI
- 4.76
- Type
- journal article
- Language
- en
- Open access
- gold
- doi.org
- Locations
- Nature Communications (publishedVersion, cc-by)
- bioRxiv (Cold Spring Harbor Laboratory) (acceptedVersion)
- PubMed Central (publishedVersion, cc-by)
- PubMed (publishedVersion)
- RePEc: Research Papers in Economics (submittedVersion)
- DOAJ (DOAJ: Directory of Open Access Journals) (submittedVersion, cc-by-sa)
- DSpace@MIT (Massachusetts Institute of Technology) (submittedVersion, cc-by-nc)
- Funders
- Melanoma Research Alliance (565436)
- Array BioPharma
- Koch Institute for Integrative Cancer Research, Massachusetts Institute of Technology
- National Institutes of Health (CA210180)
- National Heart, Lung, and Blood Institute (T32HL105373)
- National Cancer Institute (U54CA210180, P30CA014051)
- National Institute of Environmental Health Sciences (T32ES007020)
- Topics
- Life Sciences › Biochemistry, Genetics and Molecular Biology › Molecular Biology › vaccines and immunoinformatics approaches
- Physical Sciences › Chemistry › Spectroscopy › Advanced Proteomics Techniques and Applications
- Health Sciences › Medicine › Oncology › Cancer Immunotherapy and Biomarkers
- Keywords
- immunopeptidomics, CDK4/6 inhibition, absolute quantification, melanoma, interferon-gamma, antigen presentation, cancer immunotherapy
- MeSH terms
- Antigens, Cell Line, Humans, Immunotherapy, Interferon-gamma, Peptides, Mass Spectrometry, Histocompatibility Antigens Class I, Antigen Presentation, Proteomics, Cyclin-Dependent Kinase 4, Cyclin-Dependent Kinase 6
About these checks
Registry, retraction, Cites and statistics results are computed, not judged, with one exception: a printed reference that no index lists is read once by a model before it counts as a citation error. Claims are extracted by a model and kept only when their quote appears verbatim in the text; each cited source is then checked, with a model’s help, for whether it says what the claim relies on. Those verdicts can be wrong — read the claim’s quote and the cited source before relying on one.
Statistics and arithmetic are recomputed, not judged.
Confidence bands are shown only for fields calibrated on our annotated test set. None is calibrated yet, so no band is shown.
What counts as a claim ›How we measure confidence ›How we check this ›
Are you an author, or do you see a problem with this page? Request a review
