Cited by 180

The DOI matches its Crossref record; 21 of the 21 references it cites were found in a registry or an index.

The neuromuscular junction is a focal point of mTORC1 signaling in sarcopenia

Ham, Daniel J., Börsch, Anastasiya, Lin, Shuo, Thürkauf, Marco, Weihrauch, Martin, Reinhard, Judith R., Delezie, Julien, Battilana, Fabienne, Wang, Xueyong, Kaiser, Marco S., Guridi, Maitea, Sinnreich, Michael, Rich, Mark M., Mittal, Nitish, Tintignac, Lionel A., Handschin, Christoph, Zavolan, Mihaela, Rüegg, Markus A.·2020·Nature Communications

Abstract

With human median lifespan extending into the 80s in many developed countries, the societal burden of age-related muscle loss (sarcopenia) is increasing. mTORC1 promotes skeletal muscle hypertrophy, but also drives organismal aging. Here, we address the question of whether mTORC1 activation or suppression is beneficial for skeletal muscle aging. We demonstrate that chronic mTORC1 inhibition with rapamycin is overwhelmingly, but not entirely, positive for aging mouse skeletal muscle, while genetic, muscle fiber-specific activation of mTORC1 is sufficient to induce molecular signatures of sarcopenia. Through integration of comprehensive physiological and extensive gene expression profiling in young and old mice, and following genetic activation or pharmacological inhibition of mTORC1, we establish the phenotypically-backed, mTORC1-focused, multi-muscle gene expression atlas, SarcoAtlas (https://sarcoatlas.scicore.unibas.ch/), as a user-friendly gene discovery tool. We uncover inter-muscle divergence in the primary drivers of sarcopenia and identify the neuromuscular junction as a focal point of mTORC1-driven muscle aging.

Overview

The claims and statistics of this paper haven’t been checked yet.

Run the check — free, no account needed. It reads the open-access text and checks the sources it cites.

A few free checks a day · papers already verified open instantly · results are public

Integrity signals

Registry

Crossref · 10.1038/s41467-020-18140-1

Cites

21 of 21 references verified0 citation errors · 0 not checkable

Statistics

Figures

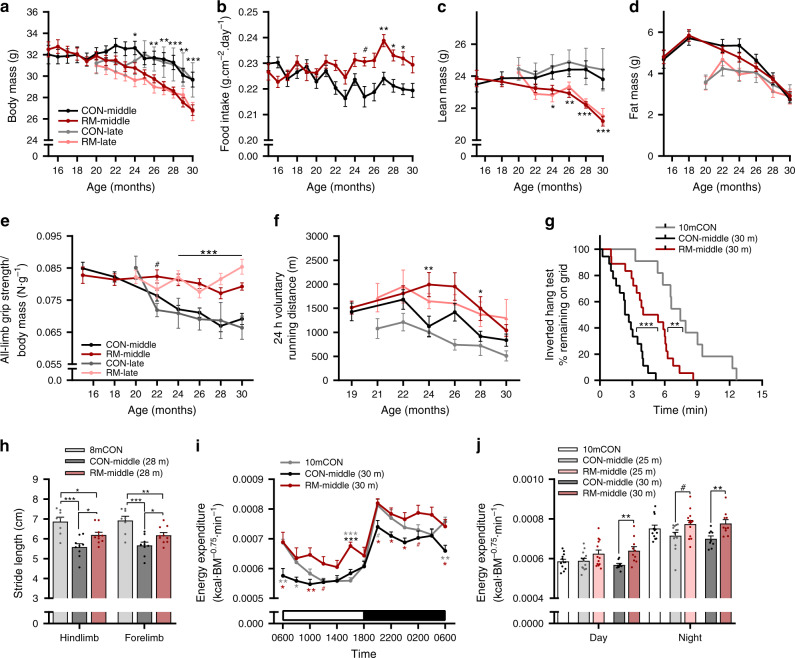
Fig. 1 Rapamycin slows age-related decrements in whole-body muscle function and metabolism. a Body mass for mouse groups receiving rapamycin (~4 mg kg−1 day−1) or control diet beginning at 15 months (CON-middle and RM-middle) or 20 months (CON-late and RM-late) of age; n = 18 (CON-middle), 17 (RM-middle), 5 (CON-late), and 9 (RM-late) mice. b Mean daily food intake for middle-aged groups; n = 18 (CON-middle) and 17 (RM-middle) mice. Bimonthly recordings of whole-body lean (c) and fat mass (d); n = 18 (CON-middle), 17 (RM-middle), 6 (CON-late), and 9 (RM-late) mice. e All-limb grip strength normalized to body mass; n = 19 (CON-middle), 18 (RM-middle), 6 (CON-late), and 9 (RM-late) mice. f Twenty-four hours of voluntary running-wheel distance; n = 16 (CON-middle), 15 (RM-middle), 6 (CON-late), and 9 (RM-late) mice. Note that improvements by rapamycin were similar, irrespective of the time of treatment onset. g Kaplan–Meier plot for the inverted grip-hang test performed prior to endpoint measures at 30 months of age for the middle-aged group; n = 11 (10mCON), 18 (CON-middle), and 18 (RM-middle) mice. h Gait analysis of forelimb- and hindlimb-stride length at 28 months of age for middle-aged groups; n = 8 (8mCON), 9 (CON-middle), and 10 (RM-middle) mice. i Whole-body metabolic analysis of energy expenditure normalized to body surface area reported every 2 h across one full day (white)/night (black) cycle in the month prior to endpoint measures and j mean day and night values recorded at 25 and 30 months of age for middle-aged groups; n = 12 (10mCON), 14 (25mCON), 13 (25mRM), 9 (30mCON), and 10 (30mRM) mice. Data are presented as mean ± SEM. For a, b, e, and f, both control groups (CON-late and CON-middle) and both RM groups (RM-late and RM-middle) were combined for statistical comparisons. Two-way repeated-measure ANOVA with Sidak or Tukey post hoc tests (a–f, i–j), Mantel–Cox log rank (g), and one-way ANOVA with Fisher’s LSD post hoc tests (h) was used to compare the data. *, **, and *** denote a significant difference between groups of P < 0.05, P < 0.01, and P < 0.001, respectively. # denotes a trend where 0.05 < P < 0.10. Colored asterisks refer to the group of comparison.
Fig. 1 Rapamycin slows age-related decrements in whole-body muscle function and metabolism. a Body mass for mouse groups receiving rapamycin (~4 mg kg−1 day−1) or control diet beginning at 15 months (CON-middle and RM-middle) or 20 months (CON-late and RM-late) of age; n = 18 (CON-middle), 17 (RM-middle), 5 (CON-late), and 9 (RM-late) mice. b Mean daily food intake for middle-aged groups; n = 18 (CON-middle) and 17 (RM-middle) mice. Bimonthly recordings of whole-body lean (c) and fat mass (d); n = 18 (CON-middle), 17 (RM-middle), 6 (CON-late), and 9 (RM-late) mice. e All-limb grip strength normalized to body mass; n = 19 (CON-middle), 18 (RM-middle), 6 (CON-late), and 9 (RM-late) mice. f Twenty-four hours of voluntary running-wheel distance; n = 16 (CON-middle), 15 (RM-middle), 6 (CON-late), and 9 (RM-late) mice. Note that improvements by rapamycin were similar, irrespective of the time of treatment onset. g Kaplan–Meier plot for the inverted grip-hang test performed prior to endpoint measures at 30 months of age for the middle-aged group; n = 11 (10mCON), 18 (CON-middle), and 18 (RM-middle) mice. h Gait analysis of forelimb- and hindlimb-stride length at 28 months of age for middle-aged groups; n = 8 (8mCON), 9 (CON-middle), and 10 (RM-middle) mice. i Whole-body metabolic analysis of energy expenditure normalized to body surface area reported every 2 h across one full day (white)/night (black) cycle in the month prior to endpoint measures and j mean day and night values recorded at 25 and 30 months of age for middle-aged groups; n = 12 (10mCON), 14 (25mCON), 13 (25mRM), 9 (30mCON), and 10 (30mRM) mice. Data are presented as mean ± SEM. For a, b, e, and f, both control groups (CON-late and CON-middle) and both RM groups (RM-late and RM-middle) were combined for statistical comparisons. Two-way repeated-measure ANOVA with Sidak or Tukey post hoc tests (a–f, i–j), Mantel–Cox log rank (g), and one-way ANOVA with Fisher’s LSD post hoc tests (h) was used to compare the data. *, **, and *** denote a significant difference between groups of P < 0.05, P < 0.01, and P < 0.001, respectively. # denotes a trend where 0.05 < P < 0.10. Colored asterisks refer to the group of comparison.CC BY · PubMed Central
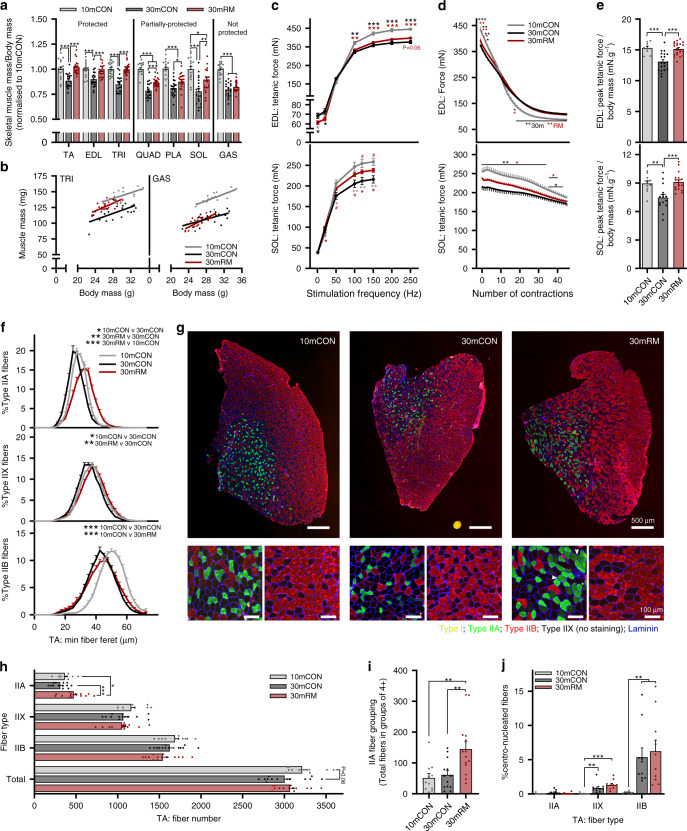
Fig. 2 Rapamycin attenuates the age-related loss of muscle size and function. a Muscle mass for quadriceps (QUAD), gastrocnemius (GAS), tibialis anterior (TA), plantaris (PLA), extensor digitorum longus (EDL), soleus (SOL), and triceps brachii (TRI) was averaged across both limbs, normalized to body mass and then to 10-month-old control mice. b Scatterplot and linear regression of the relationship between body and muscle mass of a forelimb (TRI) and the non-rapamycin-responsive hindlimb (GAS) muscle. Isolated muscle function parameters, including (c) force-frequency curve, d fatigue response to multiple stimulations, and (e) peak force normalized to body mass for EDL (top panel) and SOL muscle (bottom panel). f Fiber-type-specific cross-sectional area analyzed on whole cross sections from TA muscle, stained with antibodies against type I (yellow), type IIA (green), and type IIB (red) fibers as well as laminin (blue), while fibers without staining were classified as IIX. g Representative images with magnification of IIA (green fiber, left bottom)-rich and IIB (red fiber, right bottom)-rich regions. White arrows indicate grouping (four or more neighboring fibers) of IIA fibers in rapamycin-treated mice. h Mean total and fiber-type-specific fiber number from whole TA cross sections. i Counts of IIA fibers in groups of four or more neighboring fibers, per cross section, and j the percentage of fibers with centralized nuclei. For f, between-group statistical comparisons were performed on the mean fiber minimum Feret. Group numbers for 10mCON are n = 17 (a, b), 10 (c, e: EDL), 11 (c, e: SOL), 8 (d: EDL), 9 (d: SOL), 11 (f–i), and 9 (j) mice, for 30mCON n = 20 (a, b), 19 (c–e: EDL), 15 (c–e: SOL), 13 (f–i), and 10 (j) mice, and for 30mRM n = 23 (a, b), 22 (c–e: EDL), 18 (c, e: SOL), 17 (d: SOL), 14 (f–i), and 10 (j) mice. Data are presented as mean ± SEM. One-way (a and e–j) or two-way repeated- measure (c, d) ANOVAs with Fisher’s LSD or Tukey’s (when ANOVA was not significant) post hoc tests were used to compare between data. *, **, and *** denote a significant difference between groups of P < 0.05, P < 0.01, and P < 0.001, respectively. Colored asterisks refer to the group of comparison.
Fig. 2 Rapamycin attenuates the age-related loss of muscle size and function. a Muscle mass for quadriceps (QUAD), gastrocnemius (GAS), tibialis anterior (TA), plantaris (PLA), extensor digitorum longus (EDL), soleus (SOL), and triceps brachii (TRI) was averaged across both limbs, normalized to body mass and then to 10-month-old control mice. b Scatterplot and linear regression of the relationship between body and muscle mass of a forelimb (TRI) and the non-rapamycin-responsive hindlimb (GAS) muscle. Isolated muscle function parameters, including (c) force-frequency curve, d fatigue response to multiple stimulations, and (e) peak force normalized to body mass for EDL (top panel) and SOL muscle (bottom panel). f Fiber-type-specific cross-sectional area analyzed on whole cross sections from TA muscle, stained with antibodies against type I (yellow), type IIA (green), and type IIB (red) fibers as well as laminin (blue), while fibers without staining were classified as IIX. g Representative images with magnification of IIA (green fiber, left bottom)-rich and IIB (red fiber, right bottom)-rich regions. White arrows indicate grouping (four or more neighboring fibers) of IIA fibers in rapamycin-treated mice. h Mean total and fiber-type-specific fiber number from whole TA cross sections. i Counts of IIA fibers in groups of four or more neighboring fibers, per cross section, and j the percentage of fibers with centralized nuclei. For f, between-group statistical comparisons were performed on the mean fiber minimum Feret. Group numbers for 10mCON are n = 17 (a, b), 10 (c, e: EDL), 11 (c, e: SOL), 8 (d: EDL), 9 (d: SOL), 11 (f–i), and 9 (j) mice, for 30mCON n = 20 (a, b), 19 (c–e: EDL), 15 (c–e: SOL), 13 (f–i), and 10 (j) mice, and for 30mRM n = 23 (a, b), 22 (c–e: EDL), 18 (c, e: SOL), 17 (d: SOL), 14 (f–i), and 10 (j) mice. Data are presented as mean ± SEM. One-way (a and e–j) or two-way repeated- measure (c, d) ANOVAs with Fisher’s LSD or Tukey’s (when ANOVA was not significant) post hoc tests were used to compare between data. *, **, and *** denote a significant difference between groups of P < 0.05, P < 0.01, and P < 0.001, respectively. Colored asterisks refer to the group of comparison.CC BY · PubMed Central
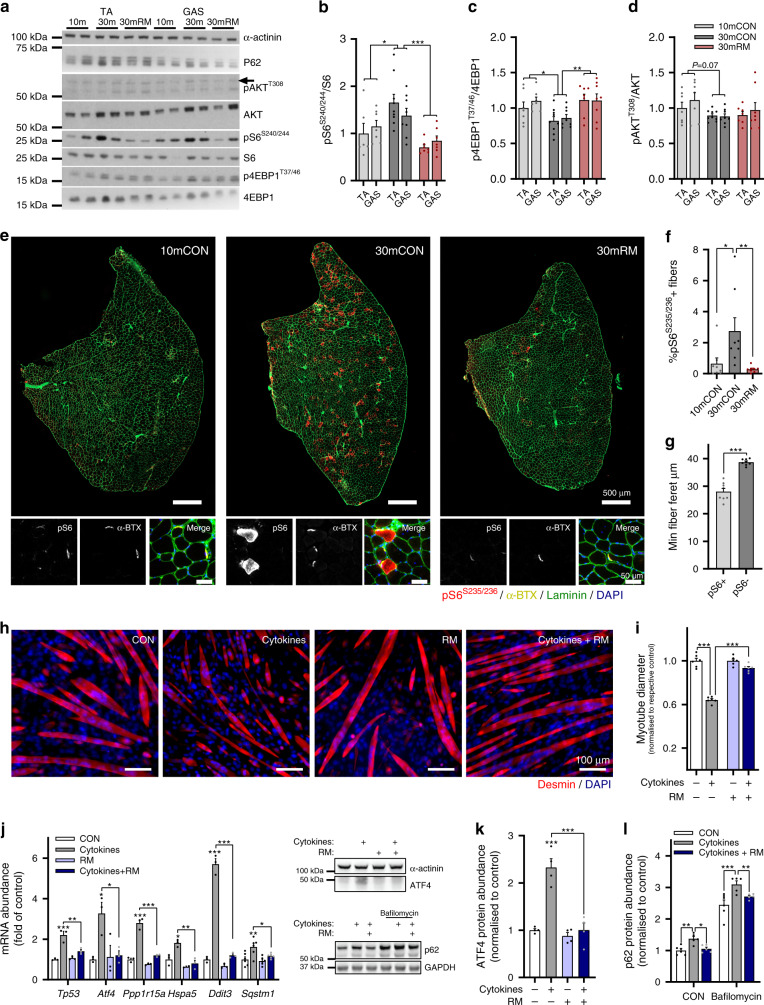
Fig. 3 Rapamycin-sensitive mTORC1 activity increases in sarcopenic muscle fibers and drives muscle wasting in vitro. a Representative western blot analysis of AKT-mTORC1 pathway components in 10mCON, 30mCON, and 30mRM in both the tibialis anterior (TA) and gastrocnemius (GAS) muscle. Similar results were obtained for each protein across three separate gels with different samples. Quantification of western blots showing the abundance of phosphorylated protein normalized to total protein for (b) S6, (c) 4EBP1, and (d) AKT. e Representative images of TA cross sections stained for pS6S235/236 (red), α-bungarotoxin (neuromuscular junctions (NMJs), yellow), laminin (green), and DAPI (blue), and magnification of regions containing NMJs. Scale bars in full-section and enlarged images are 50 µm and 5 µm, respectively. f Quantification of the percentage of pS6S235/236-positive fibers in 10mCON, 30mCON, and 30mRM groups. g Quantification of minimum fiber Feret for pS6S235/236-positive and pS6S235/236-negative fibers in 30-month-old TA muscle. h Representative images of C2C12 myotubes incubated for 24 h in differentiation media (CON) or media containing 10 nM rapamycin, 20 ng ml−1 TNFα, and 100 ng ml−1 IFNγ (cytokines) or cytokines and rapamycin (cytokines + RM), and i quantification of myotube diameter. j RT-qPCR analysis of genes associated with ER stress and muscle wasting in C2C12 myotubes after 6 h of incubation in CON, cytokines, rapamycin, or cytokines+rapamycin. k Quantification and representative western blot image (left, upper) of ATF4 protein abundance after 6 h of incubation in differentiation media with or without cytokines and rapamycin (RM). l Quantification of p62 protein abundance and representative western blot image (left, lower) in differentiation media (CON) or media containing the autophagy-flux inhibitor bafilomycin (200 nM) after 4 h of incubation in media with or without cytokines and rapamycin (24 h). Group numbers for b are n = 6 mice for TA and seven for GAS (10mCON), eight for 30mCON, and seven for 30mRM. For c and d, n = 7 mice (10mCON), eight (30mCON), seven for TA, and eight for GAS (30RM). For f–g, n = 8. For h–i, n = 6 wells across two separate experiments. For j, n = 6 wells. For k, n = 4 wells. For l, n = 6 (CON) and five (cytokines and cytokines+RM) wells. Data are mean ± SEM. Two-way repeated-measure ANOVAs with Sidak post hoc tests (b–d, i), one-way ANOVAs with Fisher’s LSD (f), Tukey’s (j, k) post hoc tests, or student’s two-sided t test (g), were used to compare between data. *, **, and *** denote a significant difference between groups of P < 0.05, P < 0.01, and P < 0.001, respectively. Where 0.05 < P < 0.1, P values are reported.
Fig. 3 Rapamycin-sensitive mTORC1 activity increases in sarcopenic muscle fibers and drives muscle wasting in vitro. a Representative western blot analysis of AKT-mTORC1 pathway components in 10mCON, 30mCON, and 30mRM in both the tibialis anterior (TA) and gastrocnemius (GAS) muscle. Similar results were obtained for each protein across three separate gels with different samples. Quantification of western blots showing the abundance of phosphorylated protein normalized to total protein for (b) S6, (c) 4EBP1, and (d) AKT. e Representative images of TA cross sections stained for pS6S235/236 (red), α-bungarotoxin (neuromuscular junctions (NMJs), yellow), laminin (green), and DAPI (blue), and magnification of regions containing NMJs. Scale bars in full-section and enlarged images are 50 µm and 5 µm, respectively. f Quantification of the percentage of pS6S235/236-positive fibers in 10mCON, 30mCON, and 30mRM groups. g Quantification of minimum fiber Feret for pS6S235/236-positive and pS6S235/236-negative fibers in 30-month-old TA muscle. h Representative images of C2C12 myotubes incubated for 24 h in differentiation media (CON) or media containing 10 nM rapamycin, 20 ng ml−1 TNFα, and 100 ng ml−1 IFNγ (cytokines) or cytokines and rapamycin (cytokines + RM), and i quantification of myotube diameter. j RT-qPCR analysis of genes associated with ER stress and muscle wasting in C2C12 myotubes after 6 h of incubation in CON, cytokines, rapamycin, or cytokines+rapamycin. k Quantification and representative western blot image (left, upper) of ATF4 protein abundance after 6 h of incubation in differentiation media with or without cytokines and rapamycin (RM). l Quantification of p62 protein abundance and representative western blot image (left, lower) in differentiation media (CON) or media containing the autophagy-flux inhibitor bafilomycin (200 nM) after 4 h of incubation in media with or without cytokines and rapamycin (24 h). Group numbers for b are n = 6 mice for TA and seven for GAS (10mCON), eight for 30mCON, and seven for 30mRM. For c and d, n = 7 mice (10mCON), eight (30mCON), seven for TA, and eight for GAS (30RM). For f–g, n = 8. For h–i, n = 6 wells across two separate experiments. For j, n = 6 wells. For k, n = 4 wells. For l, n = 6 (CON) and five (cytokines and cytokines+RM) wells. Data are mean ± SEM. Two-way repeated-measure ANOVAs with Sidak post hoc tests (b–d, i), one-way ANOVAs with Fisher’s LSD (f), Tukey’s (j, k) post hoc tests, or student’s two-sided t test (g), were used to compare between data. *, **, and *** denote a significant difference between groups of P < 0.05, P < 0.01, and P < 0.001, respectively. Where 0.05 < P < 0.1, P values are reported.CC BY · PubMed Central
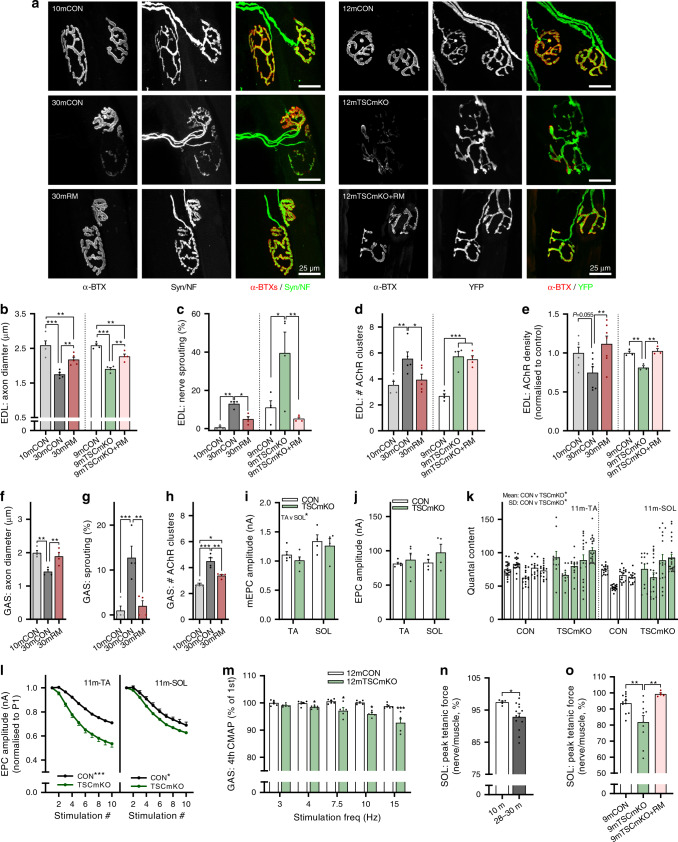
Fig. 4 Overactive mTORC1 drives neuromuscular junction (NMJ) instability and impairs NMJ function. a Representative whole-mount images of the pre- (neurofilament/synaptophysin or YFP) and postsynapse (acetylcholine receptors (AChRs) stained using alpha bungarotoxin) in extensor digitorum longus (EDL) muscle for 10-month-old control (10mCON), 30-month-old (30mCON), and 30-month-old mice treated from 15 months with rapamycin (30mRM, left) and for 9-month-old control (9mCON), TSCmKO (9mTSCmKO), and TSCmKO + 4 weeks of rapamycin-treatment (TSCmKO+RM, right) mice. Morphological properties of whole-mount EDL NMJs, including b axon diameter, c the percentage of NMJs with sprouting axons, and d the number of postsynaptic AChR clusters for 9mTSCmKO and sarcopenic experiments. e Acetylcholine receptor density in EDL cross sections. f–h Morphological properties of whole-mount GAS NMJs for 10mCON, 30mCON, and 30mRM mice. In situ electrophysiological readouts of individual NMJ transmission properties in the tibialis anterior (TA) and soleus (SOL) muscle of 11-month-old TSCmKO mice and littermate controls, including (i) miniature end- plate current (mEPC), j end-plate current (EPC), k quantal content, and l EPC over repeated stimulations. m EMG recordings of compound muscle action potential (CMAP) rundown over four consecutive stimulations in the GAS of 9-month-old TSCmKO mice and littermate controls at stimulation frequencies between 3 and 15 Hz. Nerve- relative to muscle-stimulated peak tetanic force in SOL nerve-muscle preparations in (n) 10- (n = 5) and 28–30-month-old (n = 13) wild-type mice, and (o) 9-month-old control (n = 11), TSCmKO (n = 10), and TSCmKO mice treated with rapamycin for 4 weeks (n = 5). Group numbers for 10mCON are n = 5 (b, d), 3 (c), 6 (e), and 4 (f–h) mice. For 30mCON and 30mRM, n = 5 (b, d), 4 (c, f–h), and 7 (e) mice. For 9mCON, 9mTSCmKO, and 9mTSCmKO+RM, n = 4 (b–d) and 3 (e) mice. For 11mCON and 11mTSCmKO, n = 5 (TA: i–l) and 4 (SOL: i–l) mice. For m, n = 6 (12mCON) and 5 (12mTSCmKO) mice. For n, n = 5 (10m) and 13 (28–30 m). For o, n = 11 (9mCON), 10 (9mTSCmKO), and 5 (9mTSCmKO + RM) mice. Data are presented as mean ± SEM. One-way ANOVA with Fisher’s LSD post hoc test (b–h, o), two-way (i–j) or two-way repeated-measure ANOVA (l, m) with Fisher’s LSD post hoc test (m), or two-tailed independent student’s t test (n) were used to compare between data. *, **, and *** denote a significant difference between groups of P < 0.05, P < 0.01, and P < 0.001, respectively. Where 0.05 < P < 0.1, P values are reported.
Fig. 4 Overactive mTORC1 drives neuromuscular junction (NMJ) instability and impairs NMJ function. a Representative whole-mount images of the pre- (neurofilament/synaptophysin or YFP) and postsynapse (acetylcholine receptors (AChRs) stained using alpha bungarotoxin) in extensor digitorum longus (EDL) muscle for 10-month-old control (10mCON), 30-month-old (30mCON), and 30-month-old mice treated from 15 months with rapamycin (30mRM, left) and for 9-month-old control (9mCON), TSCmKO (9mTSCmKO), and TSCmKO + 4 weeks of rapamycin-treatment (TSCmKO+RM, right) mice. Morphological properties of whole-mount EDL NMJs, including b axon diameter, c the percentage of NMJs with sprouting axons, and d the number of postsynaptic AChR clusters for 9mTSCmKO and sarcopenic experiments. e Acetylcholine receptor density in EDL cross sections. f–h Morphological properties of whole-mount GAS NMJs for 10mCON, 30mCON, and 30mRM mice. In situ electrophysiological readouts of individual NMJ transmission properties in the tibialis anterior (TA) and soleus (SOL) muscle of 11-month-old TSCmKO mice and littermate controls, including (i) miniature end- plate current (mEPC), j end-plate current (EPC), k quantal content, and l EPC over repeated stimulations. m EMG recordings of compound muscle action potential (CMAP) rundown over four consecutive stimulations in the GAS of 9-month-old TSCmKO mice and littermate controls at stimulation frequencies between 3 and 15 Hz. Nerve- relative to muscle-stimulated peak tetanic force in SOL nerve-muscle preparations in (n) 10- (n = 5) and 28–30-month-old (n = 13) wild-type mice, and (o) 9-month-old control (n = 11), TSCmKO (n = 10), and TSCmKO mice treated with rapamycin for 4 weeks (n = 5). Group numbers for 10mCON are n = 5 (b, d), 3 (c), 6 (e), and 4 (f–h) mice. For 30mCON and 30mRM, n = 5 (b, d), 4 (c, f–h), and 7 (e) mice. For 9mCON, 9mTSCmKO, and 9mTSCmKO+RM, n = 4 (b–d) and 3 (e) mice. For 11mCON and 11mTSCmKO, n = 5 (TA: i–l) and 4 (SOL: i–l) mice. For m, n = 6 (12mCON) and 5 (12mTSCmKO) mice. For n, n = 5 (10m) and 13 (28–30 m). For o, n = 11 (9mCON), 10 (9mTSCmKO), and 5 (9mTSCmKO + RM) mice. Data are presented as mean ± SEM. One-way ANOVA with Fisher’s LSD post hoc test (b–h, o), two-way (i–j) or two-way repeated-measure ANOVA (l, m) with Fisher’s LSD post hoc test (m), or two-tailed independent student’s t test (n) were used to compare between data. *, **, and *** denote a significant difference between groups of P < 0.05, P < 0.01, and P < 0.001, respectively. Where 0.05 < P < 0.1, P values are reported.CC BY · PubMed Central
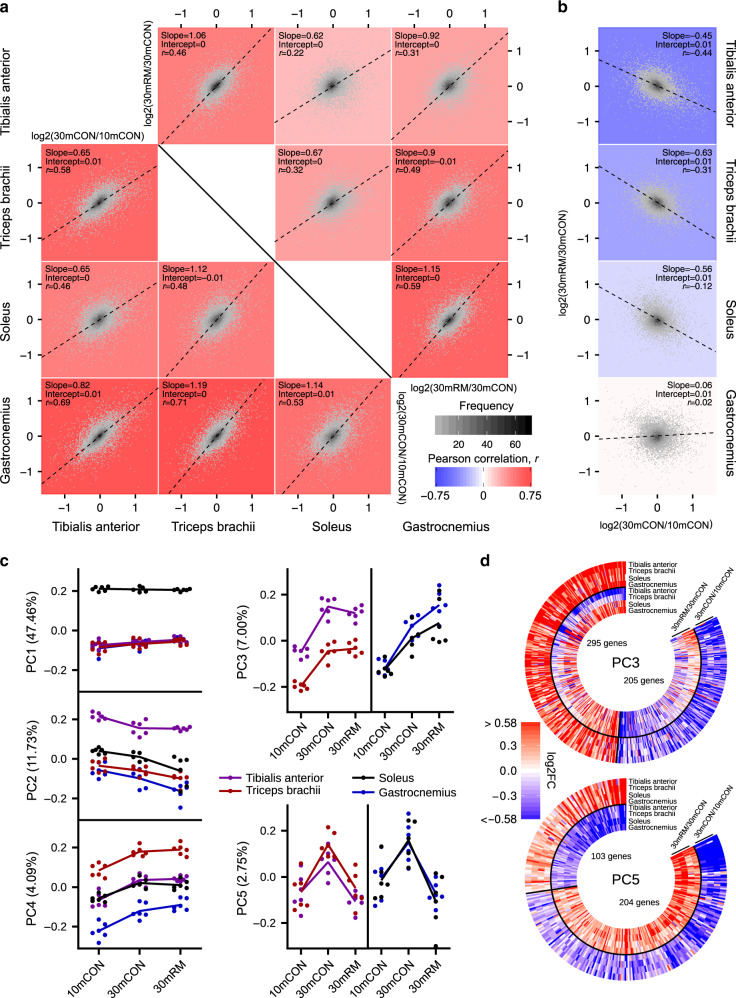
Fig. 5 Rapamycin exerts pro- and anti-aging stimuli. a Pairwise comparisons of age- (30mCON/10mCON, under diagonal) and rapamycin-induced (30mRM/30mCON, above diagonal) gene expression changes between tibialis anterior (TA), triceps brachii (TRI), soleus (SOL), and gastrocnemius (GAS) muscles, and b pairwise comparisons of age- and rapamycin-induced gene expression changes within muscles with slope, intercept, and Pearson’s correlation coefficient (r) indicated. For a and b, each graph is a 2D-density plot with the plotting area divided into small fragments; the intensity of the gray color of each fragment represents the number of genes in that fragment. Black dashed lines correspond to directions of the highest variance (PC1) for comparisons with the slope “s” and intercept “i”. The color of the plotting area was defined by the strength of the Pearson correlation coefficient r. c Coordinates of principal components (PC1–5) for gene expression data collected in TA, TRI, SOL, and GAS in 10mCON, 30mCON, and 30mRM. n = 6 mice per group and muscle, except for SOL 30mCON where n = 5. Each dot corresponds to one muscle sample, from an individual animal. The numbers associated with the PCs indicate the fraction of the variance in transcript expression in samples along the corresponding PC. d Heatmaps of the changes in the expression of genes aligned with PCs 3 and 5, respectively. A gene was considered aligned with a PC if the absolute value of the Pearson correlation between the expression of the gene and PC coordinates was ≥0.4, and the absolute value of the z score of the projection of the gene expression on a PC was ≥1.96.
Fig. 5 Rapamycin exerts pro- and anti-aging stimuli. a Pairwise comparisons of age- (30mCON/10mCON, under diagonal) and rapamycin-induced (30mRM/30mCON, above diagonal) gene expression changes between tibialis anterior (TA), triceps brachii (TRI), soleus (SOL), and gastrocnemius (GAS) muscles, and b pairwise comparisons of age- and rapamycin-induced gene expression changes within muscles with slope, intercept, and Pearson’s correlation coefficient (r) indicated. For a and b, each graph is a 2D-density plot with the plotting area divided into small fragments; the intensity of the gray color of each fragment represents the number of genes in that fragment. Black dashed lines correspond to directions of the highest variance (PC1) for comparisons with the slope “s” and intercept “i”. The color of the plotting area was defined by the strength of the Pearson correlation coefficient r. c Coordinates of principal components (PC1–5) for gene expression data collected in TA, TRI, SOL, and GAS in 10mCON, 30mCON, and 30mRM. n = 6 mice per group and muscle, except for SOL 30mCON where n = 5. Each dot corresponds to one muscle sample, from an individual animal. The numbers associated with the PCs indicate the fraction of the variance in transcript expression in samples along the corresponding PC. d Heatmaps of the changes in the expression of genes aligned with PCs 3 and 5, respectively. A gene was considered aligned with a PC if the absolute value of the Pearson correlation between the expression of the gene and PC coordinates was ≥0.4, and the absolute value of the z score of the projection of the gene expression on a PC was ≥1.96.CC BY · PubMed Central
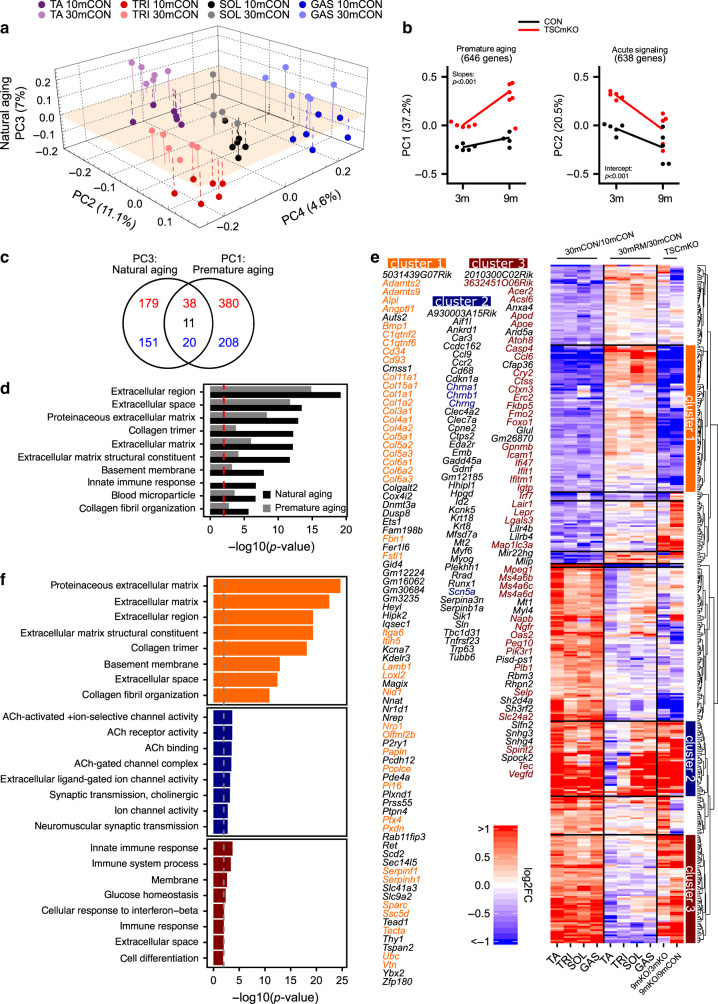
Fig. 6 mTORC1 suppresses extracellular matrix (ECM) remodeling, promotes inflammation, and is involved in muscle responses to functional denervation. a Coordinates of principal components (PC2–4) for gene expression data (TPM) collected in tibialis anterior (TA), triceps brachii (TRI), soleus (SOL), and gastrocnemius (GAS) from 10mCON and 30mCON mice. b Coordinates of PC1 and PC2 for gene expression data (TPM) generated from extensor digitorum longus (EDL) muscle of 3- and 9-month-old TSCmKO and littermate control mice. The numbers associated with the PCs indicate the fraction of the variance in gene expression in samples along the corresponding PC. Each dot corresponds to one muscle sample, from an individual animal. Linear regression analysis was used to compare slopes and intercepts. c Overlap of genes aligned with PC3 from a (natural aging) and PC1 from b (premature aging). A gene was considered aligned with a PC if the absolute value of the Pearson correlation coefficient between the expression of the gene and PC coordinates was ≥0.4, and the absolute value of the z score of the projection of the gene expression on a PC was ≥1.96. Red and blue numbers represent increasing and decreasing genes, respectively, while black numbers represent genes oppositely regulated between TSCmKO and sarcopenia data sets. d Top-ten DAVID gene ontology terms enriched (P < 0.01) for genes aligned to natural aging PC3 and the enrichment of these terms for genes aligned with premature aging PC1. e Heatmap of changes occurring during aging in the expression of genes aligned with natural aging PC3, i.e., common age-related gene-expression changes (30mCON/10mCON) in all four muscles, along with fold changes in these genes for 30mRM/30mCON, 9mTSCmKO/3mTSCmKO, and 9mTSCmKO/9mCON. Hierarchical clustering based on the Euclidean distance of these changes rendered 10 gene clusters, including three prominent clusters, now referred to as clusters 1, 2, and 3. Genes associated with clusters 1, 2, and 3 are listed. f Top-eight DAVID gene ontology terms enriched (P < 0.01) for gene clusters 1, 2, and 3, respectively. Enrichment significance threshold was set at P < 0.01 (gray and red dashed lines). Genes from clusters 1 to 3 contributing to the top enriched terms are colored. For TSCmKO data set n = 5 mice per group. For the sarcopenia data set, n = 6 mice per muscle per group, except for SOL 30mCON where one data point was removed due to a technical error. A modified Fisher’s exact test was used to determine significance.
Fig. 6 mTORC1 suppresses extracellular matrix (ECM) remodeling, promotes inflammation, and is involved in muscle responses to functional denervation. a Coordinates of principal components (PC2–4) for gene expression data (TPM) collected in tibialis anterior (TA), triceps brachii (TRI), soleus (SOL), and gastrocnemius (GAS) from 10mCON and 30mCON mice. b Coordinates of PC1 and PC2 for gene expression data (TPM) generated from extensor digitorum longus (EDL) muscle of 3- and 9-month-old TSCmKO and littermate control mice. The numbers associated with the PCs indicate the fraction of the variance in gene expression in samples along the corresponding PC. Each dot corresponds to one muscle sample, from an individual animal. Linear regression analysis was used to compare slopes and intercepts. c Overlap of genes aligned with PC3 from a (natural aging) and PC1 from b (premature aging). A gene was considered aligned with a PC if the absolute value of the Pearson correlation coefficient between the expression of the gene and PC coordinates was ≥0.4, and the absolute value of the z score of the projection of the gene expression on a PC was ≥1.96. Red and blue numbers represent increasing and decreasing genes, respectively, while black numbers represent genes oppositely regulated between TSCmKO and sarcopenia data sets. d Top-ten DAVID gene ontology terms enriched (P < 0.01) for genes aligned to natural aging PC3 and the enrichment of these terms for genes aligned with premature aging PC1. e Heatmap of changes occurring during aging in the expression of genes aligned with natural aging PC3, i.e., common age-related gene-expression changes (30mCON/10mCON) in all four muscles, along with fold changes in these genes for 30mRM/30mCON, 9mTSCmKO/3mTSCmKO, and 9mTSCmKO/9mCON. Hierarchical clustering based on the Euclidean distance of these changes rendered 10 gene clusters, including three prominent clusters, now referred to as clusters 1, 2, and 3. Genes associated with clusters 1, 2, and 3 are listed. f Top-eight DAVID gene ontology terms enriched (P < 0.01) for gene clusters 1, 2, and 3, respectively. Enrichment significance threshold was set at P < 0.01 (gray and red dashed lines). Genes from clusters 1 to 3 contributing to the top enriched terms are colored. For TSCmKO data set n = 5 mice per group. For the sarcopenia data set, n = 6 mice per muscle per group, except for SOL 30mCON where one data point was removed due to a technical error. A modified Fisher’s exact test was used to determine significance.CC BY · PubMed Central
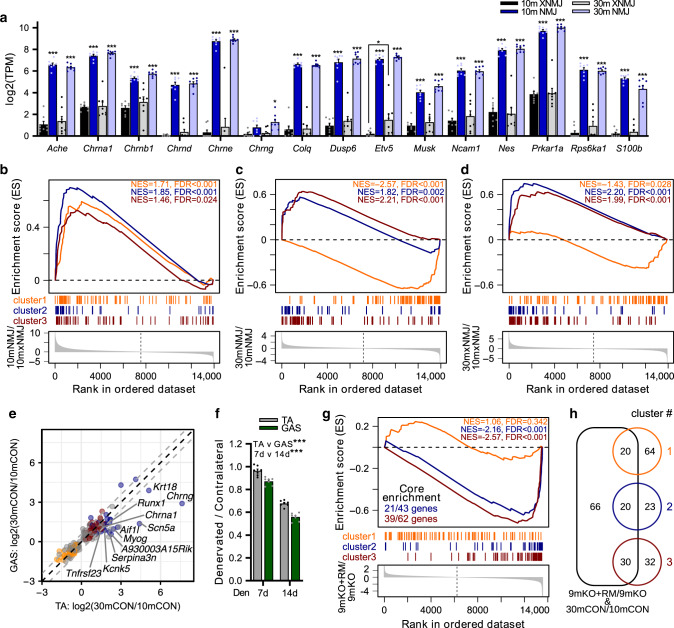
Fig. 7 The neuromuscular junction (NMJ) is a focal point of mTORC1-driven sarcopenic signaling. a The expression of genes known to be enriched at the NMJ based on mRNA-seq data generated from synaptic (NMJ) and extra-synaptic (xNMJ) regions of TA muscle from 10-month-old (10m) and 30-month-old (30m) mice. NMJ and xNMJ samples were collected using laser-capture microdissection on α-bungarotoxin- stained cross sections. Gene set enrichment analysis (GSEA) comparing the expression of genes in (b) NMJ versus xNMJ regions of 10m mice. c NMJ regions of 30m versus 10m groups and d xNMJ regions of 30m versus 10m groups. The distribution of genes from clusters 1, 2, and 3 was examined in lists of genes ranked by the magnitude of changes between conditions. Significance was set at the false discovery rate (FDR) < 0.01. e Scatterplot of fold-change expression of genes aligned with the aging PC3 from Fig. 6a between 30m and 10m for gastrocnemius (GAS) and tibialis anterior (TA). Labeled genes show a > log2(1.5)-fold change between TA and all three other muscles. Genes from clusters 1, 2, and 3 are colored orange, red, and blue, respectively, while gray dots are genes aligned with aging PC3, but not belonging to clusters 1–3. f Muscle mass of TA and GAS muscles denervated for 7 or 14 days relative to the contralateral control leg. g GSEA comparing the distribution of genes from clusters 1–3 in the ranked list of gene expression changes between 9-month-old TSCmKO mice (9mKO) and 9-month-old TSCmKO mice subjected to 3 days of rapamycin (8 mg kg−1 day−1) treatment (9mKO+RM). For clusters significantly enriched, the number of genes reaching the “leading edge” threshold are indicated. h Venn diagram of genes differentially expressed between 9mKO+RM and 9mKO, and aligned with the aging PC3, and their overlap with genes in clusters 1–3. Group numbers are (a–d) 8, (e) 6, (f) 7, and (g) 5. For (e), each dot represents the log-fold change between means of mice in each group. Data are means ± SEM. Two-way ANOVAs (a, f) with Tukey’s post hoc test (a) were used to compare between data. *, **, and *** denote a significant difference between groups of P < 0.05, P < 0.01, and P < 0.001, respectively.
Fig. 7 The neuromuscular junction (NMJ) is a focal point of mTORC1-driven sarcopenic signaling. a The expression of genes known to be enriched at the NMJ based on mRNA-seq data generated from synaptic (NMJ) and extra-synaptic (xNMJ) regions of TA muscle from 10-month-old (10m) and 30-month-old (30m) mice. NMJ and xNMJ samples were collected using laser-capture microdissection on α-bungarotoxin- stained cross sections. Gene set enrichment analysis (GSEA) comparing the expression of genes in (b) NMJ versus xNMJ regions of 10m mice. c NMJ regions of 30m versus 10m groups and d xNMJ regions of 30m versus 10m groups. The distribution of genes from clusters 1, 2, and 3 was examined in lists of genes ranked by the magnitude of changes between conditions. Significance was set at the false discovery rate (FDR) < 0.01. e Scatterplot of fold-change expression of genes aligned with the aging PC3 from Fig. 6a between 30m and 10m for gastrocnemius (GAS) and tibialis anterior (TA). Labeled genes show a > log2(1.5)-fold change between TA and all three other muscles. Genes from clusters 1, 2, and 3 are colored orange, red, and blue, respectively, while gray dots are genes aligned with aging PC3, but not belonging to clusters 1–3. f Muscle mass of TA and GAS muscles denervated for 7 or 14 days relative to the contralateral control leg. g GSEA comparing the distribution of genes from clusters 1–3 in the ranked list of gene expression changes between 9-month-old TSCmKO mice (9mKO) and 9-month-old TSCmKO mice subjected to 3 days of rapamycin (8 mg kg−1 day−1) treatment (9mKO+RM). For clusters significantly enriched, the number of genes reaching the “leading edge” threshold are indicated. h Venn diagram of genes differentially expressed between 9mKO+RM and 9mKO, and aligned with the aging PC3, and their overlap with genes in clusters 1–3. Group numbers are (a–d) 8, (e) 6, (f) 7, and (g) 5. For (e), each dot represents the log-fold change between means of mice in each group. Data are means ± SEM. Two-way ANOVAs (a, f) with Tukey’s post hoc test (a) were used to compare between data. *, **, and *** denote a significant difference between groups of P < 0.05, P < 0.01, and P < 0.001, respectively.CC BY · PubMed Central
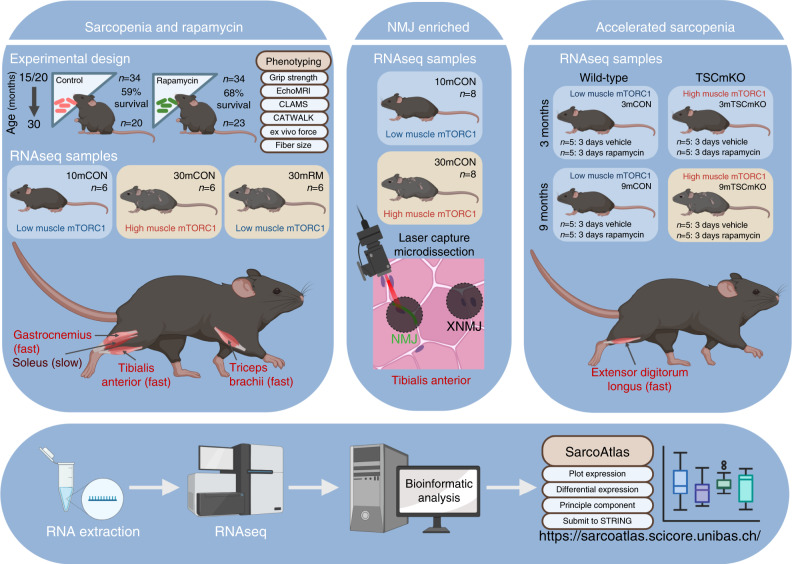
Fig. 8 SarcoAtlas. A graphical representation of the experimental design, group numbers, treatment duration, and muscles analyzed for the three novel data sets generated, analyzed, and available through the user-friendly SarcoAtlas application (https://sarcoatlas.unibas.ch/). SarcoAtlas allows interested users to plot and extract expression data for a gene of interest, and perform principal component or differential expression analysis on any of the three novel data sets: (1) sarcopenia and rapamycin, (2) laser-capture microdissection of NMJ-enriched and non-NMJ (XNMJ) regions, and (3) TSCmKO model of accelerated sarcopenia. Furthermore, gene lists can be easily submitted to string to visualize interactions and investigate gene ontology. Figure created with BioRender.com.
Fig. 8 SarcoAtlas. A graphical representation of the experimental design, group numbers, treatment duration, and muscles analyzed for the three novel data sets generated, analyzed, and available through the user-friendly SarcoAtlas application (https://sarcoatlas.unibas.ch/). SarcoAtlas allows interested users to plot and extract expression data for a gene of interest, and perform principal component or differential expression analysis on any of the three novel data sets: (1) sarcopenia and rapamycin, (2) laser-capture microdissection of NMJ-enriched and non-NMJ (XNMJ) regions, and (3) TSCmKO model of accelerated sarcopenia. Furthermore, gene lists can be easily submitted to string to visualize interactions and investigate gene ontology. Figure created with BioRender.com.CC BY · PubMed Central

Verification

Claims the paper makes

The claims and statistics of this paper haven’t been checked yet.

Run the check — free, no account needed. It reads the open-access text and checks the sources it cites.

A few free checks a day · papers already verified open instantly · results are public

Claims other papers make about this one

Each is checked against this paper’s own text: does it say what the citing paper says it does?

Self-check

Percentages, sums and reported differences re-computed from the paper’s own numbers.

The self-check needs the paper’s full text.

Citations

Cites

Show all 21 references

Research works printed but not linked: 71

  1. Janssen, I., Shepard, D. S., Katzmarzyk, P. T. & Roubenoff, R. The healthcare costs of sarcopenia in the United States. J. Am. Geriatr. Soc. 52, 80–85 (2004). · DOI · Paper page
  2. Stallone, G., Infante, B., Prisciandaro, C. & Grandaliano, G. mTOR and aging: an old fashioned dress. Int. J. Mol. Sci. 20, 2774 (2019). · DOI
  3. Arriola Apelo, S. I. & Lamming, D. W. Rapamycin: an inhibitor of aging emerges from the soil of Easter island. J. Gerontol. A Biol. Sci. Med. Sci. 71, 841–849 (2016). · DOI
  4. Rion, N. et al. mTOR controls embryonic and adult myogenesis via mTORC1. Development 146, (2019). · DOI
  5. Castets, P. et al. Sustained activation of mTORC1 in skeletal muscle inhibits constitutive and starvation-induced autophagy and causes a severe, late-onset myopathy. Cell Metab. 17, 731–744 (2013). · DOI · Paper page
  6. Guridi, M., Tintignac, L. A., Lin, S., Kupr, B., Castets, P. & Ruegg, M. A. Activation of mTORC1 in skeletal muscle regulates whole-body metabolism through FGF21. Sci. Signal 8, ra113 (2015). · DOI
  7. Barns, M., Gondro, C., Tellam, R. L., Radley-Crabb, H. G., Grounds, M. D. & Shavlakadze, T. Molecular analyses provide insight into mechanisms underlying sarcopenia and myofibre denervation in old skeletal muscles of mice. Int. J. Biochem. Cell Biol. 53, 174–185 (2014). · DOI
  8. White, Z., White, R. B., McMahon, C., Grounds, M. D. & Shavlakadze, T. High mTORC1 signaling is maintained, while protein degradation pathways are perturbed in old murine skeletal muscles in the fasted state. Int. J. Biochem. Cell Biol. 78, 10–21 (2016). · DOI · Paper page
  9. Joseph, G. A. et al. Partial inhibition of mTORC1 in aged rats counteracts the decline in muscle mass and reverses molecular signaling associated with sarcopenia. Mol. Cell. Biol. 39, e00141-19 (2019). · DOI · Paper page
  10. Tang, H. et al. mTORC1 underlies age-related muscle fiber damage and loss by inducing oxidative stress and catabolism. Aging Cell 18, e12943 (2019). · DOI
  11. Baar, E. L., Carbajal, K. A., Ong, I. M. & Lamming, D. W. Sex- and tissue-specific changes in mTOR signaling with age in C57BL/6J mice. Aging Cell 15, 155–166 (2016). · DOI · Paper page
  12. Markofski, M. M. et al. Effect of age on basal muscle protein synthesis and mTORC1 signaling in a large cohort of young and older men and women. Exp. Gerontol. 65, 1–7 (2015). · DOI · Paper page
  13. Brockhoff, M. et al. Targeting deregulated AMPK/mTORC1 pathways improves muscle function in myotonic dystrophy type I. J. Clin. Investig. 127, 549–563 (2017). · DOI
  14. Miller, R. A. et al. Rapamycin-mediated lifespan increase in mice is dose and sex dependent and metabolically distinct from dietary restriction. Aging Cell 13, 468–477 (2014). · DOI
  15. Sohal, R. S. & Forster, M. J. Caloric restriction and the aging process: a critique. Free Radic. Biol. Med. 73, 366–382 (2014). · DOI
  16. Santilli, V., Bernetti, A., Mangone, M. & Paoloni, M. Clinical definition of sarcopenia. Clin. Cases Min. Bone Metab. 11, 177–180 (2014).
  17. Lexell, J., Taylor, C. C. & Sjostrom, M. What is the cause of the ageing atrophy? Total number, size and proportion of different fiber types studied in whole vastus lateralis muscle from 15- to 83-year-old men. J. Neurol. Sci. 84, 275–294 (1988). · DOI
  18. Kung, T. A., Cederna, P. S., van der Meulen, J. H., Urbanchek, M. G., Kuzon, W. M. Jr. & Faulkner, J. A. Motor unit changes seen with skeletal muscle sarcopenia in oldest old rats. J. Gerontol. A Biol. Sci. Med. Sci. 69, 657–665 (2014). · DOI
  19. Ham, A. S. et al. mTORC1 signalling is not essential for the maintenance of muscle mass and function in adult sedentary mice. J. Cachexia Sarcopenia Muscle 11, 259–273 (2020). · DOI
  20. Hepple, R. T. & Rice, C. L. Innervation and neuromuscular control in ageing skeletal muscle. J. Physiol. 594, 1965–1978 (2016). · DOI
  21. Lexell, J. & Downham, D. Y. The occurrence of fibre-type grouping in healthy human muscle: a quantitative study of cross-sections of whole vastus lateralis from men between 15 and 83 years. Acta Neuropathol. 81, 377–381 (1991). · DOI
  22. Yoon, M. S. mTOR as a key regulator in maintaining skeletal muscle mass. Front. Physiol. 8, 788 (2017). · DOI · Paper page
  23. Castets, P. et al. mTORC1 and PKB/Akt control the muscle response to denervation by regulating autophagy and HDAC4. Nat. Commun. 10, 3187 (2019). · DOI
  24. Rieu, I. et al. Reduction of low grade inflammation restores blunting of postprandial muscle anabolism and limits sarcopenia in old rats. J. Physiol. 587, 5483–5492 (2009). · DOI
  25. Guttridge, D. C., Mayo, M. W., Madrid, L. V., Wang, C. Y. & Baldwin, A. S. Jr. NF-kappaB-induced loss of MyoD messenger RNA: possible role in muscle decay and cachexia. Science 289, 2363–2366 (2000). · DOI
  26. Valdez, G. et al. Attenuation of age-related changes in mouse neuromuscular synapses by caloric restriction and exercise. Proc. Natl Acad. Sci. USA 107, 14863–14868 (2010). · DOI
  27. Abe, T. et al. Age-related, site-specific muscle loss in 1507 Japanese men and women aged 20 to 95 years. J. Sports Sci. Med. 10, 145–150 (2011).
  28. Piasecki, M. et al. Failure to expand the motor unit size to compensate for declining motor unit numbers distinguishes sarcopenic from non-sarcopenic older men. J. Physiol. 596, 1627–1637 (2018). · DOI
  29. Ham, D. J. & Ruegg, M. A. Causes and consequences of age-related changes at the neuromuscular junction. Curr. Opin. Physiol. 4, 32–39 (2018). · DOI
  30. Rudolf, R., Khan, M. M., Labeit, S. & Deschenes, M. R. Degeneration of neuromuscular junction in age and dystrophy. Front. Aging Neurosci. 6, 99 (2014). · DOI
  31. Jones, R. A. et al. NMJ-morph reveals principal components of synaptic morphology influencing structure-function relationships at the neuromuscular junction. Open Biol. 6, 160240 (2016). · DOI
  32. Zhao, K. et al. Sarcoglycan alpha mitigates neuromuscular junction decline in aged mice by stabilizing LRP4. J. Neurosci. 38, 8860–8873 (2018). · DOI
  33. Wood, S. J. & Slater, C. R. Safety factor at the neuromuscular junction. Prog. Neurobiol. 64, 393–429 (2001). · DOI
  34. Terry, E. E. et al. Transcriptional profiling reveals extraordinary diversity among skeletal muscle tissues. eLife 7, e34613 (2018). · DOI
  35. Zeman, R. J. et al. Differential skeletal muscle gene expression after upper or lower motor neuron transection. Pflug. Arch. 458, 525–535 (2009). · DOI
  36. Nakao, R., Shimba, S. & Oishi, K. Ketogenic diet induces expression of the muscle circadian gene Slc25a25 via neural pathway that might be involved in muscle thermogenesis. Sci. Rep. 7, 2885 (2017). · DOI
  37. Baehr, L. M. et al. Age-related deficits in skeletal muscle recovery following disuse are associated with neuromuscular junction instability and ER stress, not impaired protein synthesis. Aging 8, 127–146 (2016). · DOI
  38. Gonzalez de Aguilar, J. L. et al. Gene profiling of skeletal muscle in an amyotrophic lateral sclerosis mouse model. Physiol. Genomics 32, 207–218 (2008). · DOI
  39. Ketterer, C., Zeiger, U., Budak, M. T., Rubinstein, N. A. & Khurana, T. S. Identification of the neuromuscular junction transcriptome of extraocular muscle by laser capture microdissection. Investig. Ophthalmol. Vis. Sci. 51, 4589–4599 (2010). · DOI
  40. Giordani, L. et al. High-dimensional single-cell cartography reveals novel skeletal muscle-resident cell populations. Mol. Cell 74, 609–621 e606 (2019). · DOI
  41. Tacutu, R. et al. Human ageing genomic resources: new and updated databases. Nucleic Acids Res. 46, D1083–D1090 (2018). · DOI · Paper page
  42. Greising, S. M., Ermilov, L. G., Sieck, G. C. & Mantilla, C. B. Ageing and neurotrophic signalling effects on diaphragm neuromuscular function. J. Physiol. 593, 431–440 (2015). · DOI
  43. Willadt, S., Nash, M. & Slater, C. R. Age-related fragmentation of the motor endplate is not associated with impaired neuromuscular transmission in the mouse diaphragm. Sci. Rep. 6, 24849 (2016). · DOI
  44. Ouanounou, G., Baux, G. & Bal, T. A novel synaptic plasticity rule explains homeostasis of neuromuscular transmission. eLife 5, e12190 (2016). · DOI
  45. Mahoney, R. E., Rawson, J. M. & Eaton, B. A. An age-dependent change in the set point of synaptic homeostasis. J. Neurosci. 34, 2111–2119 (2014). · DOI
  46. Wu, J. J. et al. Increased mammalian lifespan and a segmental and tissue-specific slowing of aging after genetic reduction of mTOR expression. Cell Rep. 4, 913–920 (2013). · DOI · Paper page
  47. Norrmen, C., Figlia, G., Pfistner, P., Pereira, J. A., Bachofner, S. & Suter, U. mTORC1 is transiently reactivated in injured nerves to promote c-Jun elevation and Schwann cell dedifferentiation. J. Neurosci. 38, 4811–4828 (2018). · DOI
  48. Witzemann, V., Brenner, H. R. & Sakmann, B. Neural factors regulate AChR subunit mRNAs at rat neuromuscular synapses. J. Cell. Biol. 114, 125–141 (1991). · DOI
  49. Adams, C. M., Ebert, S. M. & Dyle, M. C. Role of ATF4 in skeletal muscle atrophy. Curr. Opin. Clin. Nutr. Metab. Care 20, 164–168 (2017). · DOI
  50. Gordon, P. M. et al. Resistance exercise training influences skeletal muscle immune activation: a microarray analysis. J. Appl. Physiol. 112, 443–453 (2012). · DOI
  51. Chen, Y. L. et al. Adiponectin receptor PAQR-2 signaling senses low temperature to promote C. elegans longevity by regulating autophagy. Nat. Commun. 10, 2602 (2019).
  52. Ewald, C. Y., Landis, J. N., Porter Abate, J., Murphy, C. T. & Blackwell, T. K. Dauer-independent insulin/IGF-1-signalling implicates collagen remodelling in longevity. Nature 519, 97–101 (2015). · DOI
  53. Cescon, M. et al. Collagen VI is required for the structural and functional integrity of the neuromuscular junction. Acta Neuropathol. 136, 483–499 (2018). · DOI
  54. Kwiatkowski, D. J. et al. A mouse model of TSC1 reveals sex-dependent lethality from liver hemangiomas, and up-regulation of p70S6 kinase activity in Tsc1 null cells. Hum. Mol. Genet. 11, 525–534 (2002). · DOI
  55. Hamers, F. P., Lankhorst, A. J., van Laar, T. J., Veldhuis, W. B. & Gispen, W. H. Automated quantitative gait analysis during overground locomotion in the rat: its application to spinal cord contusion and transection injuries. J. Neurotrauma 18, 187–201 (2001). · DOI
  56. Schmidt, N. et al. Neuregulin/ErbB regulate neuromuscular junction development by phosphorylation of alpha-dystrobrevin. J. Cell Biol. 195, 1171–1184 (2011). · DOI
  57. Kearse, M. et al. Geneious basic: an integrated and extendable desktop software platform for the organization and analysis of sequence data. Bioinformatics 28, 1647–1649 (2012). · DOI
  58. Altschul, S. F., Gish, W., Miller, W., Myers, E. W. & Lipman, D. J. Basic local alignment search tool. J. Mol. Biol. 215, 403–410 (1990). · DOI · Paper page
  59. Kibbe, W. A. OligoCalc: an online oligonucleotide properties calculator. Nucleic Acids Res. 35, W43–W46 (2007). · DOI
  60. Feng, G. et al. Imaging neuronal subsets in transgenic mice expressing multiple spectral variants of GFP. Neuron 28, 41–51 (2000). · DOI · Paper page
  61. Wang, X. et al. Activity-dependent presynaptic regulation of quantal size at the mammalian neuromuscular junction in vivo. J. Neurosci. 25, 343–351 (2005). · DOI
  62. Wang, X., Pinter, M. J. & Rich, M. M. Ca2+ dependence of the binomial parameters p and n at the mouse neuromuscular junction. J. Neurophysiol. 103, 659–666 (2010). · DOI
  63. Robinson, M. D., McCarthy, D. J. & Smyth, G. K. edgeR: a bioconductor package for differential expression analysis of digital gene expression data. Bioinformatics 26, 139–140 (2010). · DOI · Paper page
  64. Benjamini, Y. & Hochberg, Y. Controlling the false discovery rate: a practical and powerful approach to multiple testing. J. R. Stat. Soc.: Ser. B (Methodol.) 57, 289–300 (1995). · DOI · Paper page
  65. Huang da, W., Sherman, B. T. & Lempicki, R. A. Systematic and integrative analysis of large gene lists using DAVID bioinformatics resources. Nat. Protoc. 4, 44–57 (2009). · DOI · Paper page
  66. Luisier, R. et al. Computational modeling identifies key gene regulatory interactions underlying phenobarbital-mediated tumor promotion. Nucleic Acids Res. 42, 4180–4195 (2014). · DOI
  67. Snel, B., Lehmann, G., Bork, P. & Huynen, M. A. STRING: a web-server to retrieve and display the repeatedly occurring neighbourhood of a gene. Nucleic Acids Res. 28, 3442–3444 (2000). · DOI
  68. Hubbard, T. et al. The Ensembl genome database project. Nucleic Acids Res. 30, 38–41 (2002). · DOI
  69. Koster, J. & Rahmann, S. Snakemake-a scalable bioinformatics workflow engine. Bioinformatics 34, 3600 (2018). · DOI · Paper page
  70. Tomfohr, J., Lu, J. & Kepler, T. B. Pathway level analysis of gene expression using singular value decomposition. BMC Bioinforma. 6, 225 (2005). · DOI
  71. Johnson, R. & Wichern, D. Applied Multivariate Statistical Analysis (Pearson, 2013). · DOI

Cited by

Sorted by citations

Metadata

Authors
Ham, D. J., Börsch, A., Lin, S., Thürkauf, M., Weihrauch, M., Reinhard, J. R., Delezie, J., Battilana, F., Wang, X., Kaiser, M. S., Guridi, M., Sinnreich, M., Rich, M. M., Mittal, N., Tintignac, L. A., Handschin, C., Zavolan, M., & Rüegg, M. A.
Venue
Nature Communications
Published
2020-09-09
Volume
11
Issue
1
ISSN
2041-1723
Cited by
180
References
21
Language
en

About these checks

Registry, retraction, Cites and statistics results are computed, not judged, with one exception: a printed reference that no index lists is read once by a model before it counts as a citation error. Claims are extracted by a model and kept only when their quote appears verbatim in the text; each cited source is then checked, with a model’s help, for whether it says what the claim relies on. Those verdicts can be wrong — read the claim’s quote and the cited source before relying on one.

Statistics and arithmetic are recomputed, not judged.

Confidence bands are shown only for fields calibrated on our annotated test set. None is calibrated yet, so no band is shown.

What counts as a claim ›How we measure confidence ›How we check this ›

Are you an author, or do you see a problem with this page? Request a review