CoChat

HIF-2α is indispensable for regulatory T cell function

Open access

The DOI matches its Crossref record; 67 of the 68 references it cites were found in a registry or an index.

Abstract

Hypoxia-inducible factor 1α (HIF-1α) and HIF-2α are master transcription factors that regulate cellular responses to hypoxia, but the exact function in regulatory T (Treg) cells is controversial. Here, we show that Treg cell development is normal in mice with Foxp3-specific knockout (KO) of HIF-1α or HIF-2α. However, HIF-2α-KO (but not HIF-1α-KO) Treg cells are functionally defective in suppressing effector T cell-induced colitis and inhibiting airway hypersensitivity. HIF-2α-KO Treg cells have enhanced reprogramming into IL-17-secreting cells. We show crosstalk between HIF-2α and HIF-1α, and that HIF-2α represses HIF-1α expression. HIF-1α is upregulated in HIF-2α-KO Treg cells and further deletion of HIF-1α restores the inhibitory function of HIF-2α-KO Treg cells. Mice with Foxp3-conditional KO of HIF-2α are resistant to growth of MC38 colon adenocarcinoma and metastases of B16F10 melanoma. Together, these results indicate that targeting HIF-2α to destabilize Treg cells might be an approach for regulating the functional activity of Treg cells.

Overview

The claims and statistics of this paper haven’t been checked yet.

Free: it reads the open-access text and checks the first 5 claims that cite a source we can check. Create a free account to check every claim.

A few free checks a day · papers already verified open instantly · results are public

Integrity signals

Registry

Crossref · 10.1038/s41467-020-18731-y

Cites

67 of 67 references verified0 citation errors · 0 not checkable

Statistics

Figures

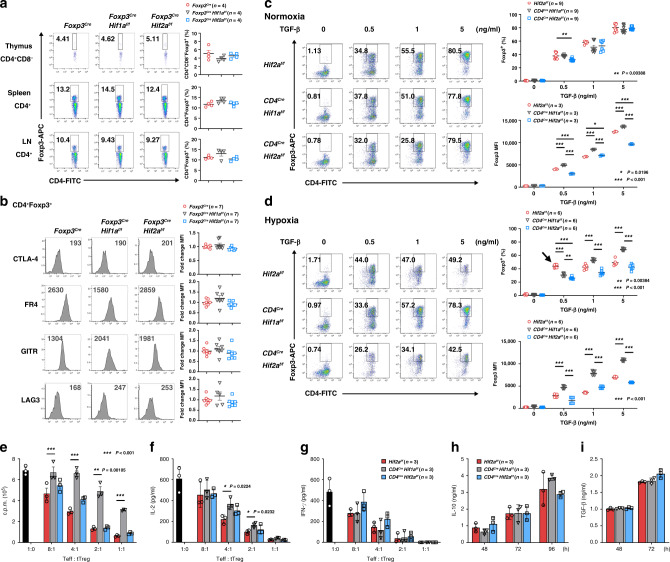
Fig. 1 HIF-2α KO does not affect Treg cell development or in vitro tTreg suppressive activity. a CD4+Foxp3+ T cell populations in thymus, spleen, and peripheral lymph nodes (LN) of Foxp3Cre (WT), Foxp3CreHif1af/f, and Foxp3CreHif2af/f mice. Left, representative plots. Right, data expressed as mean ± SEM, n = 4 biologically independent mice. Red circle, Foxp3Cre; black inversed triangle, Foxp3CreHif1af/f; blue square, Foxp3CreHif2af/f. b Expression of CTLA-4, FR4, GITR, and LAG-3 in Foxp3Cre, Foxp3CreHif1af/f, and Foxp3CreHif2af/f tTreg cells. Left, representative traces of MFI. Right, ratios of the MFIs of HIF-1α-KO or HIF-2α-KO tTreg to WT tTreg cells are expressed as the mean ± SEM, n = 7 mice. c, d Naïve T cells from Hif2af/f (WT), Cd4CreHif1af/f, and Cd4CreHif2af/f mice were activated with anti-CD3/CD28 (2/1 μg ml−1) with different doses of TGF-β and IL-2 (20 ng ml−1) under normoxia c or hypoxia (1% O2) d for 3 days. Left, representative plots of Foxp3 staining. Right, percentages of Foxp3+ cells and MFIs of Foxp3 are presented as the mean ± SEM, n = 9 (Foxp3+, c), n = 3 (Foxp3 MFI, c), n = 6 d. Symbols are the same as in a except red circle represents Hif2af/f. *P < 0.05, **P < 0.01, ***P < 0.001, as determined by two-way ANOVA. Arrow in d indicates a specific increase in Foxp3+ cells among WT iTreg cells. e–g WT CD4+CD25− T cells (1 × 10⁵) were stimulated alone with anti-CD3 (1 μg ml−1) and T cell-depleted splenic cells or together with Hif2af/f (WT), Cd4CreHif1af/f or Cd4CreHif2af/f tTreg cells at the indicated ratios. CD4+CD25− T cell proliferation was measured by thymidine incorporation e, and the production of IL-2 f and IFN-γ g was determined 40 h later. Values are mean ± SD, n = 3 (e–g). *P < 0.05, **P < 0.01, by two-tailed unpaired t-test (e, f). h, i Hif2af/f, Cd4CreHif1af/f and Cd4CreHif2af/f tTreg cells were stimulated with anti-CD3/CD28 (4/2 μg ml−1) and IL-2 for 48–96 h. IL-10 (h) and TGF-β (i) production were determined. n = 4 (h), n = 4 (Hif2af/f, Cd4CreHif2af/f), 2 (Cd4CreHif1af/f) i. Source data are provided as a Source data file.
Fig. 1 HIF-2α KO does not affect Treg cell development or in vitro tTreg suppressive activity. a CD4+Foxp3+ T cell populations in thymus, spleen, and peripheral lymph nodes (LN) of Foxp3Cre (WT), Foxp3CreHif1af/f, and Foxp3CreHif2af/f mice. Left, representative plots. Right, data expressed as mean ± SEM, n = 4 biologically independent mice. Red circle, Foxp3Cre; black inversed triangle, Foxp3CreHif1af/f; blue square, Foxp3CreHif2af/f. b Expression of CTLA-4, FR4, GITR, and LAG-3 in Foxp3Cre, Foxp3CreHif1af/f, and Foxp3CreHif2af/f tTreg cells. Left, representative traces of MFI. Right, ratios of the MFIs of HIF-1α-KO or HIF-2α-KO tTreg to WT tTreg cells are expressed as the mean ± SEM, n = 7 mice. c, d Naïve T cells from Hif2af/f (WT), Cd4CreHif1af/f, and Cd4CreHif2af/f mice were activated with anti-CD3/CD28 (2/1 μg ml−1) with different doses of TGF-β and IL-2 (20 ng ml−1) under normoxia c or hypoxia (1% O2) d for 3 days. Left, representative plots of Foxp3 staining. Right, percentages of Foxp3+ cells and MFIs of Foxp3 are presented as the mean ± SEM, n = 9 (Foxp3+, c), n = 3 (Foxp3 MFI, c), n = 6 d. Symbols are the same as in a except red circle represents Hif2af/f. *P < 0.05, **P < 0.01, ***P < 0.001, as determined by two-way ANOVA. Arrow in d indicates a specific increase in Foxp3+ cells among WT iTreg cells. e–g WT CD4+CD25− T cells (1 × 10⁵) were stimulated alone with anti-CD3 (1 μg ml−1) and T cell-depleted splenic cells or together with Hif2af/f (WT), Cd4CreHif1af/f or Cd4CreHif2af/f tTreg cells at the indicated ratios. CD4+CD25− T cell proliferation was measured by thymidine incorporation e, and the production of IL-2 f and IFN-γ g was determined 40 h later. Values are mean ± SD, n = 3 (e–g). *P < 0.05, **P < 0.01, by two-tailed unpaired t-test (e, f). h, i Hif2af/f, Cd4CreHif1af/f and Cd4CreHif2af/f tTreg cells were stimulated with anti-CD3/CD28 (4/2 μg ml−1) and IL-2 for 48–96 h. IL-10 (h) and TGF-β (i) production were determined. n = 4 (h), n = 4 (Hif2af/f, Cd4CreHif2af/f), 2 (Cd4CreHif1af/f) i. Source data are provided as a Source data file.CC BY · PubMed Central
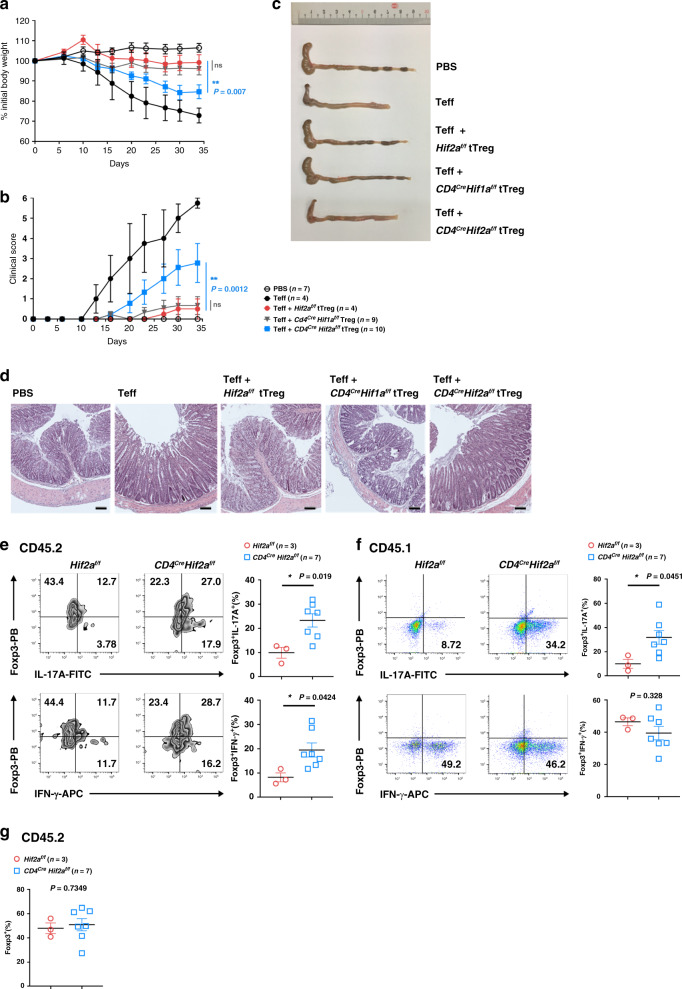
Fig. 2 HIF-2α-KO tTreg cells are defective in suppressing colitis. a–d CD45.1+ CD4+CD25− effector T (Teff) cells (4 × 10⁵) were administered into sex-matched CD45.1+ RAG-1-KO mice with or without CD45.2+ tTreg cells (1 × 10⁵) originating from Hif2af/f, Cd4CreHif1af/f, or Cd4CreHif2af/f mice. Body weight a and colitis scores b were assessed. Four out of the 10 RAG-1-KO mice that received Cd4CreHif1af/f tTreg cells did not lose weight, but their data have been included in a, b. Open circle, PBS; black solid circle, Teff; red solid circle, Teff + Hif2af/f Treg; grey inverted square, Teff + Cd4CreHif1af/f Treg, blue square, Teff + Cd4CreHif2af/f Treg. Data represent a combination of two independent experiments, and were confirmed by another two independent experiments, each of which individually presented a pattern similar to that of the combined dataset. **P = 0.007 (a), 0.0012 (b), by repeat measures two-way ANOVA with Tukey’s multiple comparisons test, with the Greenhouse-Geisser correction. ns, not significant. Five weeks after T-cell transfer, mice were sacrificed and colons were isolated c, and stained with hematoxylin and eosin (H&E) d. Micrographs are representative of the mice in each group. Bar indicates 100 μm. Results were reproduced in four independent experiments. e–g CD45.2+ Hif2af/f or Cd4CreHif2af/f tTreg cells were administered into CD45.1+ RAG-1-KO mice together with CD45.1+ Teff cells. Mice were sacrificed 5 weeks later and CD4+ T cells from lymph nodes were isolated. CD4+ T cells were activated by TPA/A23187 (50/500 ng ml−1), Foxp3+IL-17A+ and Foxp3+IFN-γ+ subpopulations in CD45.2+ tTreg cells (e) and CD45.1+ Teff cells (f), and Foxp3+ frequency in CD45.2+ tTreg cells (g) were determined. PB Pacific blue. Left panels (e, f), representative staining plots. Right panel e, f, percentages of Foxp3+IL-17A+ and Foxp3+IFN-γ+ cells. Data are presented as the mean ± SEM, n = 3 (Hif2af/f) or 7 (Cd4CreHif2af/f) e–g. Red circle, Hif2af/f; blue square, Cd4CreHif2af/f. *P = 0.019 (IL-17A) and 0.024 (IFN-γ) for e, P = 0.0451 (IL-17A) and 0.328 (IFN-γ) for f, P = 0.0734 g by two-tailed unpaired t-test. Source data are provided as a Source data file.
Fig. 2 HIF-2α-KO tTreg cells are defective in suppressing colitis. a–d CD45.1+ CD4+CD25− effector T (Teff) cells (4 × 10⁵) were administered into sex-matched CD45.1+ RAG-1-KO mice with or without CD45.2+ tTreg cells (1 × 10⁵) originating from Hif2af/f, Cd4CreHif1af/f, or Cd4CreHif2af/f mice. Body weight a and colitis scores b were assessed. Four out of the 10 RAG-1-KO mice that received Cd4CreHif1af/f tTreg cells did not lose weight, but their data have been included in a, b. Open circle, PBS; black solid circle, Teff; red solid circle, Teff + Hif2af/f Treg; grey inverted square, Teff + Cd4CreHif1af/f Treg, blue square, Teff + Cd4CreHif2af/f Treg. Data represent a combination of two independent experiments, and were confirmed by another two independent experiments, each of which individually presented a pattern similar to that of the combined dataset. **P = 0.007 (a), 0.0012 (b), by repeat measures two-way ANOVA with Tukey’s multiple comparisons test, with the Greenhouse-Geisser correction. ns, not significant. Five weeks after T-cell transfer, mice were sacrificed and colons were isolated c, and stained with hematoxylin and eosin (H&E) d. Micrographs are representative of the mice in each group. Bar indicates 100 μm. Results were reproduced in four independent experiments. e–g CD45.2+ Hif2af/f or Cd4CreHif2af/f tTreg cells were administered into CD45.1+ RAG-1-KO mice together with CD45.1+ Teff cells. Mice were sacrificed 5 weeks later and CD4+ T cells from lymph nodes were isolated. CD4+ T cells were activated by TPA/A23187 (50/500 ng ml−1), Foxp3+IL-17A+ and Foxp3+IFN-γ+ subpopulations in CD45.2+ tTreg cells (e) and CD45.1+ Teff cells (f), and Foxp3+ frequency in CD45.2+ tTreg cells (g) were determined. PB Pacific blue. Left panels (e, f), representative staining plots. Right panel e, f, percentages of Foxp3+IL-17A+ and Foxp3+IFN-γ+ cells. Data are presented as the mean ± SEM, n = 3 (Hif2af/f) or 7 (Cd4CreHif2af/f) e–g. Red circle, Hif2af/f; blue square, Cd4CreHif2af/f. *P = 0.019 (IL-17A) and 0.024 (IFN-γ) for e, P = 0.0451 (IL-17A) and 0.328 (IFN-γ) for f, P = 0.0734 g by two-tailed unpaired t-test. Source data are provided as a Source data file.CC BY · PubMed Central
Fig. 3 HIF-2α-KO increases conversion of Treg cells into IL-17A-secreting cells. a–c Increased transition of HIF-2α-KO tTreg cells into IL-17-expressing cells. Hif2af/f (WT) and Cd4CreHif2af/f tTreg cells were activated with plate-bound anti-CD3/CD28 (4/2 μg ml−1) and IL-2 (Th0), with an additional 50 ng/ml of IL-12 (Th1), or an additional IL-6 (50 ng ml−1) plus IL-1 (IL-1α and IL-1β, 20 ng ml−1 each) (Th17) for 5 days. IFN-γ a and IL-17A b levels were measured in supernatants collected from tTreg cells reactivated by TPA/A23187 (20/200 ng ml−1) for 16 h. Data a, b are expressed as mean ± SD, n = 3. The frequency of Foxp3+ cells was determined by intracellular staining, and representative plots of four independent experiments are shown in the left panel of c. Right panel c, data are expressed as mean ± SEM, n = 4. Red circle, Hif2af/f; blue square, Cd4CreHif2af/f. **P = 0.0057 (Th0), 0.0024 (Th1); ***P < 0.001 (Th17) (b). d, e Increased conversion of HIF-2α-KO iTreg cells into IL-17-producing cells. Hif2af/f (WT) and Cd4CreHif2af/f iTreg cells, generated as described in Fig. 1c, were rested for 2 days and then reactivated with plate-bound anti-CD3/CD28 (4/2 μg ml−1) under Th1-, Th2-, and Th17-priming conditions as described in a. Re-programmed iTreg cells were activated by TPA/A23187, and IFN-γ (d) and IL-17A (e) production was quantitated. Data are expressed as mean ± SEM, n = 6. *P = 0.011 (e). f Normal HIF-2α-deficient T helper cell differentiation. Naïve T cells (CD4+CD25−CD44loCD62Lhi) from Hif2af/f and Cd4CreHif2af/f mice were differentiated under either Th1-, Th2-, or Th17-polarizing conditions, as described in Methods, for 5 days. T cells were then re-stimulated with TPA/A23187 (50/500 ng ml−1), and expression of IFN-γ, IL-4, and IL-17 was determined by intracellular staining. Numbers represent the percentage of cells positive for IFN-γ, IL-4, or IL-17. Left, representative plots of three independent experiments are shown. Right, data are expressed as mean ± SEM. n = 3 (IFN-γ+) or n = 4 (IL-4+ or IL-17+). ***P < 0.001. P-value was determined by two-tailed unpaired t-test (a–f). Source data are provided as a Source data file.
Fig. 3 HIF-2α-KO increases conversion of Treg cells into IL-17A-secreting cells. a–c Increased transition of HIF-2α-KO tTreg cells into IL-17-expressing cells. Hif2af/f (WT) and Cd4CreHif2af/f tTreg cells were activated with plate-bound anti-CD3/CD28 (4/2 μg ml−1) and IL-2 (Th0), with an additional 50 ng/ml of IL-12 (Th1), or an additional IL-6 (50 ng ml−1) plus IL-1 (IL-1α and IL-1β, 20 ng ml−1 each) (Th17) for 5 days. IFN-γ a and IL-17A b levels were measured in supernatants collected from tTreg cells reactivated by TPA/A23187 (20/200 ng ml−1) for 16 h. Data a, b are expressed as mean ± SD, n = 3. The frequency of Foxp3+ cells was determined by intracellular staining, and representative plots of four independent experiments are shown in the left panel of c. Right panel c, data are expressed as mean ± SEM, n = 4. Red circle, Hif2af/f; blue square, Cd4CreHif2af/f. **P = 0.0057 (Th0), 0.0024 (Th1); ***P < 0.001 (Th17) (b). d, e Increased conversion of HIF-2α-KO iTreg cells into IL-17-producing cells. Hif2af/f (WT) and Cd4CreHif2af/f iTreg cells, generated as described in Fig. 1c, were rested for 2 days and then reactivated with plate-bound anti-CD3/CD28 (4/2 μg ml−1) under Th1-, Th2-, and Th17-priming conditions as described in a. Re-programmed iTreg cells were activated by TPA/A23187, and IFN-γ (d) and IL-17A (e) production was quantitated. Data are expressed as mean ± SEM, n = 6. *P = 0.011 (e). f Normal HIF-2α-deficient T helper cell differentiation. Naïve T cells (CD4+CD25−CD44loCD62Lhi) from Hif2af/f and Cd4CreHif2af/f mice were differentiated under either Th1-, Th2-, or Th17-polarizing conditions, as described in Methods, for 5 days. T cells were then re-stimulated with TPA/A23187 (50/500 ng ml−1), and expression of IFN-γ, IL-4, and IL-17 was determined by intracellular staining. Numbers represent the percentage of cells positive for IFN-γ, IL-4, or IL-17. Left, representative plots of three independent experiments are shown. Right, data are expressed as mean ± SEM. n = 3 (IFN-γ+) or n = 4 (IL-4+ or IL-17+). ***P < 0.001. P-value was determined by two-tailed unpaired t-test (a–f). Source data are provided as a Source data file.CC BY · PubMed Central
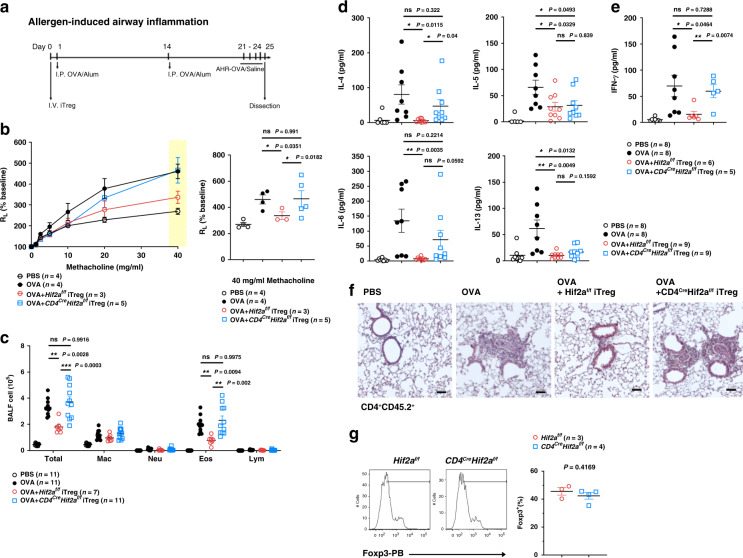
Fig. 4 HIF-2α-KO iTreg cells do not inhibit allergic inflammation. a CD45.1+ C57BL/6 mice were administered with CD45.2+ Hif2af/f (WT) and Cd4CreHif2af/f iTreg cells (2.5 × 10⁶) on day 0, sensitized with ovalbumin (OVA) on days 1 and 14. On day 21, mice were challenged with OVA for four consecutive days and sacrificed on day 25. b Diminished ability of HIF-2α-KO iTreg cells to repress airway inflammation. Left panel, lung resistance (RL) in response to methacholine. Right panel, lung resistance at 40 mg ml−1 methacholine is expressed as mean ± SEM. Open circle, PBS (n = 4); black solid circle, OVA (n = 4); red circle, OVA + Hif2af/f iTreg (n = 3); blue square, OVA + Cd4CreHif2af/f iTreg (n = 5). *P < 0.05, as determined by two-way ANOVA. ns, not significant. c Leukocyte population in bronchoalveolar lavage fluid (BALF) from mice in a. Numbers of total leukocytes (Total), macrophages (Mac), neutrophils (Neu), eosinophils (Eos), and lymphocytes (Lym) in BALF were determined. Data (cells ml−1 in BALF) are expressed as mean ± SEM. PBS, n = 11; OVA, n = 11; OVA + Hif2af/f iTreg, n = 7; OVA + Cd4CreHif2af/f iTreg, n = 11. **P < 0.01, ***P < 0.001, as determined by two-way ANOVA with Tukey’s multiple comparisons test. ns, not significant. d, e Levels of IL-4, IL-5, IL-6, IL-13 (d), IFN-γ (e) in BALF were determined. PBS, n = 8 d, e; OVA, n = 8 d, e; OVA + Hif2af/f iTreg, n = 9 d, 6 (e); OVA + Cd4CreHif2af/f iTreg, n = 9 d, 5 e. f Representative H&E-stained lung sections are shown. Bar indicates 100 μm. Results were reproduced in six independent experiments. g Lung draining lymph nodes were isolated and the percentage of Foxp3+ cells in the CD4+CD45.2+ T cell population was determined. Red circle, Hif2af/f (n = 3), blue square, Cd4CreHif2af/f (n = 4). Data are presented as mean ± SEM (d, e, g). *P < 0.05, **P < 0.01 (d, e, g), as determined by two-tailed unpaired t-test. ns not significant. Source data are provided as a Source data file.
Fig. 4 HIF-2α-KO iTreg cells do not inhibit allergic inflammation. a CD45.1+ C57BL/6 mice were administered with CD45.2+ Hif2af/f (WT) and Cd4CreHif2af/f iTreg cells (2.5 × 10⁶) on day 0, sensitized with ovalbumin (OVA) on days 1 and 14. On day 21, mice were challenged with OVA for four consecutive days and sacrificed on day 25. b Diminished ability of HIF-2α-KO iTreg cells to repress airway inflammation. Left panel, lung resistance (RL) in response to methacholine. Right panel, lung resistance at 40 mg ml−1 methacholine is expressed as mean ± SEM. Open circle, PBS (n = 4); black solid circle, OVA (n = 4); red circle, OVA + Hif2af/f iTreg (n = 3); blue square, OVA + Cd4CreHif2af/f iTreg (n = 5). *P < 0.05, as determined by two-way ANOVA. ns, not significant. c Leukocyte population in bronchoalveolar lavage fluid (BALF) from mice in a. Numbers of total leukocytes (Total), macrophages (Mac), neutrophils (Neu), eosinophils (Eos), and lymphocytes (Lym) in BALF were determined. Data (cells ml−1 in BALF) are expressed as mean ± SEM. PBS, n = 11; OVA, n = 11; OVA + Hif2af/f iTreg, n = 7; OVA + Cd4CreHif2af/f iTreg, n = 11. **P < 0.01, ***P < 0.001, as determined by two-way ANOVA with Tukey’s multiple comparisons test. ns, not significant. d, e Levels of IL-4, IL-5, IL-6, IL-13 (d), IFN-γ (e) in BALF were determined. PBS, n = 8 d, e; OVA, n = 8 d, e; OVA + Hif2af/f iTreg, n = 9 d, 6 (e); OVA + Cd4CreHif2af/f iTreg, n = 9 d, 5 e. f Representative H&E-stained lung sections are shown. Bar indicates 100 μm. Results were reproduced in six independent experiments. g Lung draining lymph nodes were isolated and the percentage of Foxp3+ cells in the CD4+CD45.2+ T cell population was determined. Red circle, Hif2af/f (n = 3), blue square, Cd4CreHif2af/f (n = 4). Data are presented as mean ± SEM (d, e, g). *P < 0.05, **P < 0.01 (d, e, g), as determined by two-tailed unpaired t-test. ns not significant. Source data are provided as a Source data file.CC BY · PubMed Central
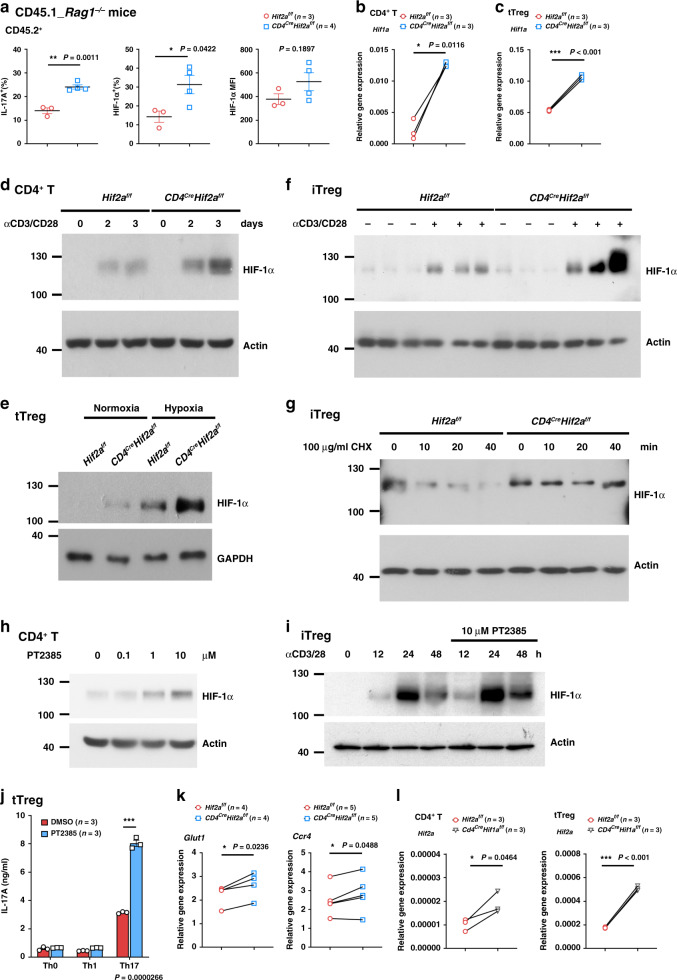
Fig. 5 HIF-2α-KO cells have high expression of HIF-1α. a CD45.2+ tTreg cells were transferred to CD45.1+ RAG-1-KO mice together with CD45.1+ Teff. CD45.2+ tTreg cells were re-isolated after 15 days, activated by TPA/A23187 (50/500 ng ml−1), and the intracellular HIF-1α, Foxp3, and IL-17 determined. n = 3 (Hif2af/f), 4 (Cd4CreHif2af/f). Data represent mean ± SEM. *P = 0.011 (IL-17A+), 0.0422 (HIF-1α+) by two-tailed unpaired t-test. b, c Hif1a in Hif2af/f and Cd4CreHif2af/f naïve CD4+ T (b) and tTreg (c) cells was determined by quantitative PCR. n = 3. *P = 0.0116 b, ***P < 0.001 c by two-tailed paired t-test. d WT and HIF-2α-KO CD4+ naïve T cells were activated by CD3/CD28 (2/1 μg ml−1) and HIF-1α levels were determined. e, f Hif2af/f and Cd4CreHif2af/f tTreg cells were activated by CD3/CD28 (4/2 μg ml−1) for 24 h under normoxic or hypoxic conditions (e), or iTreg cells were activated by CD3/CD28 (2/1 μg ml−1) for 4 h (f), and HIF-1α levels were determined. Each sample f represents independent iTreg cells preparation. g Hif2af/f and Cd4CreHif2af/f iTreg cells were activated as in f under hypoxia for 4 h. Cells were then treated with cycloheximide (100 μg ml−1) and HIF-1α levels determined. h, i WT naïve CD4+ T cells (h) were activated by CD3/CD28 (2/1 μg ml−1) in the presence of HIF-2α inhibitor PT2385 for 2 days, or activating WT iTreg cells (i) were treated with 10 μM PT2385, and HIF-1α levels determined. Results have been reproduced in three (d, h) or two e–i independent experiments. j WT tTreg cells were stimulated with or without 10 μM PT2385, and IL-17 production was quantitated. Data are technical triplicates, the experiment was independently reproduced twice. k Hif2af/f and Cd4CreHif2af/f tTreg cells were analyzed for expression of Glut1 and Ccr4 by quantitative PCR. n = 4 (Glut1), n = 5 (Ccr4). *P = 0.0236 (Glut1) and 0.0488 (Ccr4), by two-tailed paired t-test. l The expression of Hif2a in Hif1af/f and Cd4CreHif1af/f naïve CD4+ T and tTreg cells was determined. n = 3. *P = 0.0464, ***P < 0.001, by two-tailed paired t-test. Source data are provided as a Source data file.
Fig. 5 HIF-2α-KO cells have high expression of HIF-1α. a CD45.2+ tTreg cells were transferred to CD45.1+ RAG-1-KO mice together with CD45.1+ Teff. CD45.2+ tTreg cells were re-isolated after 15 days, activated by TPA/A23187 (50/500 ng ml−1), and the intracellular HIF-1α, Foxp3, and IL-17 determined. n = 3 (Hif2af/f), 4 (Cd4CreHif2af/f). Data represent mean ± SEM. *P = 0.011 (IL-17A+), 0.0422 (HIF-1α+) by two-tailed unpaired t-test. b, c Hif1a in Hif2af/f and Cd4CreHif2af/f naïve CD4+ T (b) and tTreg (c) cells was determined by quantitative PCR. n = 3. *P = 0.0116 b, ***P < 0.001 c by two-tailed paired t-test. d WT and HIF-2α-KO CD4+ naïve T cells were activated by CD3/CD28 (2/1 μg ml−1) and HIF-1α levels were determined. e, f Hif2af/f and Cd4CreHif2af/f tTreg cells were activated by CD3/CD28 (4/2 μg ml−1) for 24 h under normoxic or hypoxic conditions (e), or iTreg cells were activated by CD3/CD28 (2/1 μg ml−1) for 4 h (f), and HIF-1α levels were determined. Each sample f represents independent iTreg cells preparation. g Hif2af/f and Cd4CreHif2af/f iTreg cells were activated as in f under hypoxia for 4 h. Cells were then treated with cycloheximide (100 μg ml−1) and HIF-1α levels determined. h, i WT naïve CD4+ T cells (h) were activated by CD3/CD28 (2/1 μg ml−1) in the presence of HIF-2α inhibitor PT2385 for 2 days, or activating WT iTreg cells (i) were treated with 10 μM PT2385, and HIF-1α levels determined. Results have been reproduced in three (d, h) or two e–i independent experiments. j WT tTreg cells were stimulated with or without 10 μM PT2385, and IL-17 production was quantitated. Data are technical triplicates, the experiment was independently reproduced twice. k Hif2af/f and Cd4CreHif2af/f tTreg cells were analyzed for expression of Glut1 and Ccr4 by quantitative PCR. n = 4 (Glut1), n = 5 (Ccr4). *P = 0.0236 (Glut1) and 0.0488 (Ccr4), by two-tailed paired t-test. l The expression of Hif2a in Hif1af/f and Cd4CreHif1af/f naïve CD4+ T and tTreg cells was determined. n = 3. *P = 0.0464, ***P < 0.001, by two-tailed paired t-test. Source data are provided as a Source data file.CC BY · PubMed Central
Fig. 6 HIF-1α KO restores the suppressive activity of HIF-2α-KO Treg cells. a, b CD45.1+ RAG-1-KO mice were administered with CD45.1+ CD4+CD25− Teff cells (4 × 10⁵) with or without CD45.2+ Hif2af/f, Cd4CreHif2af/f or Cd4Cre Hif1af/fHif2af/f tTreg cells (1 × 10⁵). Body weight a and colitis scores b were assessed. Three out of the 12 RAG-1-KO mice that received HIF-2α-KO tTregs did not lose weight, but their data are included in a, b. Data represent a combination of three independent experiments. PBS, n = 9; Teff, n = 7; Teff + Hif2af/f Treg, n = 7; Teff + Cd4CreHif2af/f Treg, n = 12; Teff + Cd4CreHif1af/fHif2af/f Treg, n = 8. ****P < 0.0001, as determined by repeat measures two-way ANOVA with Tukey’s multiple comparisons test, with the Greenhouse-Geisser correction. c, d Mice from a were sacrificed 5 weeks later and CD45.2+ CD4+ T cells were isolated, re-stimulated with TPA/A23187, and then expression of Foxp3, IFN-γ and IL-17A was determined. (c, left), representative plots; (c, right), percentages of Foxp3+IL-17A+ and Foxp3+IFN-γ+ cells; (d), Foxp3+ fraction among the CD4+CD45.2+ T cell population. Data are presented as mean ± SEM. Hif2af/f, n = 4 c, d; Cd4CreHif2af/f, n = 4 c, 8 d; Cd4CreHif1af/fHif2af/f, n = 4 (c), 8 (d). e–g B6 mice were treated with Hif2af/f, Cd4CreHif2af/f and Cd4CreHif1af/fHif2af/f iTreg cells. RL in response to methacholine was measured (e, left) and data is represented as mean ± SEM (e, right). Amounts of IL-4, IL-6 (f), and IFN-γ g in the BALF were determined. PBS, n = 3 (e),12 (f, g); OVA, n = 3 (e), 9 (f, g); OVA + Hif2af/f iTreg, n = 5 (e), 13 (f), 6 (g); OVA + Cd4CreHif2af/f iTreg, n = 8 (e), 8 (f), 6 (g); OVA + Cd4CreHif1af/fHif2af/f iTreg, n = 12 (e), 10 (f, g). Data are presented as mean ± SEM (f, g). *P < 0.05, **P < 0.01, ***P < 0.001 (c–g), as determined by two-tailed unpaired t-test (c, d, f, g), or two-way ANOVA with Tukey’s multiple comparisons test e. Source data are provided as a Source data file.
Fig. 6 HIF-1α KO restores the suppressive activity of HIF-2α-KO Treg cells. a, b CD45.1+ RAG-1-KO mice were administered with CD45.1+ CD4+CD25− Teff cells (4 × 10⁵) with or without CD45.2+ Hif2af/f, Cd4CreHif2af/f or Cd4Cre Hif1af/fHif2af/f tTreg cells (1 × 10⁵). Body weight a and colitis scores b were assessed. Three out of the 12 RAG-1-KO mice that received HIF-2α-KO tTregs did not lose weight, but their data are included in a, b. Data represent a combination of three independent experiments. PBS, n = 9; Teff, n = 7; Teff + Hif2af/f Treg, n = 7; Teff + Cd4CreHif2af/f Treg, n = 12; Teff + Cd4CreHif1af/fHif2af/f Treg, n = 8. ****P < 0.0001, as determined by repeat measures two-way ANOVA with Tukey’s multiple comparisons test, with the Greenhouse-Geisser correction. c, d Mice from a were sacrificed 5 weeks later and CD45.2+ CD4+ T cells were isolated, re-stimulated with TPA/A23187, and then expression of Foxp3, IFN-γ and IL-17A was determined. (c, left), representative plots; (c, right), percentages of Foxp3+IL-17A+ and Foxp3+IFN-γ+ cells; (d), Foxp3+ fraction among the CD4+CD45.2+ T cell population. Data are presented as mean ± SEM. Hif2af/f, n = 4 c, d; Cd4CreHif2af/f, n = 4 c, 8 d; Cd4CreHif1af/fHif2af/f, n = 4 (c), 8 (d). e–g B6 mice were treated with Hif2af/f, Cd4CreHif2af/f and Cd4CreHif1af/fHif2af/f iTreg cells. RL in response to methacholine was measured (e, left) and data is represented as mean ± SEM (e, right). Amounts of IL-4, IL-6 (f), and IFN-γ g in the BALF were determined. PBS, n = 3 (e),12 (f, g); OVA, n = 3 (e), 9 (f, g); OVA + Hif2af/f iTreg, n = 5 (e), 13 (f), 6 (g); OVA + Cd4CreHif2af/f iTreg, n = 8 (e), 8 (f), 6 (g); OVA + Cd4CreHif1af/fHif2af/f iTreg, n = 12 (e), 10 (f, g). Data are presented as mean ± SEM (f, g). *P < 0.05, **P < 0.01, ***P < 0.001 (c–g), as determined by two-tailed unpaired t-test (c, d, f, g), or two-way ANOVA with Tukey’s multiple comparisons test e. Source data are provided as a Source data file.CC BY · PubMed Central
Fig. 7 Treg-specific KO of HIF-2α confers resistance to tumor growth. a Treg-conditional deletion of Hif2a inhibits MC38 growth. MC38 colon adenocarcinoma cells (1 × 10⁵) were subcutaneously inoculated into WT (Foxp3Cre) or Foxp3CreHif2af/f mice, with Foxp3Cre being littermate controls of Foxp3CreHif2af/f mice. Tumor growth was assessed every 2 days. Plotted values represent the mean and SEM of mice with a tumor. Numbers in brackets of legend represent tumor-free mice in each group. Red circle, Foxp3Cre (n = 7), blue square, Foxp3CreHif2af/f (n = 8). ****P < 0.0001. b–d Foxp3CreHif2af/f mice are resistant to B16F10 metastases. B16F10 melanoma cells (2 × 10⁵) were intravenously administered into Foxp3Cre and Foxp3CreHif2af/f mice, with Foxp3Cre mice being littermates of Foxp3CreHif2af/f mice. At day 12 post-implantation, lungs were isolated b and the numbers of black nodules in lungs were quantified c. Red circle, Foxp3Cre (n = 7), blue square, Foxp3CreHif2af/f (n = 6) c. **P = 0.0082. Lung metastases were examined by H&E staining d. Bar indicates 100 μm. e Inhibition of MC38 growth by HIF-2α-downregulated Treg cells. Upper panel shows experimental setup. C57BL/6 male mice (6–8 weeks-old) were transplanted with 5 × 10⁵ MC38 cells after 2 Gy irradiation on day 0. PBS, iTreg cells (1 × 10⁶), or iTreg cells treated with PT2385 were adoptively transferred into MC38-bearing mice on days 3, 6, and 10. Tumor growth was assessed and is represented as mean tumor volume ± SEM. Black circle, PBS (n = 7); red circle, iTreg (n = 8); blue square, PT2385-treated iTreg (n = 7). ****P < 0.0001. P-value was determined by repeat measures two-way ANOVA with Tukey’s multiple comparisons test, with the Greenhouse-Geisser correction a, e or two-tailed unpaired t-test (c). Source data are provided as a Source data file.
Fig. 7 Treg-specific KO of HIF-2α confers resistance to tumor growth. a Treg-conditional deletion of Hif2a inhibits MC38 growth. MC38 colon adenocarcinoma cells (1 × 10⁵) were subcutaneously inoculated into WT (Foxp3Cre) or Foxp3CreHif2af/f mice, with Foxp3Cre being littermate controls of Foxp3CreHif2af/f mice. Tumor growth was assessed every 2 days. Plotted values represent the mean and SEM of mice with a tumor. Numbers in brackets of legend represent tumor-free mice in each group. Red circle, Foxp3Cre (n = 7), blue square, Foxp3CreHif2af/f (n = 8). ****P < 0.0001. b–d Foxp3CreHif2af/f mice are resistant to B16F10 metastases. B16F10 melanoma cells (2 × 10⁵) were intravenously administered into Foxp3Cre and Foxp3CreHif2af/f mice, with Foxp3Cre mice being littermates of Foxp3CreHif2af/f mice. At day 12 post-implantation, lungs were isolated b and the numbers of black nodules in lungs were quantified c. Red circle, Foxp3Cre (n = 7), blue square, Foxp3CreHif2af/f (n = 6) c. **P = 0.0082. Lung metastases were examined by H&E staining d. Bar indicates 100 μm. e Inhibition of MC38 growth by HIF-2α-downregulated Treg cells. Upper panel shows experimental setup. C57BL/6 male mice (6–8 weeks-old) were transplanted with 5 × 10⁵ MC38 cells after 2 Gy irradiation on day 0. PBS, iTreg cells (1 × 10⁶), or iTreg cells treated with PT2385 were adoptively transferred into MC38-bearing mice on days 3, 6, and 10. Tumor growth was assessed and is represented as mean tumor volume ± SEM. Black circle, PBS (n = 7); red circle, iTreg (n = 8); blue square, PT2385-treated iTreg (n = 7). ****P < 0.0001. P-value was determined by repeat measures two-way ANOVA with Tukey’s multiple comparisons test, with the Greenhouse-Geisser correction a, e or two-tailed unpaired t-test (c). Source data are provided as a Source data file.CC BY · PubMed Central

Verification

Claims the paper makes

The claims and statistics of this paper haven’t been checked yet.

Free: it reads the open-access text and checks the first 5 claims that cite a source we can check. Create a free account to check every claim.

A few free checks a day · papers already verified open instantly · results are public

Claims other papers make about this one

Each is checked against this paper’s own text: does it say what the citing paper says it does?

Self-check

Percentages, sums and reported differences re-computed from the paper’s own numbers.

The self-check needs the paper’s full text.

Citations

Cites

Show all 67 references

Cited by

See all 131

Metadata

Authors
Hsu, T.-S., Lin, Y.-L., Wang, Y.-A., Mo, S.-T., Chi, P.-Y., Lai, A. C.-Y., Pan, H.-Y., Chang, Y.-J., & Lai, M.-Z.
Affiliations
  • Institute of Molecular Biology, Academia Sinica (TW)
  • Institute of Biomedical Sciences, Academia Sinica (TW)
Corresponding author
Lai, Ming-Zong
Venue
Nature Communications
Published
2020-10-06
Volume
11
Issue
1
Pages
5005-5005
ISSN
2041-1723 (ISSN-L)
OpenAlex
W3092326438
Cited by
126
References
68
Citations by year
2026: 15 · 2025: 18 · 2024: 17 · 2023: 26 · 2022: 35 · 2021: 14 · 2020: 1
FWCI
6.66
Type
journal article
Language
en
Open access
Licence
Locations
  • Nature Communications (publishedVersion, cc-by)
  • PubMed Central (publishedVersion, cc-by)
  • PubMed (publishedVersion)
  • RePEc: Research Papers in Economics (submittedVersion)
  • DOAJ (DOAJ: Directory of Open Access Journals) (submittedVersion, cc-by-sa)
Funders
Ministry of Science and Technology, Taiwan (MOST107-2321-B001-031)
Topics
  • Life Sciences › Immunology and Microbiology › Immunology › T-cell and B-cell Immunology
  • Life Sciences › Biochemistry, Genetics and Molecular Biology › Cancer Research › Cancer, Hypoxia, and Metabolism
  • Health Sciences › Medicine › Oncology › Cancer Immunotherapy and Biomarkers
Keywords
HIF-2α, HIF-1α, regulatory T cells, Foxp3, hypoxia, Treg cell function, colitis, airway hypersensitivity, tumor immunosuppression, colon adenocarcinoma, melanoma metastasis, transcription factor regulation
MeSH terms
Endothelial PAS Domain-Containing Protein 1, Adenocarcinoma, Animals, Cell Differentiation, Colitis, Colonic Neoplasms, Female, Male, Melanoma, CD4-Positive T-Lymphocytes, Bronchial Hyperreactivity, Mice, Knockout, Interleukin-17, T-Lymphocytes, Regulatory, Basic Helix-Loop-Helix Transcription Factors, Basic Helix-Loop-Helix Proteins, Hypoxia-Inducible Factor 1, alpha Subunit, Forkhead Transcription Factors, Cellular Reprogramming

About these checks

Registry, retraction, Cites and statistics results are computed, not judged, with one exception: a printed reference that no index lists is read once by a model before it counts as a citation error. Claims are extracted by a model and kept only when their quote appears verbatim in the text; each cited source is then checked, with a model’s help, for whether it says what the claim relies on. Those verdicts can be wrong — read the claim’s quote and the cited source before relying on one.

Statistics and arithmetic are recomputed, not judged.

Confidence bands are shown only for fields calibrated on our annotated test set. None is calibrated yet, so no band is shown.

What counts as a claim ›How we measure confidence ›How we check this ›

Are you an author, or do you see a problem with this page? Request a review

How to cite

Cite CoChat for the checks on this page, and the paper for its own findings.

This page
CoChat. (2026). Citation check: HIF-2α is indispensable for regulatory T cell function. https://app.cochat.ai/papers/10.1038/s41467-020-18731-y
The paper
Hsu, T.-S., Lin, Y.-L., Wang, Y.-A., Mo, S.-T., Chi, P.-Y., Lai, A. C.-Y., Pan, H.-Y., Chang, Y.-J., & Lai, M.-Z. (2020). HIF-2α is indispensable for regulatory T cell function. Nature Communications. https://doi.org/10.1038/s41467-020-18731-y

Data sources

Bibliographic data: Semantic Scholar, OpenAlex, Crossref.

Contains information from the Semantic Scholar Academic Graph Datasets, made available under the ODC Attribution License (ODC-BY 1.0).

Semantic Scholar’s data is described in: Kinney, R., et al. (2023). The Semantic Scholar Open Data Platform. arXiv:2301.10140.