

The DOI matches its Crossref record; 22 of the 23 references it cites were found in a registry or an index.
Fusing subnational with national climate action is central to decarbonization: the case of the United States
Open accessAbstract
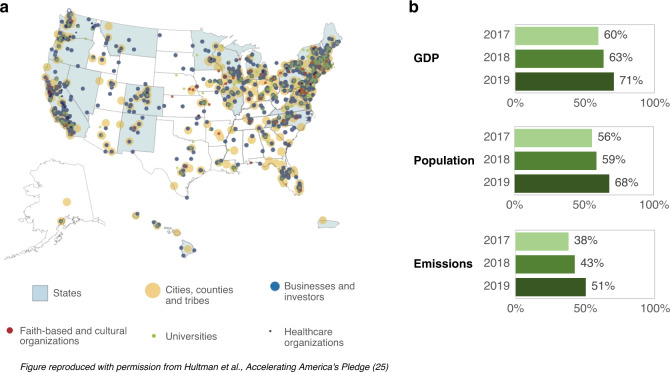
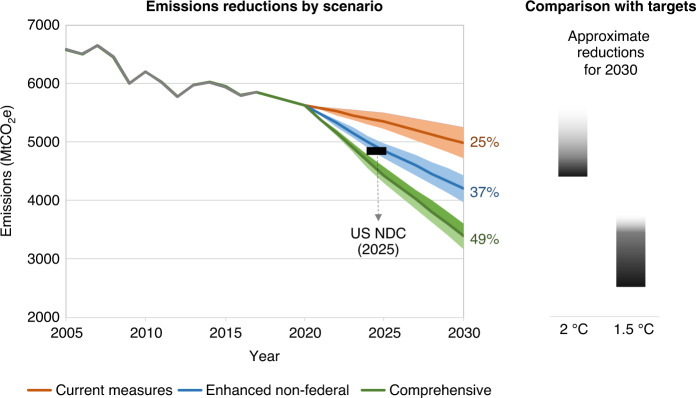
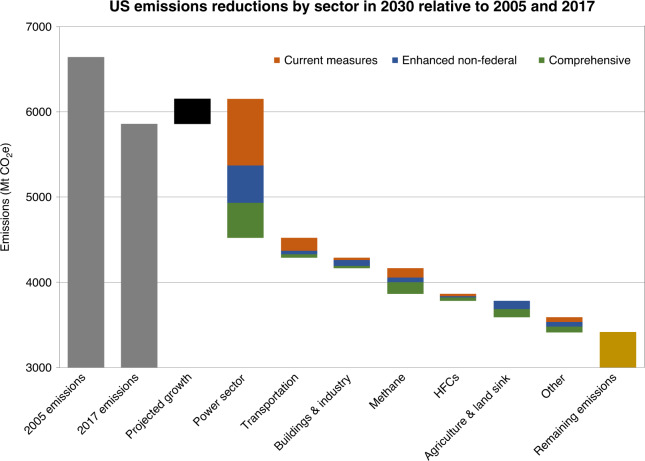
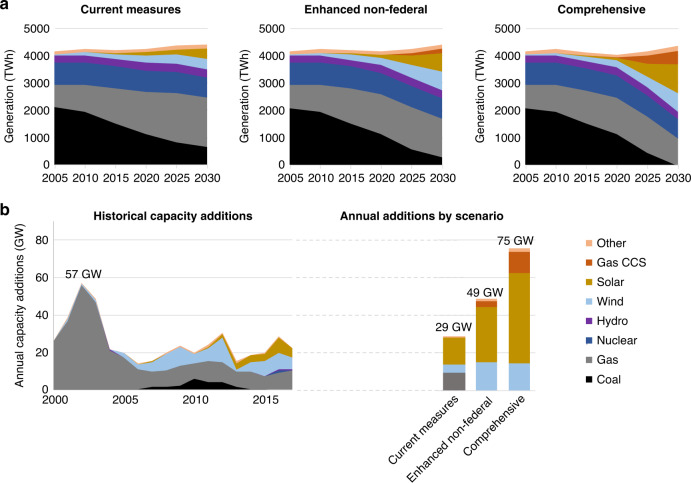
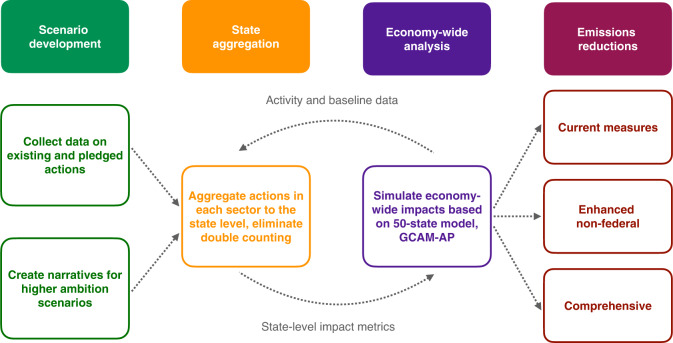
Approaches that root national climate strategies in local actions will be essential for all countries as they develop new nationally determined contributions under the Paris Agreement. The potential impact of climate action from non-national actors in delivering higher global ambition is significant. Sub-national action in the United States provides a test for how such actions can accelerate emissions reductions. We aggregated U.S. state, city, and business commitments within an integrated assessment model to assess how a national climate strategy can be built upon non-state actions. We find that existing commitments alone could reduce emissions 25% below 2005 levels by 2030, and that enhancing actions by these actors could reduce emissions up to 37%. We show how these actions can provide a stepped-up basis for additional federal action to reduce emissions by 49%—consistent with 1.5 °C. Our analysis demonstrates sub-national actions can lead to substantial reductions and support increased national action.
Overview
The claims and statistics of this paper haven’t been checked yet.
Run the check — free, no account needed. It reads the open-access text and checks the sources it cites.
Integrity signals
Registry
Cites
Statistics
Figures
Verification
Claims the paper makes
The claims and statistics of this paper haven’t been checked yet.
Run the check — free, no account needed. It reads the open-access text and checks the sources it cites.
Claims other papers make about this one
Each is checked against this paper’s own text: does it say what the citing paper says it does?
In the citing paper
“Currently, 25 US governors have committed to meeting the goals of the Paris Climate Agreement (9), and 23 of these, and the District of Columbia, have set economy-wide GHG reduction targets using statutory and/or legally binding executive action (10).”
From A framework for localizing global climate solutions and their carbon reduction potential (2021) · cites this paper as [9]
Self-check
Percentages, sums and reported differences re-computed from the paper’s own numbers.
The self-check needs the paper’s full text.
Citations
Cites
IPCC (2022) · Cambridge University Press eBooks · doi:10.1017/9781009157940 · Cited by 3,909
A roadmap for rapid decarbonization
Rockström, J., Gaffney, O., Rogelj, J., Meinshausen, M., Nakicenovic, N., & Schellnhuber, H. J. (2017) · Science · doi:10.1126/science.aah3443 · Cited by 1,225
Stokes, L. C. (2020) · doi:10.1093/oso/9780190074258.001.0001 · Cited by 544
“All Hands on Deck”: The Paris Agreement and Nonstate Climate Action
Hale, T. (2016) · Global Environmental Politics · doi:10.1162/glep_a_00362 · Cited by 448
Winning coalitions for climate policy
Meckling, J., Kelsey, N., Biber, E., & Zysman, J. (2015) · Science · doi:10.1126/science.aab1336 · Cited by 426
States on Steroids: The Intergovernmental Odyssey of American Climate Policy
Rabe, B. G. (2008) · Review of Policy Research · doi:10.1111/j.1541-1338.2007.00314.x · Cited by 277
Reinvigorating International Climate Policy: A Comprehensive Framework for Effective Nonstate Action
Chan, S., van Asselt, H., Hale, T. N., Abbott, K. W., Beisheim, M., Hoffmann, M. J., Guy, B., Höhne, N., Hsu, A., Pattberg, P. H., et al. (2015) · Global Policy · doi:10.1111/1758-5899.12294 · Cited by 260
The Paris Agreement: resolving the inconsistency between global goals and national contributions
Höhne, N., Kuramochi, T., Warnecke, C., Röser, F., Fekete, H., Hagemann, M., Day, T. J., Tewari, R., Kurdziel, M., Sterl, S. H., et al. (2016) · Climate Policy · doi:10.1080/14693062.2016.1218320 · Cited by 223
How to eat an elephant: a bottom-up approach to climate policy
Rayner, S. (2010) · Climate Policy · doi:10.3763/cpol.2010.0138 · Cited by 216
A research roadmap for quantifying non-state and subnational climate mitigation action
Hsu, A., Höhne, N., Kuramochi, T., Roelfsema, M., Weinfurter, A. J., Xie, Y., Lütkehermöller, K., Chan, S., Corfee-Morlot, J., Drost, P., et al. (2018) · Nature Climate Change · doi:10.1038/s41558-018-0338-z · Cited by 187
Self-citation
Research works printed but not linked: 1
- NewClimate Institute, Data-Driven Lab, PBL, German Development Institute/Deutsches Institut für Entwicklungspolitik (DIE), Blavatnik & School of Government, University of Oxford. Global Climate Action from Cities, Regions and Businesses: Impact of Individual Actors and Cooperative Initiatives on Global and National Emissions. https://newclimate.org/wp-content/uploads/2019/09/Report-Global-Climate-Action-from-Cities-Regions-and-Businesses_2019.pdf (2019).
Cited by
Sorted by citations
Items 101–117 of 117
Gong, W. (2025) · Oxford University Press eBooks · doi:10.1093/9780197757451.003.0012
Gong, W. (2025) · Oxford University Press eBooks · doi:10.1093/9780197757451.003.0001
APPENDIX Distribution of Interviews
Gong, W. (2025) · Oxford University Press eBooks · doi:10.1093/9780197757451.005.0001
Rethinking Subnational Climate Leadership in China and Beyond
Gong, W. (2025) · Oxford University Press eBooks · doi:10.1093/9780197757451.003.0008
Gong, W. (2025) · Oxford University Press eBooks · doi:10.1093/9780197757451.003.0004
Gong, W. (2025) · Oxford University Press eBooks · doi:10.1093/9780197757451.003.0006
Gong, W. (2025) · Oxford University Press eBooks · doi:10.1093/9780197757451.003.0007
Subnational Engagement in China’s Low-Carbon Energy Transitions
Gong, W. (2025) · Oxford University Press eBooks · doi:10.1093/9780197757451.003.0002
Subnational Methane Emissions Reduction in the U.S. and China: A Bottom-up EvaluationPreprint
Dai, F., Zhou, Y., Zhu, R., Guo, F., Gordon, J. A., Zhang, Z., Zhao, P., & Lee, H. (2026) · Research Square · doi:10.21203/rs.3.rs-8756496/v1
Fang, M., Fan, Y., Döring, T., & Shaw, S. D. (2026) · International Review of Economics & Finance · doi:10.1016/j.iref.2026.105166
Chen, A., Daniels, W., Huang, Z., Ravikumar, A. P., Jordaan, S. M., Zhang, Z., Feng, L., Liu, H., Murray, L. T., Yu, X., et al. (2026) · Communications Earth & Environment · doi:10.1038/s43247-026-04039-0
“S10)havesetexplicitGHGemissions reductiongoals 8 , and state action could yield a decrease in emissions irrespective of federal regulation 9 .”
Participatory Energy and Climate Planning
Brown, M. A., & Thomas, V. M. (2026) · Springer eBooks · doi:10.1007/978-3-032-07076-0_39
Role of the Courts and the U.S. Clean Air Act
Brown, M. A., & Thomas, V. M. (2026) · Springer eBooks · doi:10.1007/978-3-032-07076-0_29
Gentle, P., Bhatta, R., Lama, S., Mainaly, J., & Maraseni, T. (2026) · Regional & Federal Studies · doi:10.1080/13597566.2026.2663311
Regional net-zero emissions and social cost of carbon: From the multilevel governance framework
Li, X., Song, Y., Xing, P., & Yu, P. (2026) · ENVIRONMENTAL SYSTEMS RESEARCH · doi:10.1186/s40068-026-00478-y
“In particular, regional collaborations not only drive local decarboniza-tion but also contribute to national and global climate ambitions, expanding the analytical perspective to multi-level governance (Hultman et al. 2020).”
Wu, Y., Guo, R., & Liu, Y. (2026) · Technology Analysis and Strategic Management · doi:10.1080/09537325.2026.2722229
Risk transmission between greenhouse gas emissions and clean energy market
Zeng, H., Wang, Z., Abedin, M. Z., & Hájek, P. (2026) · Quantitative Finance · doi:10.1080/14697688.2026.2725749
Metadata
- Authors
- Hultman, N. E., Clarke, L., Frisch, C., Kennedy, K., McJeon, H., Cyrs, T., Hansel, P., Bodnar, P., Manion, M., Edwards, M. R., Cui, R., Bowman, C., Lund, J., Westphal, M. I., Clapper, A., Jaeger, J., Sen, A., Lou, J., Saha, D., Jaglom, W., Calhoun, K., Igusky, K., deWeese, J., Hammoud, K., Altimirano, J. C., Dennis, M., Henderson, C., Zwicker, G., & O’Neill, J.
- Affiliations
- University of Maryland, College Park (US)
- Rocky Mountain Institute (US)
- World Resources Institute (US)
- University of Wisconsin–Madison (US)
- Corresponding author
- Hultman, Nathan E.
- ORCID
- Venue
- Nature Communications
- Published
- 2020-10-16
- Volume
- 11
- Issue
- 1
- Pages
- 5255-5255
- ISSN
- 2041-1723 (ISSN-L)
- PMC
- PMC7568566
- OpenAlex
- W3092988441
- Cited by
- 116
- References
- 23
- Citations by year
- 2026: 12 · 2025: 29 · 2024: 21 · 2023: 20 · 2022: 14 · 2021: 19 · 2020: 1
- FWCI
- 11.69
- Type
- journal article
- Language
- en
- Open access
- gold
- doi.org
- Locations
- Nature Communications (publishedVersion, cc-by)
- PubMed Central (publishedVersion, cc-by)
- PubMed (publishedVersion)
- OSTI OAI (U.S. Department of Energy Office of Scientific and Technical Information) (submittedVersion)
- RePEc: Research Papers in Economics (submittedVersion)
- Communities in ADDI (University of the Basque Country) (submittedVersion, cc-by-nc-sa)
- DOAJ (DOAJ: Directory of Open Access Journals) (submittedVersion, cc-by-sa)
- Hispana (submittedVersion, cc-by-nc-sa)
- Funders
- Bloomberg Family Foundation
- Topics
- Social Sciences › Economics, Econometrics and Finance › Economics and Econometrics › Climate Change Policy and Economics
- Physical Sciences › Environmental Science › Global and Planetary Change › Sustainability and Climate Change Governance
- Physical Sciences › Environmental Science › Global and Planetary Change › Climate Change and Sustainable Development
- Keywords
- subnational climate action, national climate strategies, decarbonization, emission reduction, Paris Agreement, Nationally Determined Contributions, corporate climate commitments, integrated assessment models, 1.5°C target, United States climate policy, federal climate policy
About these checks
Registry, retraction, Cites and statistics results are computed, not judged, with one exception: a printed reference that no index lists is read once by a model before it counts as a citation error. Claims are extracted by a model and kept only when their quote appears verbatim in the text; each cited source is then checked, with a model’s help, for whether it says what the claim relies on. Those verdicts can be wrong — read the claim’s quote and the cited source before relying on one.
Statistics and arithmetic are recomputed, not judged.
Confidence bands are shown only for fields calibrated on our annotated test set. None is calibrated yet, so no band is shown.
What counts as a claim ›How we measure confidence ›How we check this ›
Are you an author, or do you see a problem with this page? Request a review
