

The DOI matches its Crossref record; 76 of the 76 references it cites were found in a registry or an index.
Perineuronal nets stabilize the grid cell network
Open accessPublished version of a preprint
Abstract
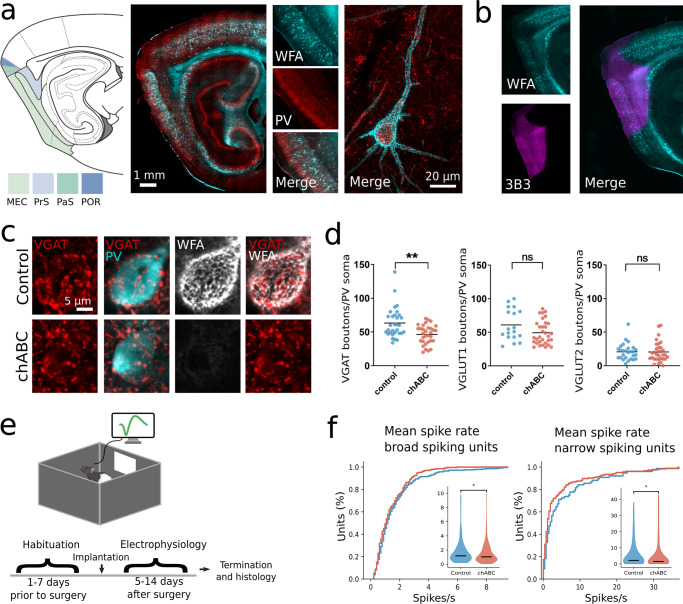
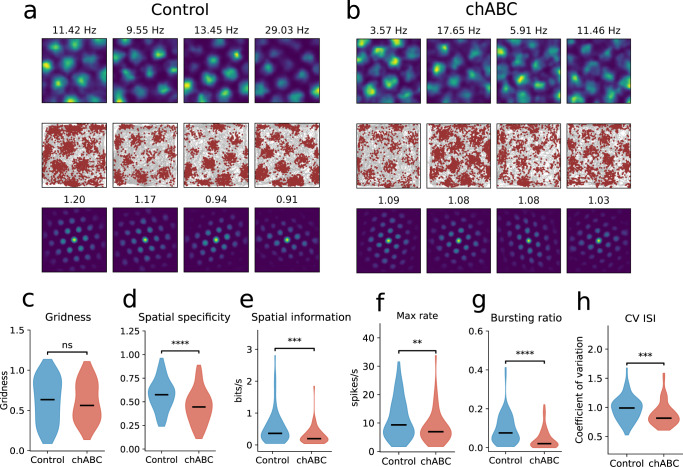
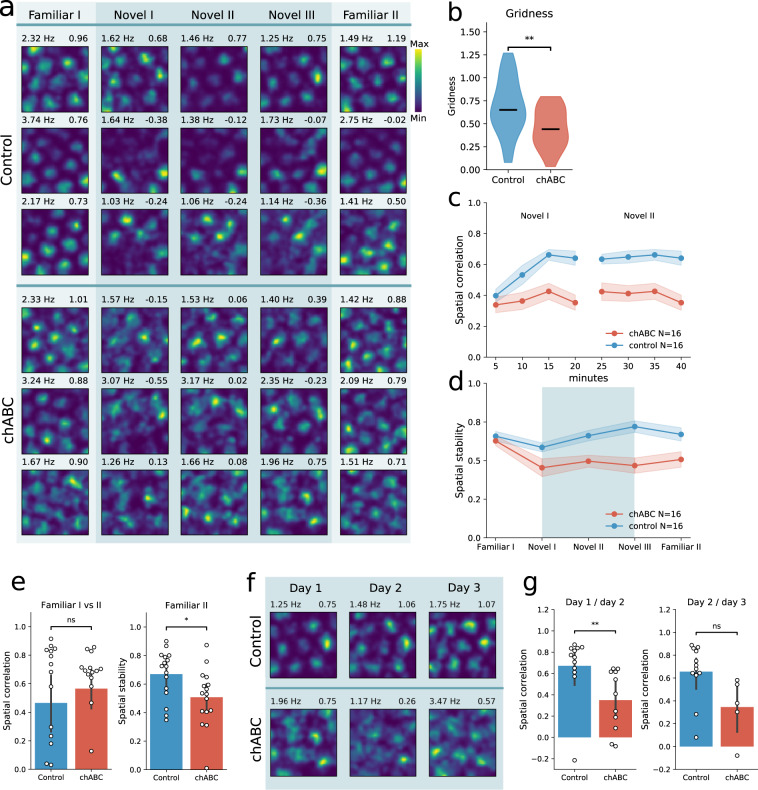
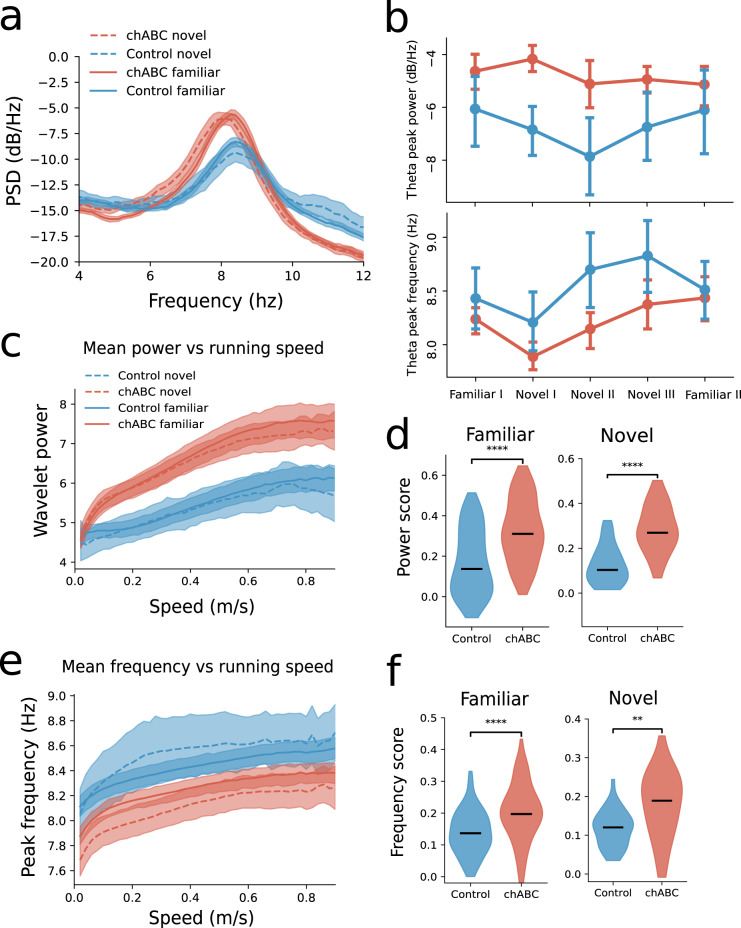
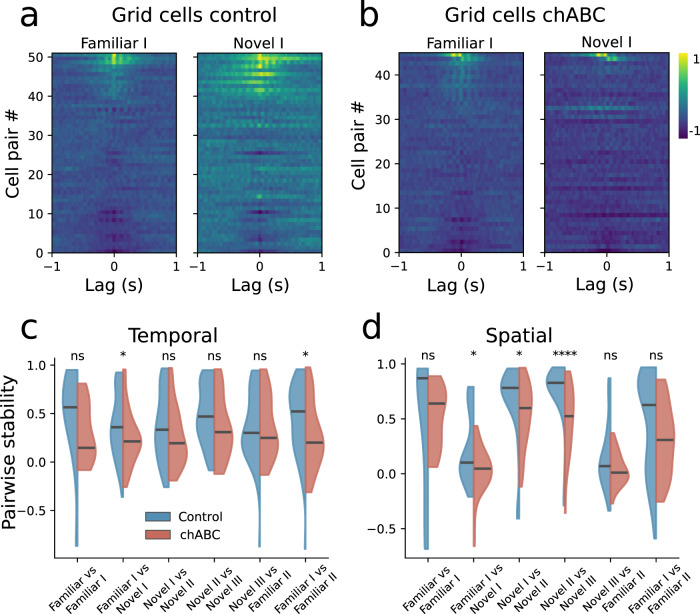
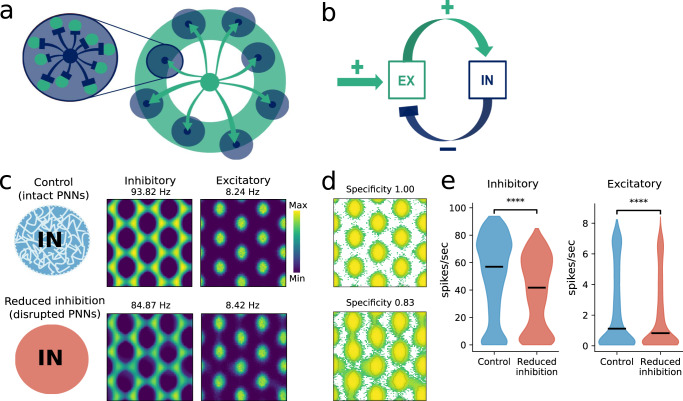
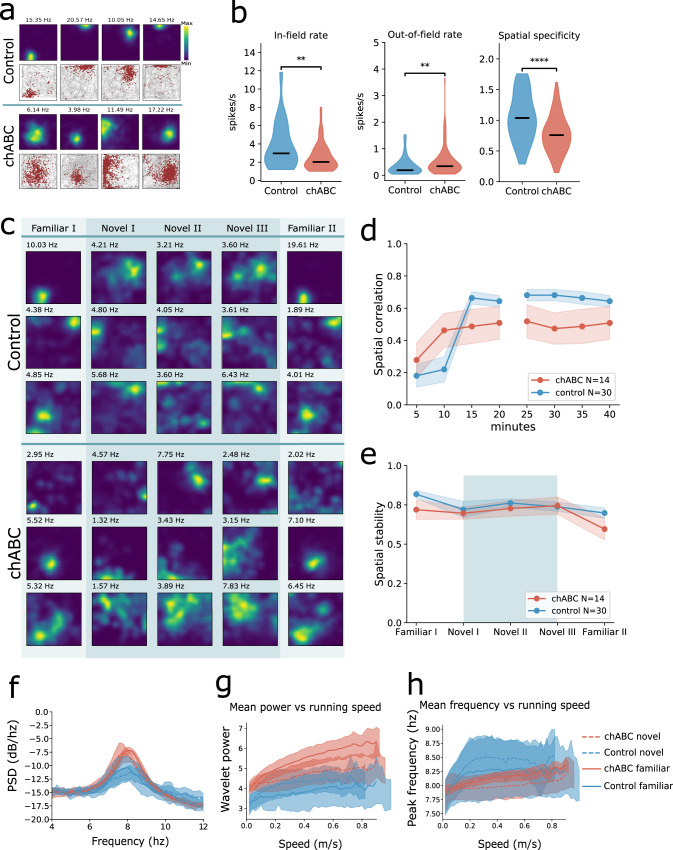
Grid cells are part of a widespread network which supports navigation and spatial memory. Stable grid patterns appear late in development, in concert with extracellular matrix aggregates termed perineuronal nets (PNNs) that condense around inhibitory neurons. It has been suggested that PNNs stabilize synaptic connections and long-term memories, but their role in the grid cell network remains elusive. We show that removal of PNNs leads to lower inhibitory spiking activity, and reduces grid cells' ability to create stable representations of a novel environment. Furthermore, in animals with disrupted PNNs, exposure to a novel arena corrupted the spatiotemporal relationships within grid cell modules, and the stored representations of a familiar arena. Finally, we show that PNN removal in entorhinal cortex distorted spatial representations in downstream hippocampal neurons. Together this work suggests that PNNs provide a key stabilizing element for the grid cell network.
Overview
The claims and statistics of this paper haven’t been checked yet.
Run the check — free, no account needed. It reads the open-access text and checks the sources it cites.
Integrity signals
Registry
Cites
Statistics
Figures
Verification
Claims the paper makes
The claims and statistics of this paper haven’t been checked yet.
Run the check — free, no account needed. It reads the open-access text and checks the sources it cites.
Claims other papers make about this one
Each is checked against this paper’s own text: does it say what the citing paper says it does?
The source backs part of the claim, not all of it — or backs it for a different population, condition or comparison.
In the citing paper
“and in V1 visual cortex, ChABC decreases both excitatory and inhibitory inputs to PV interneurons [46, 47].”
From The extracellular matrix and perineuronal nets in memory (2022) · cites this paper as [46]
Experimental — accuracy not yet measuredThe source backs part of the claim, not all of it — or backs it for a different population, condition or comparison.
In the citing paper
“Both hippocampus and perirhinal cortex are rich in PV interneurons enwrapped with PNNs, and PNNs are also present on some hippocampal pyramidal neurons [46, 101, 102].”
From The extracellular matrix and perineuronal nets in memory (2022) · cites this paper as [46]
Experimental — accuracy not yet measuredThe source backs part of the claim, not all of it — or backs it for a different population, condition or comparison.
In the citing paper
“All the social memory associated regions are highly populated with PNN-surrounded PV neurons [46, 66, 130, 131].”
From The extracellular matrix and perineuronal nets in memory (2022) · cites this paper as [46]
Experimental — accuracy not yet measuredThe cited source says what the claim attributes to it.
In the citing paper
“while in the entorhinal cortex, ChABC reduces inhibitory inputs”
From The extracellular matrix and perineuronal nets in memory (2022) · cites this paper as [46]
The cited source says what the claim attributes to it.
In the citing paper
“Following PNN removal in entorhinal cortex there are distorted spatial representations in downstream hippocampal neurons (Fig. 2C) [46].”
From The extracellular matrix and perineuronal nets in memory (2022) · cites this paper as [46]
The cited source says what the claim attributes to it.
In the citing paper
“This suggests that PNNs contribute to ensure a rigid grid cell network, which is essential for new representations to form, and that the heightened network plasticity caused by PNN removal interferes with stored spatial representations and perhaps memories.”
From The extracellular matrix and perineuronal nets in memory (2022) · cites this paper as [46]
The cited source says what the claim attributes to it.
In the citing paper
“However, degradation of PNNs in medial entorhinal cortex, where PV positive neurons are enwrapped in particularly dense PNNs, destabilizes the grid cell networks leading to impaired representations of new environments [46].”
From The extracellular matrix and perineuronal nets in memory (2022) · cites this paper as [46]
The cited source says what the claim attributes to it.
In the citing paper
“This suggests that PNNs contribute to ensure a rigid grid cell network, which is essential for new representations to form, and that the heightened network plasticity caused by PNN removal interferes with stored spatial representations and perhaps memories.”
From The extracellular matrix and perineuronal nets in memory (2022) · cites this paper as [46]
The check wasn’t confident either way, so it gives no verdict — never disputed.
In the citing paper
“The higher performance in prokaryotes is consistent with previous observations regarding the availability of evolutionary information in prokaryotes compared to Eukarya27 (Supplementary Fig. 1).”
From Improved prediction of protein-protein interactions using AlphaFold2 (2021) · cites this paper as [27]
Experimental — accuracy not yet measuredThe check wasn’t confident either way, so it gives no verdict — never disputed.
In the citing paper
“Another recently published method obtains AUC 0.76 on this set27.”
From Improved prediction of protein-protein interactions using AlphaFold2 (2021) · cites this paper as [27]
Experimental — accuracy not yet measuredThe check wasn’t confident either way, so it gives no verdict — never disputed.
In the citing paper
“We used 1661 protein complexes with known interfaces from a recent study27 to test the developed pipeline.”
From Improved prediction of protein-protein interactions using AlphaFold2 (2021) · cites this paper as [27]
Experimental — accuracy not yet measuredThe check wasn’t confident either way, so it gives no verdict — never disputed.
In the citing paper
“The study of AF2s ability to separate interacting and non-interacting proteins here contains more extensive data than recent studies27.”
From Improved prediction of protein-protein interactions using AlphaFold2 (2021) · cites this paper as [27]
Experimental — accuracy not yet measuredThe check wasn’t confident either way, so it gives no verdict — never disputed.
In the citing paper
“Pairing the correct sequences should result in MSAs containing inter-chain co-evolutionary information27.”
From Improved prediction of protein-protein interactions using AlphaFold2 (2021) · cites this paper as [27]
Experimental — accuracy not yet measuredThe check wasn’t confident either way, so it gives no verdict — never disputed.
In the citing paper
“PLCG2 polymorphisms are associated with both reduced and increased risk of Alzheimer’s disease (AD) and with longevity.”
From Multi-omics analyses reveal novel effects of PLCγ2 deficiency in the mouse brain (2023) · cites this paper as [7]
Experimental — accuracy not yet measured
Self-check
Percentages, sums and reported differences re-computed from the paper’s own numbers.
The self-check needs the paper’s full text.
Citations
Cites
Microstructure of a spatial map in the entorhinal cortex
Hafting, T., Fyhn, M., Molden, S., Moser, M.-B., & Moser, E. I. (2005) · Nature · doi:10.1038/nature03721 · Cited by 4,068
Self-citationMechanisms of Gamma Oscillations
Buzsáki, G., & Wang, X.-J. (2012) · Annual Review of Neuroscience · doi:10.1146/annurev-neuro-062111-150444 · Cited by 2,796
Critical period plasticity in local cortical circuits
Hensch, T. K. (2005) · Nature Reviews Neuroscience · doi:10.1038/nrn1787 · Cited by 2,323
Path integration and the neural basis of the 'cognitive map'
McNaughton, B. L., Battaglia, F. P., Jensen, O., Moser, E. I., & Moser, M.-B. (2006) · Nature Reviews Neuroscience · doi:10.1038/nrn1932 · Cited by 2,024
Reactivation of Ocular Dominance Plasticity in the Adult Visual Cortex
Pizzorusso, T., Medini, P., Berardi, N., Chierzi, S., Fawcett, J. W., & Maffei, L. (2002) · Science · doi:10.1126/science.1072699 · Cited by 1,679
The effects of changes in the environment on the spatial firing of hippocampal complex-spike cells
Muller, R., & Kubie, J. (1987) · The Journal of Neuroscience · doi:10.1523/jneurosci.07-07-01951.1987 · Cited by 1,581
Conjunctive Representation of Position, Direction, and Velocity in Entorhinal Cortex
Sargolini, F., Fyhn, M., Hafting, T., McNaughton, B. L., Witter, M. P., Moser, M.-B., & Moser, E. I. (2006) · Science · doi:10.1126/science.1125572 · Cited by 1,485
Self-citationThree groups of interneurons account for nearly 100% of neocortical GABAergic neurons
Rudy, B., Fishell, G., Lee, S., & Hjerling‐Leffler, J. (2011) · Developmental Neurobiology · doi:10.1002/dneu.20853 · Cited by 1,420
Spatial representation in the entorhinal cortex
Fyhn, M., Molden, S., Witter, M. P., Moser, E. I., & Moser, M.-B. (2004) · Science · doi:10.1126/science.1099901 · Cited by 1,339
Self-citationIntracellular Features Predicted by Extracellular Recordings in the Hippocampus In Vivo
Henze, D. A., Borhegyi, Z., Csicsvari, J., Mamiya, A., Harris, K. D., & Buzsáki, G. (2000) · Journal of Neurophysiology · doi:10.1152/jn.2000.84.1.390 · Cited by 942
Cited by
Sorted by citations
Items 301–400 of 1,004
Wirth, R., Bagi, Z., Shetty, P., Szuhaj, M., Cheung, T. T. S., Kovács, K. L., & Maróti, G. (2023) · The ISME Journal · doi:10.1038/s41396-023-01448-3 · Cited by 33
Ham, D. T., Browne, T. S., Banglorewala, P. N., Wilson, T. L., Michael, R. K., Gloor, G. B., & Edgell, D. R. (2023) · Nature Communications · doi:10.1038/s41467-023-41143-7 · Cited by 33
Multiple introductions and country-wide spread of DENV-2 genotype II (Cosmopolitan) in Brazil
Gräf, T., Ferreira, C. D. N., de Lima, G. B., de Lima, R. E., Machado, L. C., Campos, T. D. L., Schemberger, M. O., Faoro, H., Paiva, M. H. S., Bezerra, M. F., et al. (2023) · Virus Evolution · doi:10.1093/ve/vead059 · Cited by 31
Protein Recruitment to Dynamic DNA-RNA Host Condensates
Dizani, M., Sorrentino, D., Agarwal, S., Stewart, J. M., & Franco, E. (2024) · Journal of the American Chemical Society · doi:10.1021/jacs.4c07555 · Cited by 31
Optimal vaccine allocation for COVID-19 in the Netherlands: A data-driven prioritization
Miura, F., Leung, K. Y., Klinkenberg, D., Ainslie, K. E. C., & Wallinga, J. (2021) · PLoS Computational Biology · doi:10.1371/journal.pcbi.1009697 · Cited by 30
Hernández‐Vivanco, A., Cano-Adamuz, N., Sánchez-Aguilera, A., González‐Alonso, A., Rodríguez-Fernández, A., Azcoitia, Í., de la Prida, L. M., & Méndez, P. (2022) · Nature Communications · doi:10.1038/s41467-022-31635-3 · Cited by 37
Test-retest reliability of the human connectome: An OPM-MEG study
Rier, L., Michelmann, S., Ritz, H., Shah, V., Hill, R. M., Osborne, J., Doyle, C., Holmes, N., Bowtell, R. W., Brookes, M. J., et al. (2023) · Imaging Neuroscience · doi:10.1162/imag_a_00020 · Cited by 32
Ansell, T. B., Song, W., Coupland, C. E., Carrique, L., Corey, R. A., Duncan, A. L., Cassidy, C. K., Geurts, M. M. G., Rasmussen, T., Ward, A. B., et al. (2023) · Nature Communications · doi:10.1038/s41467-023-43392-y · Cited by 33
Blood protein levels predict leading incident diseases and mortality in UK BiobankPreprint
Gadd, D. A., Hillary, R. F., Kuncheva, Z., Mangelis, T., Cheng, Y., Dissanayake, M., Admanit, R., Gagnon, J., Lin, T.-C., Ferber, K. L., et al. (2023) · medRxiv · doi:10.1101/2023.05.01.23288879 · Cited by 31
Unsupervised learning reveals interpretable latent representations for translucency perception
Liao, C., Sawayama, M., & Xiao, B. (2023) · PLoS Computational Biology · doi:10.1371/journal.pcbi.1010878 · Cited by 28
Population Genomics of Wall Lizards Reflects the Dynamic History of the Mediterranean Basin
Yang, W., Feiner, N., Salvi, D., Laakkonen, H. M., Jablonski, D., Pinho, C., Carretero, M. Á., Sacchi, R., Zuffi, M. A. L., Scali, S., et al. (2021) · Molecular Biology and Evolution · doi:10.1093/molbev/msab311 · Cited by 33
Ledesma, M. M. G. L., Sánchez, L., Ojeda, D. S., Rouco, S. O., Rossi, A. H., Varese, A., Mazzitelli, I. G., Pascuale, C. A., Miglietta, E. A., Rodríguez, P. E., et al. (2022) · mBio · doi:10.1128/mbio.03442-21 · Cited by 31
Pradenas, E., Trinité, B., Urrea, V., Marfil, S., Tarrés-Freixas, F., Ortiz, R., Rovirosa, C., Rodon, J., Vergara‐Alert, J., Segalés, J., et al. (2022) · Cell Reports Medicine · doi:10.1016/j.xcrm.2022.100523 · Cited by 29
Cook, G. M., Brown, K., Shang, P., Li, Y., Soday, L., Dinan, A. M., Tumescheit, C., Mockett, A. P. A., Fang, Y., Firth, A. E., et al. (2022) · eLife · doi:10.7554/elife.75668 · Cited by 30
Modeling of protein conformational changes with Rosetta guided by limited experimental data
Sala, D., del Alamo, D., Mchaourab, H. S., & Meiler, J. (2022) · Structure · doi:10.1016/j.str.2022.04.013 · Cited by 30
Fischer, E. S., Yu, C. W.-H., Hevler, J. F., McLaughlin, S. H., Maslen, S., Heck, A. J. R., Freund, S. M. V., & Barford, D. (2022) · Nature Communications · doi:10.1038/s41467-022-34058-2 · Cited by 28
Golding, N., Price, D. J., RYAN, G. E., McVernon, J., McCaw, J. M., & Shearer, F. M. (2023) · eLife · doi:10.7554/elife.78089 · Cited by 28
Sommerer, Y., Dobričić, V., Schilling, M., Ohlei, O., Sabet, S. S., Wesse, T., Fuß, J., Franzenburg, S., Franke, A., Parkkinen, L., et al. (2023) · Alzheimer s Research & Therapy · doi:10.1186/s13195-023-01232-7 · Cited by 29
Chakraborty, C., Nissen, I., Vincent, C. A., Hägglund, A., Hörnblad, A., & Remeseiro, S. (2023) · Nature Communications · doi:10.1038/s41467-023-41919-x · Cited by 30
Reitzner, S. M., Emanuelsson, E. B., Arif, M., Kaczkowski, B., Kwon, A. T.-J., Mardinoğlu, A., Arner, E., Chapman, M., & Sundberg, C. J. (2023) · Molecular Metabolism · doi:10.1016/j.molmet.2023.101857 · Cited by 37
Zhang, F., Jonsson, A. H., Nathan, A., Wei, K., Millard, N., Xiao, Q., Gutiérrez‐Arcelus, M., Apruzzese, W. A., Watts, G. F. M., Weisenfeld, D., et al. (2022) · bioRxiv (Cold Spring Harbor Laboratory) · doi:10.1101/2022.02.25.481990 · Cited by 30
Mito-FUNCAT-FACS reveals cellular heterogeneity in mitochondrial translation
Kimura, Y., Saito, H., Osaki, T., Ikegami, Y., Wakigawa, T., Ikeuchi, Y., & Iwasaki, S. (2022) · RNA · doi:10.1261/rna.079097.122 · Cited by 30
Batstone, R. T., Burghardt, L. T., & Heath, K. D. (2022) · Proceedings of the Royal Society B Biological Sciences · doi:10.1098/rspb.2022.0477 · Cited by 25
Martinez, J., Ant, T. H., Murdochy, S. M., Tong, L., Filipe, A. D. S., & Sinkins, S. P. (2022) · PLoS Genetics · doi:10.1371/journal.pgen.1010406 · Cited by 29
González-Rodríguez, E., Zol-Hanlon, M. I., Bineva‐Todd, G., Marchesi, A., Skehel, M. J., Mahoney, K. E., Roustan, C., Borg, A., Vagno, L. D., Kjær, S., et al. (2023) · ACS Central Science · doi:10.1021/acscentsci.2c01349 · Cited by 28
An optogenetic toolkit for light-inducible antibiotic resistance
Sheets, M. B., Tague, N., & Dunlop, M. J. (2023) · Nature Communications · doi:10.1038/s41467-023-36670-2 · Cited by 29
Franchini, M., Pellecchia, S., Viscido, G., & Gambardella, G. (2023) · NAR Genomics and Bioinformatics · doi:10.1093/nargab/lqad024 · Cited by 30
Allosteric regulation and crystallographic fragment screening of SARS-CoV-2 NSP15 endoribonuclease
Godoy, A. S., Nakamura, A. M., Douangamath, A., Song, Y., Noske, G. D., Gawriljuk, V. O., Fernandes, R. S., Pereira, H. M., de Oliveira, K. I. Z., Fearon, D., et al. (2023) · Nucleic Acids Research · doi:10.1093/nar/gkad314 · Cited by 29
Basalla, J. L., Mak, C. A., Byrne, J. A., Ghalmi, M., Hoang, Y., & Vecchiarelli, A. G. (2023) · eLife · doi:10.7554/elife.81362 · Cited by 29
syntenet: an R/Bioconductor package for the inference and analysis of synteny networks
Almeida‐Silva, F., Zhao, T., Ullrich, K. K., Schranz, M. E., & de Peer, Y. V. (2022) · Bioinformatics · doi:10.1093/bioinformatics/btac806 · Cited by 28
Mechanical control of the mammalian circadian clock via YAP/TAZ and TEAD
Abenza, J. F., Rossetti, L., Mouelhi, M., Burgués, J., Andreu, I., Kennedy, K., Roca‐Cusachs, P., Marco, S., García‐Ojalvo, J., & Trepat, X. (2023) · The Journal of Cell Biology · doi:10.1083/jcb.202209120 · Cited by 30
Hub architecture of the human structural connectome: Links to aging and processing speed
Li, X., Salami, A., & Persson, J. (2023) · NeuroImage · doi:10.1016/j.neuroimage.2023.120270 · Cited by 31
Wallace, M., Zahr, H. C., Perati, S., Morsink, C. D., Johnson, L. E., Gacita, A. M., Lai, S., Wallrath, L. L., Benjamin, I. J., McNally, E. M., et al. (2023) · Molecular Biology of the Cell · doi:10.1091/mbc.e21-10-0527 · Cited by 35
D’Amore, V. M., Conflitti, P., Marinelli, L., & Limongelli, V. (2024) · Chem · doi:10.1016/j.chempr.2024.08.004 · Cited by 27
Occurrence of “under-the-radar” antibiotic resistance in anthropogenically affected produce
Davidovich, C., Erokhina, K., Gupta, C. L., Zhu, Y., Su, J., Djordjevic, S. P., Wyrsch, E. R., Blum, S. E., & Cytryn, E. J. (2025) · The ISME Journal · doi:10.1093/ismejo/wrae261 · Cited by 28
Akhtar, Z., Islam, M. A., Aleem, M. A., Mah‐E‐Muneer, S., Ahmmed, M. K., Ghosh, P. K., Rahman, M., Rahman, M. Z., Sumiya, M. K., Rahman, M. M., et al. (2021) · BMJ Open · doi:10.1136/bmjopen-2021-053768 · Cited by 28
Neutron crystallography reveals mechanisms used by Pseudomonas aeruginosa for host-cell binding
Gajdos, L., Blakeley, M. P., Haertlein, M., Forsyth, V. T., Devos, J. M., & Imberty, A. (2022) · Nature Communications · doi:10.1038/s41467-021-27871-8 · Cited by 28
Paz, S. M., Schmitz, J. P. J., dos Santos, V. A. P. M., & Diez, M. S. (2022) · Microbial Biotechnology · doi:10.1111/1751-7915.13995 · Cited by 27
Controlled X‐chromosome dynamics defines meiotic potential of female mouse in vitro germ cells
Severino, J., Bauer, M., Mattimoe, T., Arecco, N., Cozzuto, L., Lorden, P., Hamada, N., Nosaka, Y., Nagaoka, S. I., Audergon, P. N. C. B., et al. (2022) · The EMBO Journal · doi:10.15252/embj.2021109457 · Cited by 25
Marzec-Schmidt, K., Ghosheh, N., Stahlschmidt, S. R., Küppers-Munther, B., Synnergren, J., & Ulfenborg, B. (2023) · Stem Cells · doi:10.1093/stmcls/sxad049 · Cited by 29
Awake ripples enhance emotional memory encoding in the human brain
Zhang, H., Skelin, I., Ma, S., Paff, M. R., Mnatsakanyan, L., Yassa, M. A., Knight, R. T., & Lin, J. J. (2024) · Nature Communications · doi:10.1038/s41467-023-44295-8 · Cited by 31
Kaye, E. G., Basavaraju, K., Nelson, G. M., Zomer, H. D., Roy, D., Joseph, I. I., Rajabi‐Toustani, R., Qiao, H., Adelman, K., & Reddi, P. P. (2024) · Nature Communications · doi:10.1038/s41467-024-45177-3 · Cited by 28
Linsenmeier, M., Faltova, L., Palmiero, U. C., Seiffert, C., Küffner, A. M., Pinotsi, D., Zhou, J., Mezzenga, R., & Arosio, P. (2022) · bioRxiv (Cold Spring Harbor Laboratory) · doi:10.1101/2022.05.23.493075 · Cited by 28
Predictive neural representations of naturalistic dynamic input
de Vries, I. E. J., & Wurm, M. F. (2023) · Nature Communications · doi:10.1038/s41467-023-39355-y · Cited by 28
Parthasarathy, D., Pothula, K. R., Dam, K.-M. A., Ratnapriya, S., Cervera, H., Parsons, R., Huang, X., Sammour, S., Janowska, K., Harris, M., et al. (2024) · Nature Communications · doi:10.1038/s41467-024-51656-4 · Cited by 31
Swanson, R. A., Chinigò, E., Levenstein, D., Vöröslakos, M., Mousavi, N., Wang, X., Basu, J., & Buzsáki, G. (2025) · Neuron · doi:10.1016/j.neuron.2024.12.019 · Cited by 30
Environmental enrichment reduces food seeking and taking in rats: A review
Grimm, J. W., & Sauter, F. (2020) · Pharmacology Biochemistry and Behavior · doi:10.1016/j.pbb.2020.172874 · Cited by 27
Neuron–Oligodendrocyte Communication in Myelination of Cortical GABAergic Cells
Mazuir, E., Fricker, D., & Sol‐Foulon, N. (2021) · Life · doi:10.3390/life11030216 · Cited by 27
Dynamic neurogenomic responses to social interactions and dominance outcomes in female paper wasps
Uy, F. M. K., Jernigan, C. M., Zaba, N. C., Mehrotra, E., Miller, S., & Sheehan, M. J. (2021) · PLoS Genetics · doi:10.1371/journal.pgen.1009474 · Cited by 31
Sugiyama, M. G., Cui, H., Redka, D. S., Karimzadeh, M., Rujas, E., Maan, H., Hayat, S., Cheung, K., Misra, R., McPhee, J. B., et al. (2021) · Scientific Reports · doi:10.1038/s41598-021-02432-7 · Cited by 24
Early Neutrophilia Marked by Aerobic Glycolysis Sustains Host Metabolism and Delays Cancer Cachexia
Petruzzelli, M., Ferrer, M., Schuijs, M. J., Kleeman, S. O., Mourikis, N., Hall, Z., Perera, D., Raghunathan, S., Vacca, M., Gaude, E., et al. (2022) · Cancers · doi:10.3390/cancers14040963 · Cited by 28
Microsimulation based quantitative analysis of COVID-19 management strategies
Reguly, I. Z., Csercsik, D., Juhász, J., Tornai, K., Bujtár, Z., Horváth, G., Keömley-Horváth, B. M., Kós, T., Cserey, G., Iván, K., et al. (2022) · PLoS Computational Biology · doi:10.1371/journal.pcbi.1009693 · Cited by 28
Suntronwong, N., Yorsaeng, R., Puenpa, J., Auphimai, C., Thongmee, T., Vichaiwattana, P., Kanokudom, S., Duangchinda, T., Chantima, W., Pakchotanon, P., et al. (2022) · Vaccines · doi:10.3390/vaccines10030391 · Cited by 24
Beale, S., Hoskins, S., Byrne, T., Fong, W. L. E., Fragaszy, E., Geismar, C., Kovar, J., Navaratnam, A. M. D., Nguyen, V. G., Patel, P., et al. (2022) · The Lancet Regional Health - Europe · doi:10.1016/j.lanepe.2022.100352 · Cited by 27
Su, C.-L., Cheng, C., Yen, P.-H., Huang, J., Ting, Y., & Chiang, P. (2022) · Communications Biology · doi:10.1038/s42003-022-04124-y · Cited by 28
Perineuronal nets affect memory and learning after synapse withdrawal
Růžička, J., Dalecká, M., Safrankova, K., Peretti, D., Mallucci, G. R., Jendelová, P., Kwok, J. C. F., & Fawcett, J. W. (2022) · Translational Psychiatry · doi:10.1038/s41398-022-02226-z · Cited by 27
Genetically personalised organ-specific metabolic models in health and disease
Foguet, C., Xu, Y., Ritchie, S. C., Lambert, S. A., Persyn, E., Nath, A. P., Davenport, E. E., Roberts, D. J., Paul, D. S., Angelantonio, E. D., et al. (2022) · Nature Communications · doi:10.1038/s41467-022-35017-7 · Cited by 26
Tague, N., Lin, H., Lugagne, J., O’Connor, O. M., Burman, D., Wong, W. W., Cheng, J., & Dunlop, M. J. (2023) · Advanced Science · doi:10.1002/advs.202206519 · Cited by 26
Digital Manufacturing of Functional Ready‐to‐Use Microfluidic Systems
Karamzadeh, V., Kashani, A. S., Shen, M. L., & Juncker, D. (2023) · Advanced Materials · doi:10.1002/adma.202303867 · Cited by 27
DNA methylation signatures of early-life adversity are exposure-dependent in wild baboons
Anderson, J. A., Lin, D., Lea, A. J., Johnston, R. A., Voyles, T., Akinyi, M. Y., Archie, E. A., Alberts, S. C., & Tung, J. (2024) · Proceedings of the National Academy of Sciences · doi:10.1073/pnas.2309469121 · Cited by 26
Loop-extruders alter bacterial chromosome topology to direct entropic forces for segregation
Harju, J., van Teeseling, M. C. F., & Broedersz, C. P. (2024) · Nature Communications · doi:10.1038/s41467-024-49039-w · Cited by 27
Tyshkovskiy, A., Kholdina, D., Ying, K., Davitadze, M., Molière, A., Tongu, Y., Kasahara, T., Kats, L., Vladimirova, A., Moldakozhayev, A., et al. (2024) · bioRxiv (Cold Spring Harbor Laboratory) · doi:10.1101/2024.07.04.601982 · Cited by 32
Schøyen, V., Pettersen, M. B., Holzhausen, K., Fyhn, M., Malthe-Sørenssen, A., & Lepperød, M. E. (2023) · iScience · doi:10.1016/j.isci.2023.108102 · Cited by 28
Self-citationLekkala, V. K. R., Kang, S.-Y., Liu, J., Shrestha, S., Acharya, P., Joshi, P., Zolfaghar, M., Lee, M., Vanga, M. G., Jamdagneya, P., et al. (2024) · ACS Biomaterials Science & Engineering · doi:10.1021/acsbiomaterials.4c00179 · Cited by 25
Ramakrishnaiah, Y., Maćešić, N., Webb, G. I., Peleg, A. Y., & Tyagi, S. (2025) · International Journal of Medical Informatics · doi:10.1016/j.ijmedinf.2025.105816 · Cited by 36
Analysis of single-cell RNA sequencing data based on autoencoders
Tangherloni, A., Ricciuti, F., Besozzi, D., Lió, P., & Cvejic, A. (2021) · BMC Bioinformatics · doi:10.1186/s12859-021-04150-3 · Cited by 30
Liu, L., Zhang, Y., Men, S., Li, X., Hou, S., & Ju, J. (2023) · Hippocampus · doi:10.1002/hipo.23503 · Cited by 27
Exocytosis of the silicified cell wall of diatoms involves extensive membrane disintegration
de Haan, D., Aram, L., Peled‐Zehavi, H., Addadi, Y., Ben-Joseph, O., Rotkopf, R., Elad, N., Rechav, K., & Gal, A. (2023) · Nature Communications · doi:10.1038/s41467-023-36112-z · Cited by 27
Phospho-seq: integrated, multi-modal profiling of intracellular protein dynamics in single cells
Blair, J. D., Hartman, A., Zenk, F. L., Wahle, P., Brancati, G., Dalgarno, C., Treutlein, B., & Satija, R. (2025) · Nature Communications · doi:10.1038/s41467-025-56590-7 · Cited by 27
Hadisurya, M., Lee, Z.-C., Luo, Z., Zhang, G., Ding, Y., Zhang, H., Iliuk, A. B., Пили, Р., Boris, R. S., & Tao, W. A. (2023) · Molecular & Cellular Proteomics · doi:10.1016/j.mcpro.2023.100536 · Cited by 27
Levakov, G., Kaplan, A., Meir, A. Y., Rinott, E., Tsaban, G., Zelicha, H., Blüher, M., Ceglarek, U., Stümvoll, M., Shelef, I., et al. (2023) · eLife · doi:10.7554/elife.83604 · Cited by 27
The ecology of viruses in urban rodents with a focus on SARS-CoV-2
Fisher, A. M., Airey, G., Liu, Y., Gemmell, M., Thomas, J., Bentley, E. G., Whitehead, M., Paxton, W. A., Pollakis, G., Paterson, S., et al. (2023) · Emerging Microbes & Infections · doi:10.1080/22221751.2023.2217940 · Cited by 25
Universal chromatin state annotation of the mouse genome
Vu, H., & Ernst, J. (2023) · Genome biology · doi:10.1186/s13059-023-02994-x · Cited by 26
Stromal-derived NRG1 enables oncogenic KRAS bypass in pancreas cancerPreprint
Han, J., Xu, J., Liu, Y., Liang, S., LaBella, K. A., Chakravarti, D., Spring, D. J., Xia, Y., & DePinho, R. A. (2023) · Genes & Development · doi:10.1101/gad.351037.123 · Cited by 27
An essential and highly selective protein import pathway encoded by nucleus-forming phage
Morgan, C. J., Enustun, E., Armbruster, E. G., Birkholz, E. A., Prichard, A., Forman, T., Aindow, A., Wannasrichan, W., Peters, S., Inlow, K., et al. (2024) · Proceedings of the National Academy of Sciences · doi:10.1073/pnas.2321190121 · Cited by 25
Prediction of ciprofloxacin resistance in hospitalized patients using machine learning
Mintz, I., Chowers, M., & Obolski, U. (2023) · Communications Medicine · doi:10.1038/s43856-023-00275-z · Cited by 26
Exploring the host range for genetic transfer of magnetic organelle biosynthesis
Dziuba, M. V., Müller, F. D., Pósfai, M., & Schüler, D. (2023) · Nature Nanotechnology · doi:10.1038/s41565-023-01500-5 · Cited by 26
Li, X., Wu, X., Lu, T., Kuang, C., Si, Y., Zheng, W., Li, Z., & Xue, Y.-X. (2024) · International Journal of Molecular Sciences · doi:10.3390/ijms25063412 · Cited by 28
A non-canonical mechanism of GPCR activation
Powers, A. S., Khan, A. A., Paggi, J. M., Latorraca, N. R., Souza, S., Salvo, J. D., Lu, J., Soisson, S. M., Johnston, J. M., Weinglass, A. B., et al. (2024) · Nature Communications · doi:10.1038/s41467-024-54103-6 · Cited by 25
Lei, P., Ruscic, K. J., Roh, K., Rajotte, J. J., O’Melia, M. J., Bouta, E. M., Marquez, M., Pereira, E. R., Kumar, A. S., Razavi, M. S., et al. (2023) · Developmental Cell · doi:10.1016/j.devcel.2024.12.010 · Cited by 27
VASP-mediated actin dynamics activate and recruit a filopodia myosin
Arthur, A. L., Crawford, A., Houdusse, A., & Titus, M. A. (2021) · eLife · doi:10.7554/elife.68082 · Cited by 25
Automating UbiFast for High-throughput and Multiplexed Ubiquitin Enrichment
Rivera, K. D., Olive, M. E., Bergstrom, E. J., Nelson, A. J., Lee, K. A., Satpathy, S., Carr, S. A., & Udeshi, N. D. (2021) · Molecular & Cellular Proteomics · doi:10.1016/j.mcpro.2021.100154 · Cited by 26
Xu, C., Fang, X., Lu, T.-C., & Dean, C. (2021) · Proceedings of the National Academy of Sciences · doi:10.1073/pnas.2113757118 · Cited by 25
Net gain and loss: influence of natural rewards and drugs of abuse on perineuronal nets
Brown, T. E., & Sorg, B. A. (2022) · Neuropsychopharmacology · doi:10.1038/s41386-022-01337-x · Cited by 25
Combrisson, E., Allegra, M., Basanisi, R., Ince, R. A. A., Giordano, B. L., Bastin, J., & Brovelli, A. (2022) · NeuroImage · doi:10.1016/j.neuroimage.2022.119347 · Cited by 31
ESCPE-1 mediates retrograde endosomal sorting of the SARS-CoV-2 host factor Neuropilin-1
Simonetti, B., Daly, J. L., Simón‐Gracia, L., Klein, K., Weeratunga, S. K., Antón-Plágaro, C., Tobi, A., Hodgson, L. R., Lewis, P. A., Heesom, K. J., et al. (2022) · Proceedings of the National Academy of Sciences · doi:10.1073/pnas.2201980119 · Cited by 27
Sherman, B. E., Graves, K. N., Huberdeau, D. M., Quraishi, I. H., Damisah, E. C., & Turk‐Browne, N. B. (2022) · Journal of Neuroscience · doi:10.1523/jneurosci.0708-22.2022 · Cited by 27
Zhang, Y., Xiang, G., Jiang, A. Y., Lynch, A. W., Zeng, Z., Wang, C., Zhang, W., Fan, J., Kang, J., Gu, S. S., et al. (2023) · Nature Communications · doi:10.1038/s41467-023-38333-8 · Cited by 27
Fine-scale sampling uncovers the complexity of migrations in 5th–6th century Pannonia
Vyas, D. N., Koncz, I., Modi, A., Mende, B. G., Tian, Y., Francalacci, P., Lari, M., Vai, S., Straub, P., Gallina, Z., et al. (2023) · Current Biology · doi:10.1016/j.cub.2023.07.063 · Cited by 27
Bein, O., & Davachi, L. (2023) · Journal of Neuroscience · doi:10.1523/jneurosci.0627-23.2023 · Cited by 28
Makhmut, A., Qin, D., Hartlmayr, D., Seth, A., & Coscia, F. (2024) · Molecular & Cellular Proteomics · doi:10.1016/j.mcpro.2024.100750 · Cited by 27
Axon Regeneration: A Subcellular Extension in Multiple DimensionsPreprint
Winter, C. C., He, Z., & Jacobi, A. (2021) · Cold Spring Harbor Perspectives in Biology · doi:10.1101/cshperspect.a040923 · Cited by 26
Structural changes in chromosomes driven by multiple condensin motors during mitosis
Dey, A., Shi, G., Takaki, R., & Thirumalai, D. (2023) · Cell Reports · doi:10.1016/j.celrep.2023.112348 · Cited by 25
Žiaunys, M., Šulskis, D., Veiveris, D., Kopūstas, A., Sniečkutė, R., Mikalauskaitė, K., Sakalauskas, A., Tutkus, M., & Smirnovas, V. (2024) · FEBS Journal · doi:10.1111/febs.17244 · Cited by 24
Durá-Bernal, S., Herrera, B., Lupaşcu, C. A., Marsh, B. M., Gandolfi, D., Marasco, A., Neymotin, S. A., Romani, A., Solinas, S. M. G., Bazhenov, M., et al. (2024) · Journal of Neuroscience · doi:10.1523/jneurosci.1236-24.2024 · Cited by 30
Zhang, Z., Bisceglia, N. G., Li, W., Li, S., Wang, J., Liu, J., Testerink, C. S., & Guo, Y. (2024) · Molecular Plant · doi:10.1016/j.molp.2024.10.010 · Cited by 24
CHOIR improves significance-based detection of cell types and states from single-cell data
Sant, C., Mucke, L., & Corces, M. R. (2025) · Nature Genetics · doi:10.1038/s41588-025-02148-8 · Cited by 24
Lam, S., Hartmann, N., Benfeitas, R., Zhang, C., Arif, M., Türkez, H., Uhlén, M., Englert, C., Knight, R., & Mardinoğlu, A. (2021) · Biomedicines · doi:10.3390/biomedicines9101310 · Cited by 23
Nasopharyngeal Microbiota as an early severity biomarker in COVID-19 hospitalised patients
Ventero, M. P., Moreno, Ó., Molina-Pardines, C., Paytuví-Gallart, A., Boix, V., Escribano, I., Rodríguez-Galán, I., González-de-la-Aleja, P., López‐Pérez, M., Sánchez‐Martínez, R., et al. (2021) · Journal of Infection · doi:10.1016/j.jinf.2021.12.030 · Cited by 24
Taghizadeh, S., Chao, C., Günther, S., Glaser, L., Gersmann, L., Michel, G., Kraut, S., Goth, K., Koepke, J., Heiner, M., et al. (2022) · Stem Cells · doi:10.1093/stmcls/sxac025 · Cited by 24
Metadata
- Authors
- Christensen, A. C., Lensjø, K. K., Lepperød, M. E., Dragly, S.-A., Sutterud, H., Blackstad, J. S., Fyhn, M., & Hafting, T.
- Affiliations
- University of Oslo (NO)
- Corresponding author
- Hafting, Torkel
- ORCID
- Venue
- Nature Communications
- Published
- 2021-01-11
- Volume
- 12
- Issue
- 1
- Pages
- 253-253
- ISSN
- 2041-1723 (ISSN-L)
- PMC
- PMC7801665
- OpenAlex
- W3120392574
- Cited by
- 1,865
- References
- 76
- Citations by year
- 2026: 132 · 2025: 277 · 2024: 340 · 2023: 431 · 2022: 499 · 2021: 170
- FWCI
- 189.42
- Type
- journal article
- Language
- en
- Open access
- gold
- doi.org
- Locations
- Nature Communications (publishedVersion, cc-by)
- bioRxiv (Cold Spring Harbor Laboratory) (acceptedVersion, cc-by-nc-nd)
- Europe PMC (PubMed Central) (publishedVersion, other-oa)
- PubMed Central (publishedVersion, cc-by)
- PubMed (publishedVersion)
- RePEc: Research Papers in Economics (submittedVersion)
- DOAJ (DOAJ: Directory of Open Access Journals) (submittedVersion, cc-by-sa)
- NORA - Norwegian Open Research Archives (submittedVersion, cc-by)
- Funders
- Norges Forskningsråd (217920, 231248)
- Topics
- Life Sciences › Neuroscience › Cognitive Neuroscience › Memory and Neural Mechanisms
- Social Sciences › Psychology › Experimental and Cognitive Psychology › Spatial Cognition and Navigation
- Life Sciences › Neuroscience › Cellular and Molecular Neuroscience › Neuroscience and Neuropharmacology Research
- Keywords
- perineuronal nets, grid cells, extracellular matrix, inhibitory interneurons, spatial memory, navigation, entorhinal cortex, hippocampus, synaptic stability
- MeSH terms
- Grid Cells, Action Potentials, Animals, Computer Simulation, Hippocampus, Male, Models, Neurological, Neurons, Theta Rhythm, Time Factors, Entorhinal Cortex, Rats, Long-Evans, Rats
About these checks
Registry, retraction, Cites and statistics results are computed, not judged, with one exception: a printed reference that no index lists is read once by a model before it counts as a citation error. Claims are extracted by a model and kept only when their quote appears verbatim in the text; each cited source is then checked, with a model’s help, for whether it says what the claim relies on. Those verdicts can be wrong — read the claim’s quote and the cited source before relying on one.
Statistics and arithmetic are recomputed, not judged.
Confidence bands are shown only for fields calibrated on our annotated test set. None is calibrated yet, so no band is shown.
What counts as a claim ›How we measure confidence ›How we check this ›
Are you an author, or do you see a problem with this page? Request a review
