Cited by 117Bone Metabolism and DiseasesTelomeres, Telomerase, and SenescenceAngiogenesis and VEGF in Cancer

The DOI matches its Crossref record; 121 of the 124 references it cites were found in a registry or an index.

Osteoclasts protect bone blood vessels against senescence through the angiogenin/plexin-B2 axis

Open access

Abstract

Synthetic glucocorticoids (GCs), one of the most effective treatments for chronic inflammatory and autoimmune conditions in children, have adverse effects on the growing skeleton. GCs inhibit angiogenesis in growing bone, but the underlying mechanisms remain unclear. Here, we show that GC treatment in young mice induces vascular endothelial cell senescence in metaphysis of long bone, and that inhibition of endothelial cell senescence improves GC-impaired bone angiogenesis with coupled osteogenesis. We identify angiogenin (ANG), a ribonuclease with pro-angiogenic activity, secreted by osteoclasts as a key factor for protecting the neighboring vascular cells against senescence. ANG maintains the proliferative activity of endothelial cells through plexin-B2 (PLXNB2)-mediated transcription of ribosomal RNA (rRNA). GC treatment inhibits ANG production by suppressing osteoclast formation in metaphysis, resulting in impaired endothelial cell rRNA transcription and subsequent cellular senescence. These findings reveal the role of metaphyseal blood vessel senescence in mediating the action of GCs on growing skeleton and establish the ANG/PLXNB2 axis as a molecular basis for the osteoclast-vascular interplay in skeletal angiogenesis.

Overview

The claims and statistics of this paper haven’t been checked yet.

Run the check — free, no account needed. It reads the open-access text and checks the sources it cites.

A few free checks a day · papers already verified open instantly · results are public

Integrity signals

Registry

Crossref · 10.1038/s41467-021-22131-1

Cites

121 of 121 references verified0 citation errors · 0 not checkable

Statistics

Figures

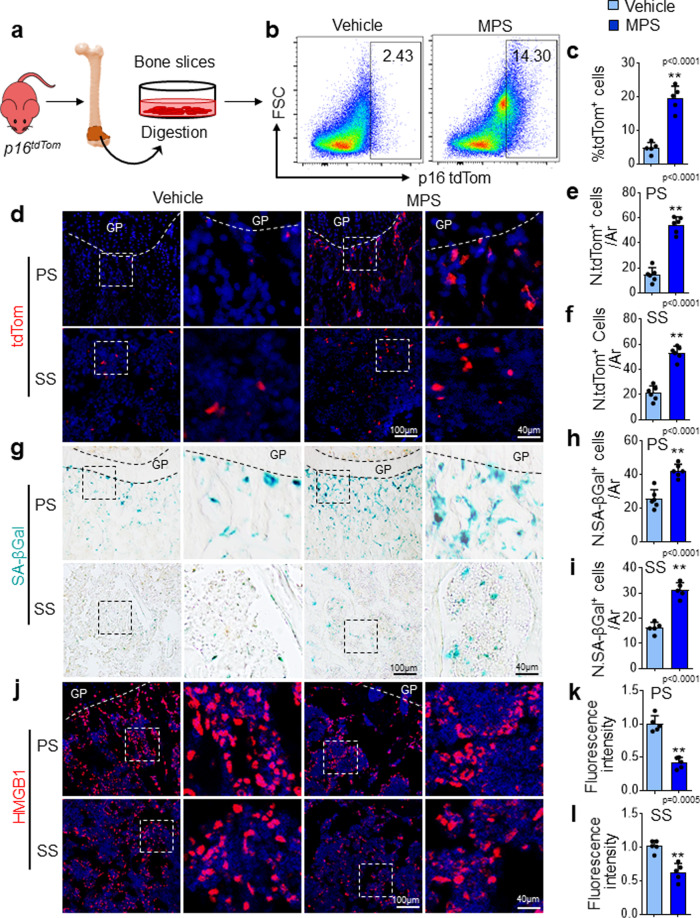
Fig. 1 Senescent cells accumulate in metaphysis of long bone in young mice after GC treatment. a–c Flow cytometry analysis of the tdTom+ cells in femoral metaphysis. a Schematic diagram illustrating the experimental procedure. Three-week-old p16tdTom mice were treated with methylprednisolone (MPS) at 10 mg/m2/day or vehicle by daily intraperitoneal injection for 2 weeks. Metaphyseal bone tissue from distal femur was digested, and the isolated cells were subjected to flow cytometry analysis (see the detailed description in the “Methods” section). Representative images of tdTom-expressing cells of the femoral metaphysis is shown in (b). Percentages of tdTom+ cells in bone/bone marrow are shown in (c). d–f Three-week-old p16tdTom mice were treated with MPS at 10 mg/m2/day or vehicle by daily intraperitoneal injection for 2 weeks. Representative confocal images from frozen sections of the femur in (d). Red: tdTom+ cells; Blue: nuclear staining by DAPI. Boxed areas are shown at a higher magnification in corresponding panels to the right. Quantified numbers of tdTom+ cells in primary spongiosa and secondary spongiosa per mm2 tissue area (N. tdTom+ cells/ Ar) are shown in (e) and (f), respectively. g–l Three-week-old BALB/c mice were treated with MPS at 10 mg/m2/day or vehicle by daily intraperitoneal injection for 3 weeks. SA-βGal staining of femoral bone sections was performed. Representative images of SA-βGal+ cells (blue) in metaphysis are shown in (g). Quantified numbers of SA-βGal+ cells in primary spongiosa and secondary spongiosa per mm2 tissue area (N. SA-βGal+ cells/Ar) are shown in (h) and (i), respectively. Immunofluorescence staining of femoral bone sections was performed using antibody against HMGB1. Representative images of HMGB1+ cells (red) are shown in (j). DAPI stains nuclei blue. Quantified fluorescence intensity of HMGB1+ cells in primary spongiosa and secondary spongiosa was shown in (k) and (l), respectively. GP growth plate. Ar tissue area. PS primary spongiosa, SS secondary spongiosa. n = 5–6 mice. Data are represented as mean ± s.e.m. **p < 0.01, as determined by two-tailed Student’s t-tests.
Fig. 1 Senescent cells accumulate in metaphysis of long bone in young mice after GC treatment. a–c Flow cytometry analysis of the tdTom+ cells in femoral metaphysis. a Schematic diagram illustrating the experimental procedure. Three-week-old p16tdTom mice were treated with methylprednisolone (MPS) at 10 mg/m2/day or vehicle by daily intraperitoneal injection for 2 weeks. Metaphyseal bone tissue from distal femur was digested, and the isolated cells were subjected to flow cytometry analysis (see the detailed description in the “Methods” section). Representative images of tdTom-expressing cells of the femoral metaphysis is shown in (b). Percentages of tdTom+ cells in bone/bone marrow are shown in (c). d–f Three-week-old p16tdTom mice were treated with MPS at 10 mg/m2/day or vehicle by daily intraperitoneal injection for 2 weeks. Representative confocal images from frozen sections of the femur in (d). Red: tdTom+ cells; Blue: nuclear staining by DAPI. Boxed areas are shown at a higher magnification in corresponding panels to the right. Quantified numbers of tdTom+ cells in primary spongiosa and secondary spongiosa per mm2 tissue area (N. tdTom+ cells/ Ar) are shown in (e) and (f), respectively. g–l Three-week-old BALB/c mice were treated with MPS at 10 mg/m2/day or vehicle by daily intraperitoneal injection for 3 weeks. SA-βGal staining of femoral bone sections was performed. Representative images of SA-βGal+ cells (blue) in metaphysis are shown in (g). Quantified numbers of SA-βGal+ cells in primary spongiosa and secondary spongiosa per mm2 tissue area (N. SA-βGal+ cells/Ar) are shown in (h) and (i), respectively. Immunofluorescence staining of femoral bone sections was performed using antibody against HMGB1. Representative images of HMGB1+ cells (red) are shown in (j). DAPI stains nuclei blue. Quantified fluorescence intensity of HMGB1+ cells in primary spongiosa and secondary spongiosa was shown in (k) and (l), respectively. GP growth plate. Ar tissue area. PS primary spongiosa, SS secondary spongiosa. n = 5–6 mice. Data are represented as mean ± s.e.m. **p < 0.01, as determined by two-tailed Student’s t-tests.CC BY · PubMed Central
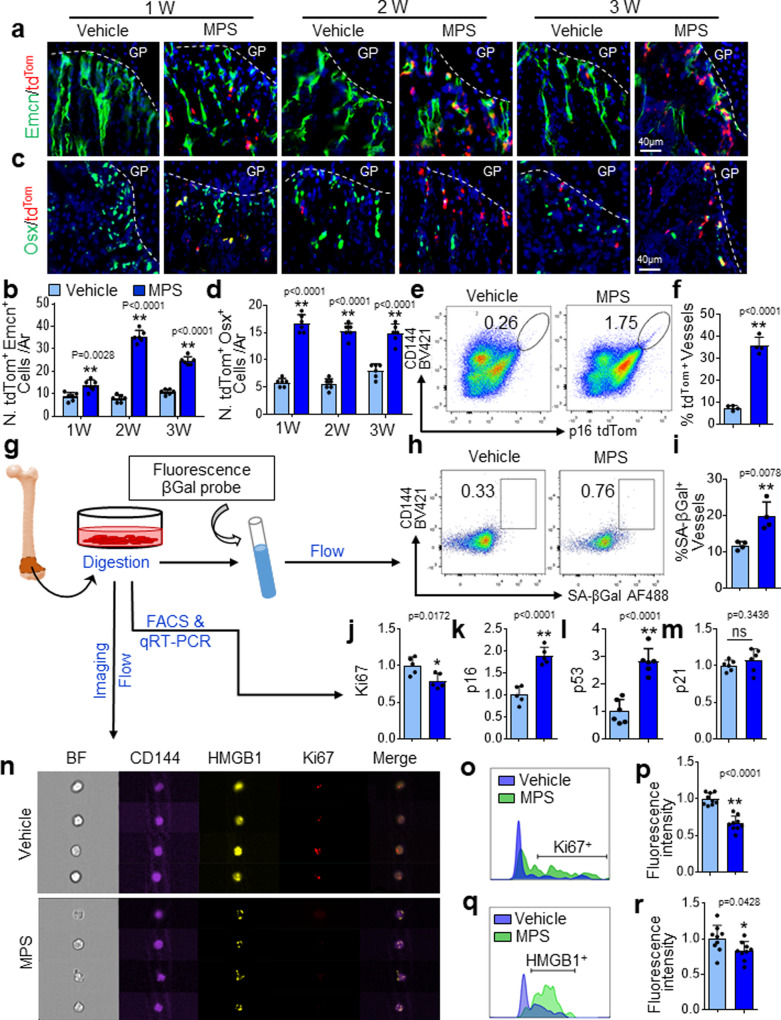
Fig. 2 Metaphyseal vascular cells and osteoprogenitors undergo senescence in response to GC treatment. a–d Three-week-old p16tdTom mice were treated with MPS at 10 mg/m2/day or vehicle by daily intraperitoneal injection for 1–3 weeks. Immunofluorescence staining of femoral bone sections was performed using antibody against Endomucin (Emcn) and Osterix (Osx), respectively. Representative confocal images were shown in (a) and (c). Red: tdTom+ cells; Green: Emcn+ or Osx+ cells; Blue: nuclear staining by DAPI. Quantified numbers of Emcn and tdTom double-positive cells (N. tdTom+Emcn+ cells/Ar) and Osx and tdTomdouble-positive cells (N. tdTom+Osx+ cells/Ar) in primary spongiosa are shown in (b) and (d), respectively. e and f Three-week-old p16tdTom mice were treated with MPS or vehicle for 2 weeks. Bone cells were isolated from femoral metaphysis for flow cytometry analysis. Representative images are shown in (e). Percentages of tdTom-expressing cells in total CD144+ vascular cell population are shown in (f). g–i Three-week-old BALB/c mice were treated with MPS at 10 mg/m2/day or vehicle by daily intraperitoneal injection for 3 weeks. Schematic diagram showing the experimental procedure (g). Cells were isolated from femoral metaphyseal region, and the cell suspension was incubated with a fluorescence βGal probe and subjected to flow cytometry analysis. Representative images of the flow cytometry analysis are shown in (h). Percentage of SA-βGal-expressing CD144+ vascular endothelial cells is shown in (i). j–m The cell suspension prepared as described in (g) were subjected to FACS sorting followed by qRT-PCR analysis. mRNA levels of ki67 (j), p16 (k), p53 (l), and p21(m) are shown. n–r The cell suspension prepared as described in (g) were subjected to single-cell imaging flow analysis using ImageStreamX (see the detailed description in the “Methods” section). Representative images of the cells are shown in (n). Representative histogram presents max pixel intensity of Ki67 and HMGB1, respectively (o and q). Quantification of the fluorescence intensity of Ki67 and HMGB1 signals in CD144+ cells were shown in (p) and (r), respectively. GP growth plate. Ar tissue area. BF bright field. n = 4-6 mice. Data are represented as mean ± s.e.m. *p < 0.05, **p < 0.01, ns not significant, as determined by two-tailed Student’s t-tests.
Fig. 2 Metaphyseal vascular cells and osteoprogenitors undergo senescence in response to GC treatment. a–d Three-week-old p16tdTom mice were treated with MPS at 10 mg/m2/day or vehicle by daily intraperitoneal injection for 1–3 weeks. Immunofluorescence staining of femoral bone sections was performed using antibody against Endomucin (Emcn) and Osterix (Osx), respectively. Representative confocal images were shown in (a) and (c). Red: tdTom+ cells; Green: Emcn+ or Osx+ cells; Blue: nuclear staining by DAPI. Quantified numbers of Emcn and tdTom double-positive cells (N. tdTom+Emcn+ cells/Ar) and Osx and tdTomdouble-positive cells (N. tdTom+Osx+ cells/Ar) in primary spongiosa are shown in (b) and (d), respectively. e and f Three-week-old p16tdTom mice were treated with MPS or vehicle for 2 weeks. Bone cells were isolated from femoral metaphysis for flow cytometry analysis. Representative images are shown in (e). Percentages of tdTom-expressing cells in total CD144+ vascular cell population are shown in (f). g–i Three-week-old BALB/c mice were treated with MPS at 10 mg/m2/day or vehicle by daily intraperitoneal injection for 3 weeks. Schematic diagram showing the experimental procedure (g). Cells were isolated from femoral metaphyseal region, and the cell suspension was incubated with a fluorescence βGal probe and subjected to flow cytometry analysis. Representative images of the flow cytometry analysis are shown in (h). Percentage of SA-βGal-expressing CD144+ vascular endothelial cells is shown in (i). j–m The cell suspension prepared as described in (g) were subjected to FACS sorting followed by qRT-PCR analysis. mRNA levels of ki67 (j), p16 (k), p53 (l), and p21(m) are shown. n–r The cell suspension prepared as described in (g) were subjected to single-cell imaging flow analysis using ImageStreamX (see the detailed description in the “Methods” section). Representative images of the cells are shown in (n). Representative histogram presents max pixel intensity of Ki67 and HMGB1, respectively (o and q). Quantification of the fluorescence intensity of Ki67 and HMGB1 signals in CD144+ cells were shown in (p) and (r), respectively. GP growth plate. Ar tissue area. BF bright field. n = 4-6 mice. Data are represented as mean ± s.e.m. *p < 0.05, **p < 0.01, ns not significant, as determined by two-tailed Student’s t-tests.CC BY · PubMed Central
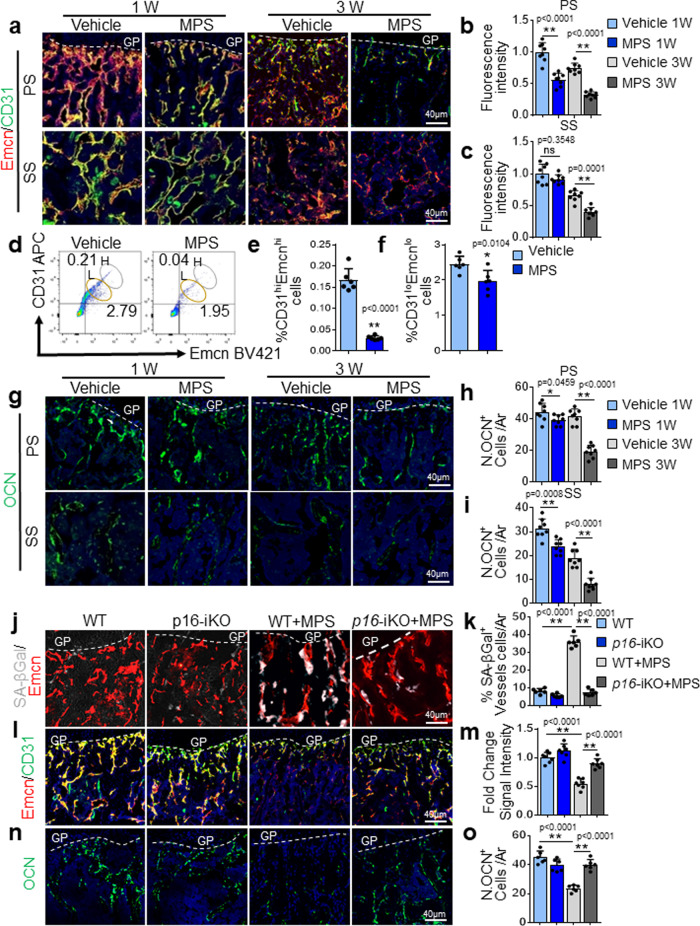
Fig. 3 Antagonizing endothelial cell senescence improves GC-impaired bone angiogenesis and osteogenesis. a–i Three-week-old BALB/c mice were treated with MPS at 10 mg/m2/day or vehicle by daily intraperitoneal injection for 1 or 3 weeks. Double-immunofluorescence staining of femur metaphysis sections was performed using antibodies against Emcn (red) and CD31 (green) in (a). DAPI stains nuclei blue. Relative yellow fluorescence intensity (vessels expressing both Emcn and CD31) in primary spongiosa (b) and secondary spongiosa (c) was measured. Cells isolated from femoral metaphysis of MPS-treated or vehicle-treated mice were subjected to flow cytometry analysis. Representative images are shown in (d). Black circle: type-H vessels; Brown circle: type-L vascular cells. The percentages of the CD31hiEmcnhi cells and CD31loEmcnlo cells are shown in (e) and (f), respectively. Immunofluorescence staining of femoral metaphysis sections was performed using antibody against Osteocalcin (OCN, green) in (g). DAPI stains nuclei blue. Quantified numbers of OCN+ cells per mm2 tissue area (N. OCN+ cells/Ar) in primary spongiosa and secondary spongiosa are shown in (h) and (i), respectively. j–o Three-week-old Cdh5-CreERT2;p16flox/flox (p16-iKO) mice and p16flox/flox (WT) mice were injected with tamoxifen (100 mg/kg B.W, 3 doses on the 1st week, 2 doses on the 2nd week, and 1 dose on the 3rd week). At the same date when the 1st dose tamoxifen injection started, mice were also started to receive daily MPS treatment at 10 mg/m2/day or vehicle for 3 weeks. The mice were humanely killed at 6 weeks of age. Representative images of SA-βGal staining (white) and immunostaining of Emcn (red) in primary spongiosa of femoral bone in (j). Percentages of SA-βGal-expressing vessels in primary spongiosa were quantified in (k). Double-immunofluorescence staining of femur metaphysis sections was performed using antibodies against Emcn (red) and CD31 (green) in (l). DAPI stains nuclei blue. Relative yellow fluorescence intensity (vessels expressing both Emcn and CD31) in primary spongiosa was calculated in (m). Immunofluorescence staining of femur metaphysis sections was performed using antibody against OCN (green) in (n). DAPI stains nuclei blue. Quantified numbers of OCN+ cells per mm2 tissue area (N. OCN+ cells/ Ar) in primary spongiosa are shown in (o). GP growth plate, Ar, tissue area. PS primary spongiosa, SS secondary spongiosa. n = 5–7 mice. Data are represented as mean ± s.e.m. *p < 0.05, **p < 0.01, ns not significant, as determined by one-way ANOVA with post hoc Tukey test.
Fig. 3 Antagonizing endothelial cell senescence improves GC-impaired bone angiogenesis and osteogenesis. a–i Three-week-old BALB/c mice were treated with MPS at 10 mg/m2/day or vehicle by daily intraperitoneal injection for 1 or 3 weeks. Double-immunofluorescence staining of femur metaphysis sections was performed using antibodies against Emcn (red) and CD31 (green) in (a). DAPI stains nuclei blue. Relative yellow fluorescence intensity (vessels expressing both Emcn and CD31) in primary spongiosa (b) and secondary spongiosa (c) was measured. Cells isolated from femoral metaphysis of MPS-treated or vehicle-treated mice were subjected to flow cytometry analysis. Representative images are shown in (d). Black circle: type-H vessels; Brown circle: type-L vascular cells. The percentages of the CD31hiEmcnhi cells and CD31loEmcnlo cells are shown in (e) and (f), respectively. Immunofluorescence staining of femoral metaphysis sections was performed using antibody against Osteocalcin (OCN, green) in (g). DAPI stains nuclei blue. Quantified numbers of OCN+ cells per mm2 tissue area (N. OCN+ cells/Ar) in primary spongiosa and secondary spongiosa are shown in (h) and (i), respectively. j–o Three-week-old Cdh5-CreERT2;p16flox/flox (p16-iKO) mice and p16flox/flox (WT) mice were injected with tamoxifen (100 mg/kg B.W, 3 doses on the 1st week, 2 doses on the 2nd week, and 1 dose on the 3rd week). At the same date when the 1st dose tamoxifen injection started, mice were also started to receive daily MPS treatment at 10 mg/m2/day or vehicle for 3 weeks. The mice were humanely killed at 6 weeks of age. Representative images of SA-βGal staining (white) and immunostaining of Emcn (red) in primary spongiosa of femoral bone in (j). Percentages of SA-βGal-expressing vessels in primary spongiosa were quantified in (k). Double-immunofluorescence staining of femur metaphysis sections was performed using antibodies against Emcn (red) and CD31 (green) in (l). DAPI stains nuclei blue. Relative yellow fluorescence intensity (vessels expressing both Emcn and CD31) in primary spongiosa was calculated in (m). Immunofluorescence staining of femur metaphysis sections was performed using antibody against OCN (green) in (n). DAPI stains nuclei blue. Quantified numbers of OCN+ cells per mm2 tissue area (N. OCN+ cells/ Ar) in primary spongiosa are shown in (o). GP growth plate, Ar, tissue area. PS primary spongiosa, SS secondary spongiosa. n = 5–7 mice. Data are represented as mean ± s.e.m. *p < 0.05, **p < 0.01, ns not significant, as determined by one-way ANOVA with post hoc Tukey test.CC BY · PubMed Central
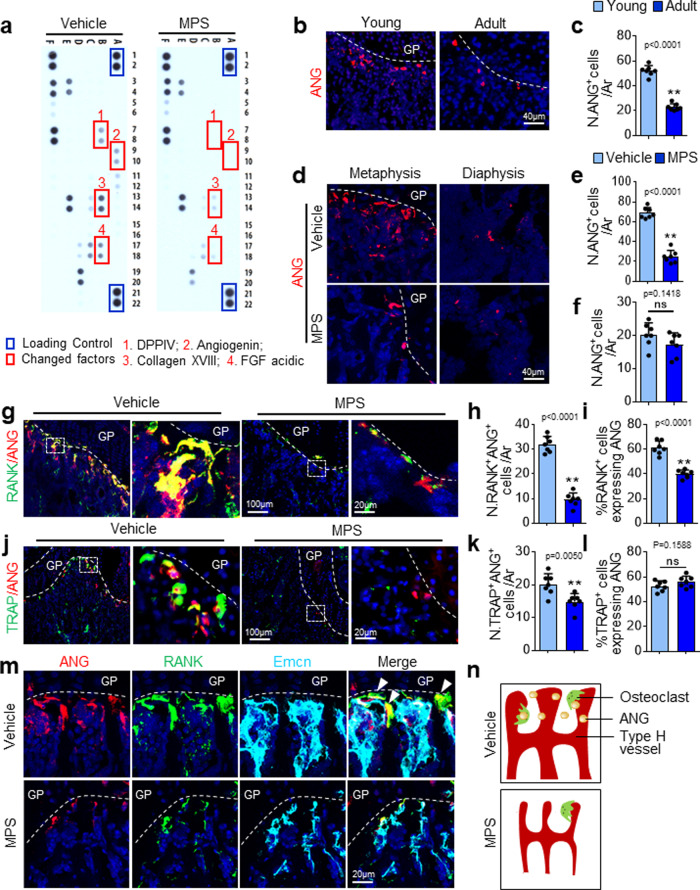
Fig. 4 GC treatment induces a reduction in ANG expression in vascular-associated osteoclasts. a Three-week-old BALB/c mice were treated with MPS at 10 mg/m2/day or vehicle by daily intraperitoneal injection for 2 weeks. Bone tissue extracts of femoral metaphysis were prepared. Relative levels of 53 mouse angiogenesis-related proteins in the tissue extracts were simultaneously assessed using the Proteome Profiler Mouse Angiogenesis Array Kit. The factors differentially expressed were marked with red squares. b and c Immunofluorescence staining of femoral metaphysis sections of four-week-old (Young) and four-month-old (Adult) C57BL/6J mice were performed using antibody against ANG. Representative images are shown in (b). Red: ANG; Blue: DAPI. Quantified numbers of ANG+ cells in primary spongiosa per mm2 tissue area (N. ANG+ cells/Ar) are shown in (c). d–k Three-week-old C57BL/6J mice were treated with MPS at 10 mg/m2/day or vehicle by daily intraperitoneal injection for 2 weeks. Immunofluorescence staining of femur metaphysis sections were performed using antibodies against ANG. Representative images are shown in (d). Red: ANG; Blue: DAPI. Quantified numbers of ANG+ cells in primary spongiosa and diaphyseal bone marrow per mm2 tissue area (N. ANG+ cells/Ar) are shown in (e) and (f), respectively. Double immunofluorescence staining of femoral metaphysis sections was performed using antibodies against ANG and RANK or ANG and TRAP. Representative images are shown in (g) and (j), respectively. Red: ANG; Green: RANK or TRAP; Blue: DAPI. Boxed areas are shown at a higher magnification in corresponding panels to the right. Quantified numbers of RANK-double and ANG-double positive cells (N. RANK+ANG+ cells/Ar) and TRAP- and ANG-double positive cells (N. TRAP+ANG+ cells/Ar) are shown in (h) and (k), respectively. Percentages of ANG-expressing cells in the RANK+ and TRAP+ cell populations (%RANK+ cells expressing ANG and %TRAP+ cells expressing ANG) are shown in (i) and (l), respectively. m Four-color immunofluorescence staining of femur metaphysis sections was performed using antibodies against ANG (red), RANK (green), and Emcn (cyan). DAPI stains nuclei. Note: cells in yellow (ANG-expressing osteoclasts) are closely associated with the cells in cyan (Emcn+ vascular endothelial cells). Arrows indicate RANK+ANG+ double-positive cells reside closely to Emcn+ vascular endothelial cells. n Schematic diagram showing ANG-expressing osteoclasts that reside closely to type-H vessels in primary spongiosa in the absence or presence of MPS treatment. GP growth plate. n = 4–8 mice. Data are represented as mean ± s.e.m. **p < 0.01, ns not significant as determined by two-tailed Student’s t-tests.
Fig. 4 GC treatment induces a reduction in ANG expression in vascular-associated osteoclasts. a Three-week-old BALB/c mice were treated with MPS at 10 mg/m2/day or vehicle by daily intraperitoneal injection for 2 weeks. Bone tissue extracts of femoral metaphysis were prepared. Relative levels of 53 mouse angiogenesis-related proteins in the tissue extracts were simultaneously assessed using the Proteome Profiler Mouse Angiogenesis Array Kit. The factors differentially expressed were marked with red squares. b and c Immunofluorescence staining of femoral metaphysis sections of four-week-old (Young) and four-month-old (Adult) C57BL/6J mice were performed using antibody against ANG. Representative images are shown in (b). Red: ANG; Blue: DAPI. Quantified numbers of ANG+ cells in primary spongiosa per mm2 tissue area (N. ANG+ cells/Ar) are shown in (c). d–k Three-week-old C57BL/6J mice were treated with MPS at 10 mg/m2/day or vehicle by daily intraperitoneal injection for 2 weeks. Immunofluorescence staining of femur metaphysis sections were performed using antibodies against ANG. Representative images are shown in (d). Red: ANG; Blue: DAPI. Quantified numbers of ANG+ cells in primary spongiosa and diaphyseal bone marrow per mm2 tissue area (N. ANG+ cells/Ar) are shown in (e) and (f), respectively. Double immunofluorescence staining of femoral metaphysis sections was performed using antibodies against ANG and RANK or ANG and TRAP. Representative images are shown in (g) and (j), respectively. Red: ANG; Green: RANK or TRAP; Blue: DAPI. Boxed areas are shown at a higher magnification in corresponding panels to the right. Quantified numbers of RANK-double and ANG-double positive cells (N. RANK+ANG+ cells/Ar) and TRAP- and ANG-double positive cells (N. TRAP+ANG+ cells/Ar) are shown in (h) and (k), respectively. Percentages of ANG-expressing cells in the RANK+ and TRAP+ cell populations (%RANK+ cells expressing ANG and %TRAP+ cells expressing ANG) are shown in (i) and (l), respectively. m Four-color immunofluorescence staining of femur metaphysis sections was performed using antibodies against ANG (red), RANK (green), and Emcn (cyan). DAPI stains nuclei. Note: cells in yellow (ANG-expressing osteoclasts) are closely associated with the cells in cyan (Emcn+ vascular endothelial cells). Arrows indicate RANK+ANG+ double-positive cells reside closely to Emcn+ vascular endothelial cells. n Schematic diagram showing ANG-expressing osteoclasts that reside closely to type-H vessels in primary spongiosa in the absence or presence of MPS treatment. GP growth plate. n = 4–8 mice. Data are represented as mean ± s.e.m. **p < 0.01, ns not significant as determined by two-tailed Student’s t-tests.CC BY · PubMed Central
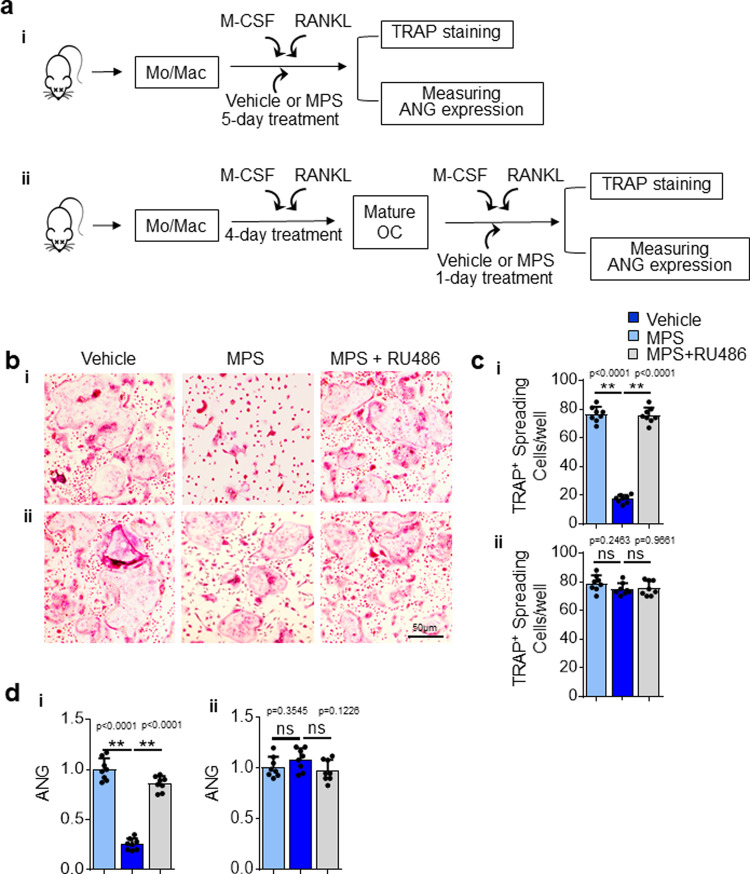
Fig. 5 GC Treatment suppresses osteoclast formation but does not directly regulate ANG gene expression in osteoclasts. a Schematic diagram showing the procedure of the in vitro experiments. Bone marrow mononuclear cells/macrophages were isolated from 3-week-old C57BL/6J mice and cultured with M-CSF and RANKL for 5 days to induce the formation of mature osteoclasts. The cells were treated with vehicle or MPS with or without RU486 for the entire 5 days (i) or only the last day (ii). The cells were subjected to TRAP staining or lysed to measure the mRNA expression level of ANG. TRAP staining of the cells is shown in (b). Quantified number of TRAP+ spreading multinucleated cells/well is shown in (c). The levels of ANG expression were analyzed by qRT-PCR (d). Experiments were performed in triplicate and were repeated three times. Data are represented as mean ± s.e.m. **p < 0.01, ns, not significant as determined by one-way ANOVA with post hoc Tukey test.
Fig. 5 GC Treatment suppresses osteoclast formation but does not directly regulate ANG gene expression in osteoclasts. a Schematic diagram showing the procedure of the in vitro experiments. Bone marrow mononuclear cells/macrophages were isolated from 3-week-old C57BL/6J mice and cultured with M-CSF and RANKL for 5 days to induce the formation of mature osteoclasts. The cells were treated with vehicle or MPS with or without RU486 for the entire 5 days (i) or only the last day (ii). The cells were subjected to TRAP staining or lysed to measure the mRNA expression level of ANG. TRAP staining of the cells is shown in (b). Quantified number of TRAP+ spreading multinucleated cells/well is shown in (c). The levels of ANG expression were analyzed by qRT-PCR (d). Experiments were performed in triplicate and were repeated three times. Data are represented as mean ± s.e.m. **p < 0.01, ns, not significant as determined by one-way ANOVA with post hoc Tukey test.CC BY · PubMed Central
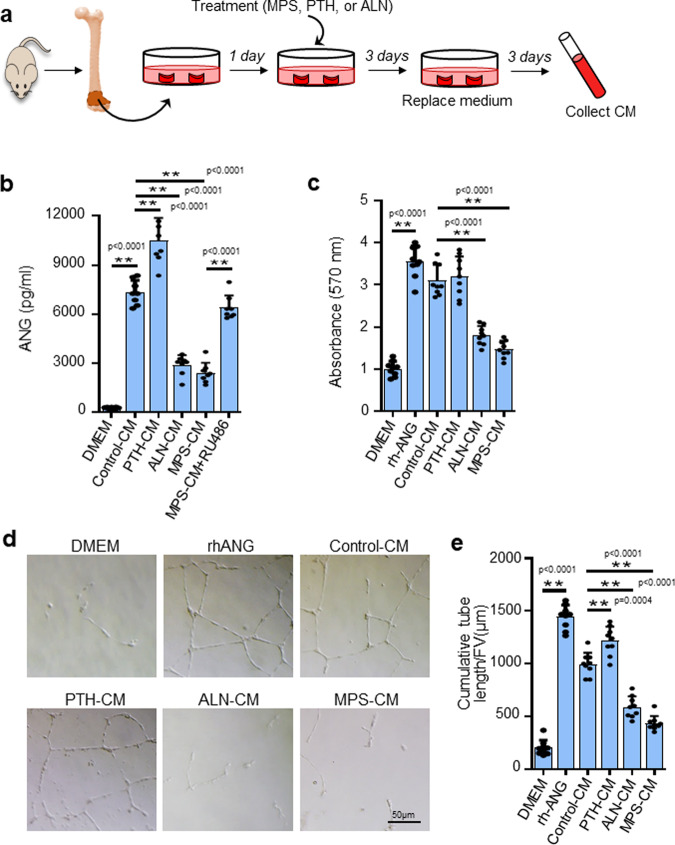
Fig. 6 ANG secreted from metaphyseal osteoclasts mediates osteoclast-vascular crosstalk. a Schematic diagram showing the procedure of the ex vivo experiments. Metaphyseal bone of distal femur was isolated from 3-week-old C57BL/6J mice and cultured in serum-free DMEM for 1 day to adjust to the ex vivo environment. The explant was then cultured for 3 days with different treatments. Fresh medium was replaced after washing away the medium. Conditioned medium (CM) was collected after another 3-day culture. b The concentrations of ANG in the CMs were measured by ELISA. c Different CMs were individually added in the HUVEC culture, and the proliferation of the cells was measured by MTT assay. d and e Different CMs were individually added in the HUVEC culture planted on Matrigel. Tube formation assay images are shown in (d). Quantitative analysis of cumulative tubule length is shown in (e). PTH parathyroid hormone, ALN alendronate. Experiments were performed in triplicate and were repeated three times. Data are represented as mean ± s.e.m. **p < 0.01 as determined by one-way ANOVA with post hoc Tukey test.
Fig. 6 ANG secreted from metaphyseal osteoclasts mediates osteoclast-vascular crosstalk. a Schematic diagram showing the procedure of the ex vivo experiments. Metaphyseal bone of distal femur was isolated from 3-week-old C57BL/6J mice and cultured in serum-free DMEM for 1 day to adjust to the ex vivo environment. The explant was then cultured for 3 days with different treatments. Fresh medium was replaced after washing away the medium. Conditioned medium (CM) was collected after another 3-day culture. b The concentrations of ANG in the CMs were measured by ELISA. c Different CMs were individually added in the HUVEC culture, and the proliferation of the cells was measured by MTT assay. d and e Different CMs were individually added in the HUVEC culture planted on Matrigel. Tube formation assay images are shown in (d). Quantitative analysis of cumulative tubule length is shown in (e). PTH parathyroid hormone, ALN alendronate. Experiments were performed in triplicate and were repeated three times. Data are represented as mean ± s.e.m. **p < 0.01 as determined by one-way ANOVA with post hoc Tukey test.CC BY · PubMed Central
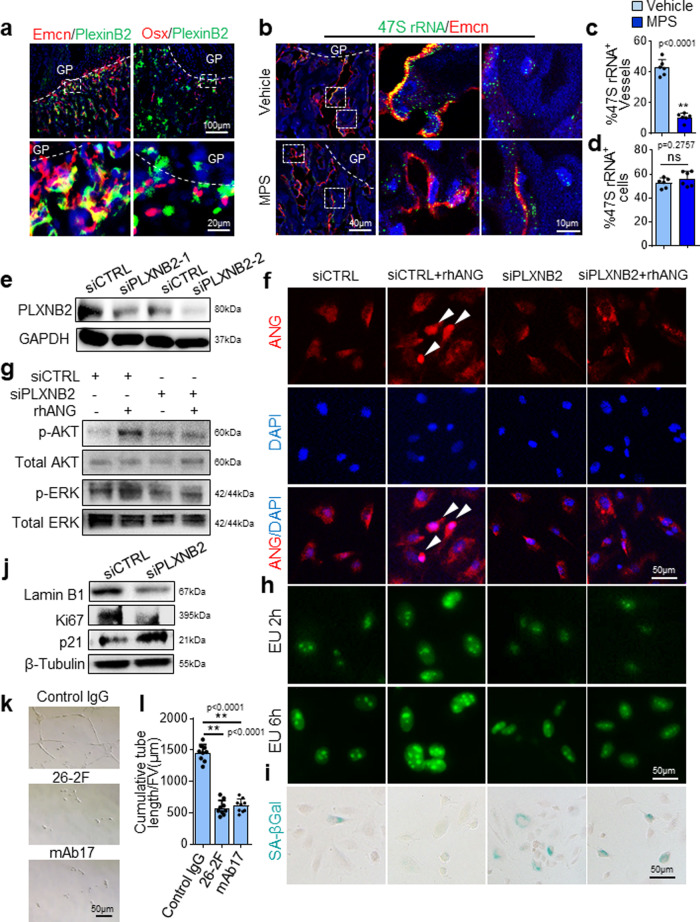
Fig. 7 The ANG/PLXNB2 axis is essential to maintain the proliferative activity of vascular endothelial cells and protect them from senescence. a–d Three-week-old C57BL/6J mice were treated with MPS at 10 mg/m2/day or vehicle by daily intraperitoneal injection for 2 weeks. Double immunofluorescence staining of femoral sections using antibodies against PLXNB2 (green) and Emcn (red) or Osx (red) (a). Simultaneous fluorescence immunostaining of Emcn (red) and FISH analysis of 47S rRNA transcription (green) in bone tissue sections were shown in (b). DAPI stains nuclei blue. Boxed areas are shown at a higher magnification in corresponding panels to the right. Quantitative analysis of percentage of Emcn+ blood vessels in (c) and non-blood vessel cells (d) that show positive signal of 47S rRNA transcription in primary spongiosa. Blood vessels with more than 20 green dots are considered as positive. Non-blood vessel cell with more than five green dots in nucleus are considered positive. e Immunoblot of PLXNB2 in HUVECs transfected with two individual PLXNB2 siRNAs (siPLXNB2-1, -2) or scrambled control siRNA (siCTRL). f–i HUVECs were transfected with siCTRL or siPLXNB2 for 36 h and then stimulated with 200 ng/mL rhANG or vehicle for another 12 h. Cells were fixed and immunofluorescence staining was performed using antibody against ANG (red) in (f). Arrow heads indicate nuclear translocation of ANG. DAPI stains nuclei blue. Immunoblot was performed using antibodies against p-AKT, AKT, p-ERK, or ERK in (g). Click-iT RNA-imaging assays were performed, and confocal images of the cells pulsed with EU for 2 and 6 h were obtained (green: Alexa 488-EU) in (h). Cells were subjected to SA-βGal staining with representative images in (i). j HUVECs were treated transfected with siCTRL or siPLXNB2 for 48 h. Immunoblot was performed using individual antibodies against LaminB1, Ki67, p21, and GAPDH. k, l HUVEC was seeded on Matrigel with control IgG, 26-2F or mAb17. Images of tubule formation is shown in (k). Quantitative analysis of cumulative tubule length is shown in (l). **p < 0.01 as determined by one-way ANOVA with post hoc Tukey test. GP growth plate. n = 4-6 mice, Data are represented as mean ± s.e.m. **p < 0.01, ns not significant as determined by two-tailed Student’s t-tests.
Fig. 7 The ANG/PLXNB2 axis is essential to maintain the proliferative activity of vascular endothelial cells and protect them from senescence. a–d Three-week-old C57BL/6J mice were treated with MPS at 10 mg/m2/day or vehicle by daily intraperitoneal injection for 2 weeks. Double immunofluorescence staining of femoral sections using antibodies against PLXNB2 (green) and Emcn (red) or Osx (red) (a). Simultaneous fluorescence immunostaining of Emcn (red) and FISH analysis of 47S rRNA transcription (green) in bone tissue sections were shown in (b). DAPI stains nuclei blue. Boxed areas are shown at a higher magnification in corresponding panels to the right. Quantitative analysis of percentage of Emcn+ blood vessels in (c) and non-blood vessel cells (d) that show positive signal of 47S rRNA transcription in primary spongiosa. Blood vessels with more than 20 green dots are considered as positive. Non-blood vessel cell with more than five green dots in nucleus are considered positive. e Immunoblot of PLXNB2 in HUVECs transfected with two individual PLXNB2 siRNAs (siPLXNB2-1, -2) or scrambled control siRNA (siCTRL). f–i HUVECs were transfected with siCTRL or siPLXNB2 for 36 h and then stimulated with 200 ng/mL rhANG or vehicle for another 12 h. Cells were fixed and immunofluorescence staining was performed using antibody against ANG (red) in (f). Arrow heads indicate nuclear translocation of ANG. DAPI stains nuclei blue. Immunoblot was performed using antibodies against p-AKT, AKT, p-ERK, or ERK in (g). Click-iT RNA-imaging assays were performed, and confocal images of the cells pulsed with EU for 2 and 6 h were obtained (green: Alexa 488-EU) in (h). Cells were subjected to SA-βGal staining with representative images in (i). j HUVECs were treated transfected with siCTRL or siPLXNB2 for 48 h. Immunoblot was performed using individual antibodies against LaminB1, Ki67, p21, and GAPDH. k, l HUVEC was seeded on Matrigel with control IgG, 26-2F or mAb17. Images of tubule formation is shown in (k). Quantitative analysis of cumulative tubule length is shown in (l). **p < 0.01 as determined by one-way ANOVA with post hoc Tukey test. GP growth plate. n = 4-6 mice, Data are represented as mean ± s.e.m. **p < 0.01, ns not significant as determined by two-tailed Student’s t-tests.CC BY · PubMed Central
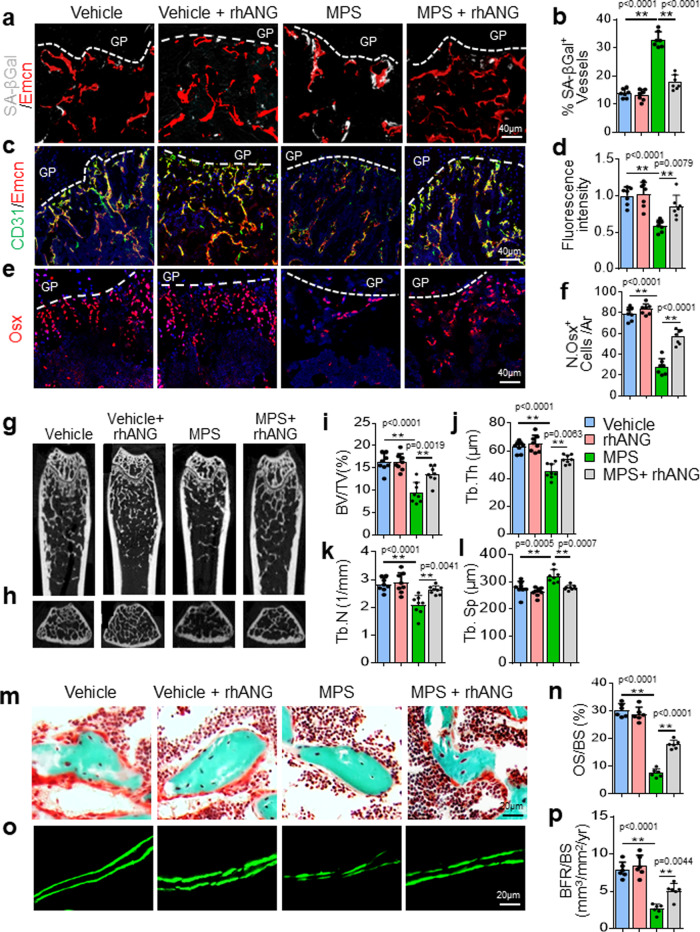
Fig. 8 Recombinant human ANG (rhANG) rescues GC-impaired bone growth and mineral acquisition. Three-week-old BALB/c mice were treated with vehicle, MPS alone at 10 mg/m2/day or MPS plus rhANG (1 µg/day) by daily intraperitoneal injection for 4 weeks. Representative images of SA-βGal staining (white) and immunofluorescence staining of Endomucin (Emcn, red) in primary spongiosa of femoral bone in (a). Percentage of SA-βGal-expressing vessels were quantified in (b). Double immunofluorescence staining of Emcn (red) and CD31 (green) in metaphysis of femoral bone in (c). DAPI-stained nuclei blue. Relative yellow fluorescence intensity in primary spongiosa was measured in (d). Immunofluorescence staining of femoral metaphysis sections were performed using antibody against Osx (red) in (e). DAPI stains nuclei blue. Numbers of Osx+ cells per mm2 tissue area (N. Osx+ cells/Ar) were quantified in (f). Representative μCT images of distal femur in mice were shown in (g, longitudinal sections) and (h, cross sections). Quantitative analyses of trabecular bone volume fraction (BV/TV) (i), trabecular thickness (Tb. Th) (j), trabecular number (Tb. N) (k), and trabecular separation (Tb.Sp) (l). Trichrome staining of the metaphyseal trabecular bone at distal femora in (m). Osteoid stains red and mineralized bone stains green. Osteoid surface per bone surface (OS/BS) was measured in (n). Representative images of calcein double labeling (o) and quantification of bone formation rate per bone surface (BFR/BS) (p) of the metaphyseal trabecular bone at distal femora. GP growth plate. n = 6-10 mice. Data are represented as mean ± s.e.m. **p < 0.01 as determined by one-way ANOVA with post hoc Tukey test.
Fig. 8 Recombinant human ANG (rhANG) rescues GC-impaired bone growth and mineral acquisition. Three-week-old BALB/c mice were treated with vehicle, MPS alone at 10 mg/m2/day or MPS plus rhANG (1 µg/day) by daily intraperitoneal injection for 4 weeks. Representative images of SA-βGal staining (white) and immunofluorescence staining of Endomucin (Emcn, red) in primary spongiosa of femoral bone in (a). Percentage of SA-βGal-expressing vessels were quantified in (b). Double immunofluorescence staining of Emcn (red) and CD31 (green) in metaphysis of femoral bone in (c). DAPI-stained nuclei blue. Relative yellow fluorescence intensity in primary spongiosa was measured in (d). Immunofluorescence staining of femoral metaphysis sections were performed using antibody against Osx (red) in (e). DAPI stains nuclei blue. Numbers of Osx+ cells per mm2 tissue area (N. Osx+ cells/Ar) were quantified in (f). Representative μCT images of distal femur in mice were shown in (g, longitudinal sections) and (h, cross sections). Quantitative analyses of trabecular bone volume fraction (BV/TV) (i), trabecular thickness (Tb. Th) (j), trabecular number (Tb. N) (k), and trabecular separation (Tb.Sp) (l). Trichrome staining of the metaphyseal trabecular bone at distal femora in (m). Osteoid stains red and mineralized bone stains green. Osteoid surface per bone surface (OS/BS) was measured in (n). Representative images of calcein double labeling (o) and quantification of bone formation rate per bone surface (BFR/BS) (p) of the metaphyseal trabecular bone at distal femora. GP growth plate. n = 6-10 mice. Data are represented as mean ± s.e.m. **p < 0.01 as determined by one-way ANOVA with post hoc Tukey test.CC BY · PubMed Central
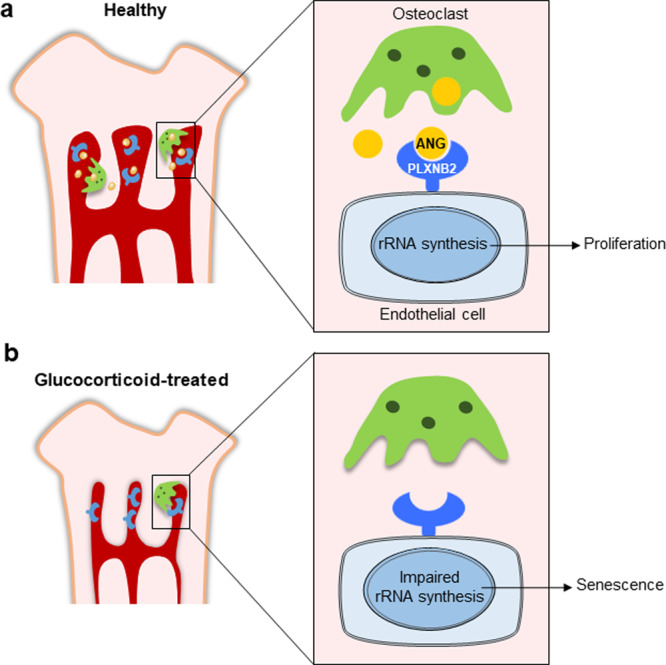
Fig. 9 Schematic model for the ANG/PLXNB2-rRNA transcription signaling in mediating osteoclast-endothelial cell crosstalk in metaphysis of growing bone. a In normal growing mice, ANG secreted from metaphyseal osteoclasts maintains the proliferation of neighboring blood vessel endothelial cells in long bone through ANG/PLXNB2-rRNA transcription signaling. b GC treatment inhibits ANG production through suppression of osteoclast formation in metaphysis, leading to blood vessel cell senescence and impairment of angiogenesis with coupled osteogenesis.
Fig. 9 Schematic model for the ANG/PLXNB2-rRNA transcription signaling in mediating osteoclast-endothelial cell crosstalk in metaphysis of growing bone. a In normal growing mice, ANG secreted from metaphyseal osteoclasts maintains the proliferation of neighboring blood vessel endothelial cells in long bone through ANG/PLXNB2-rRNA transcription signaling. b GC treatment inhibits ANG production through suppression of osteoclast formation in metaphysis, leading to blood vessel cell senescence and impairment of angiogenesis with coupled osteogenesis.CC BY · PubMed Central

Verification

Claims the paper makes

The claims and statistics of this paper haven’t been checked yet.

Run the check — free, no account needed. It reads the open-access text and checks the sources it cites.

A few free checks a day · papers already verified open instantly · results are public

Claims other papers make about this one

Each is checked against this paper’s own text: does it say what the citing paper says it does?

Self-check

Percentages, sums and reported differences re-computed from the paper’s own numbers.

The self-check needs the paper’s full text.

Citations

Cites

Show all 124 references

Research works printed but not linked: 2

  1. Hardy, R. S., Zhou, H., Seibel, M. J. & Cooper, M. S. Glucocorticoids and bone: consequences of endogenous and exogenous excess and replacement therapy. Endocr. Rev. 39, 519–548 (2018). · DOI · Paper page
  2. Liehr, T. Fluorescence In Situ Hybridization (FISH) (Springer, 2017). · DOI

Cited by

Sorted by citations

Items 101–117 of 117

Metadata

Authors
Liu, X., Chai, Y., Liu, G., Su, W., Guo, Q., Lv, X., Gao, P., Yu, B., Ferbeyre, G., Cao, X., & Wan, M.
Affiliations
  • Johns Hopkins University (US)
  • Nanfang Hospital (CN)
  • Université de Montréal (CA)
Corresponding author
Wan, Mei
Venue
Nature Communications
Published
2021-03-23
Volume
12
Issue
1
Pages
1832-1832
ISSN
2041-1723 (ISSN-L)
OpenAlex
W3138375299
Cited by
116
References
124
Citations by year
2026: 15 · 2025: 23 · 2024: 27 · 2023: 29 · 2022: 16 · 2021: 6
FWCI
6.12
Type
journal article
Language
en
Open access
Locations
  • Nature Communications (publishedVersion, cc-by)
  • PubMed Central (publishedVersion, cc-by)
  • PubMed (publishedVersion)
  • RePEc: Research Papers in Economics (submittedVersion)
  • DOAJ (DOAJ: Directory of Open Access Journals) (submittedVersion, cc-by-sa)
Funders
  • Tufts Medical Center
  • Johns Hopkins University
  • National Institutes of Health (1s10od016374-01, 1r56ag059578-01)
  • National Institute on Aging (R56 AG059578, P01AG066603)
Topics
  • Life Sciences › Biochemistry, Genetics and Molecular Biology › Molecular Biology › Bone Metabolism and Diseases
  • Life Sciences › Biochemistry, Genetics and Molecular Biology › Cell Biology › Telomeres, Telomerase, and Senescence
  • Life Sciences › Biochemistry, Genetics and Molecular Biology › Molecular Biology › Angiogenesis and VEGF in Cancer
Keywords
osteoclasts, endothelial cell senescence, angiogenin, Plexin-B2, synthetic glucocorticoids, bone angiogenesis, metaphysis, rDNA transcription, bone formation, growing skeleton, glucocorticoid adverse effects
MeSH terms
Animals, Bone Development, Glucocorticoids, Humans, Immunohistochemistry, Methylprednisolone, Mice, Inbred BALB C, Mice, Inbred C57BL, Neovascularization, Pathologic, Nerve Tissue Proteins, Osteoclasts, Osteogenesis, Recombinant Proteins, Ribonuclease, Pancreatic, RNA, Ribosomal, Signal Transduction, Tomography Scanners, X-Ray Computed, Cellular Senescence, Apoptosis, In Situ Hybridization, Fluorescence, Neovascularization, Physiologic, RNA, Small Interfering, Endothelial Cells, Cell Proliferation, Mice, Human Umbilical Vein Endothelial Cells

About these checks

Registry, retraction, Cites and statistics results are computed, not judged, with one exception: a printed reference that no index lists is read once by a model before it counts as a citation error. Claims are extracted by a model and kept only when their quote appears verbatim in the text; each cited source is then checked, with a model’s help, for whether it says what the claim relies on. Those verdicts can be wrong — read the claim’s quote and the cited source before relying on one.

Statistics and arithmetic are recomputed, not judged.

Confidence bands are shown only for fields calibrated on our annotated test set. None is calibrated yet, so no band is shown.

What counts as a claim ›How we measure confidence ›How we check this ›

Are you an author, or do you see a problem with this page? Request a review