

The DOI matches its Crossref record; 41 of the 41 references it cites were found in a registry or an index.
Self-clocking fast and variation tolerant true random number generator based on a stochastic mott memristor
Open accessPublished version of a preprint
Abstract
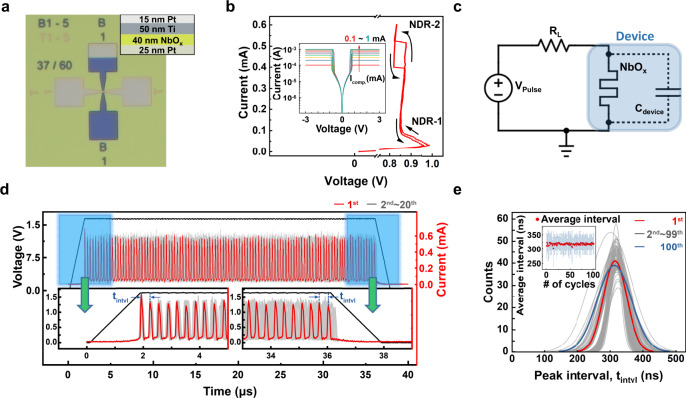
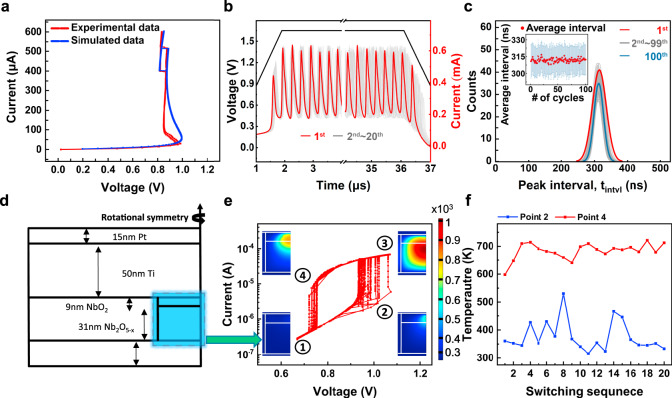
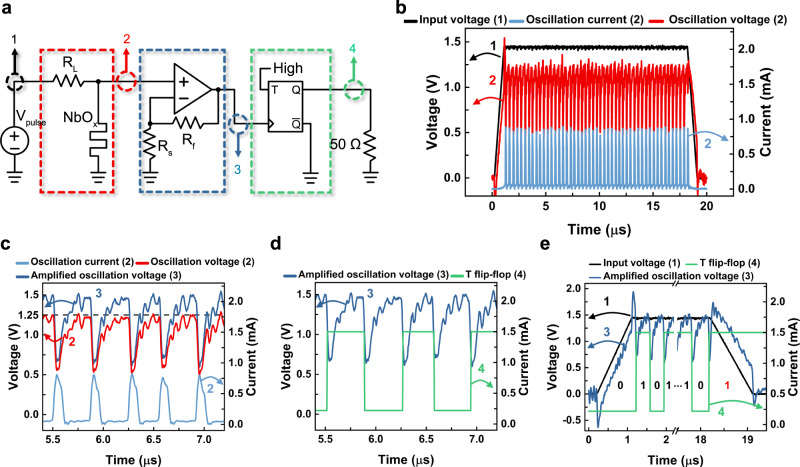
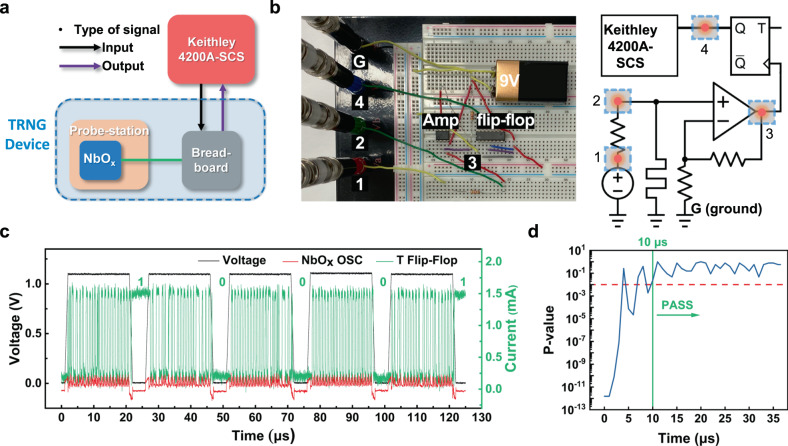
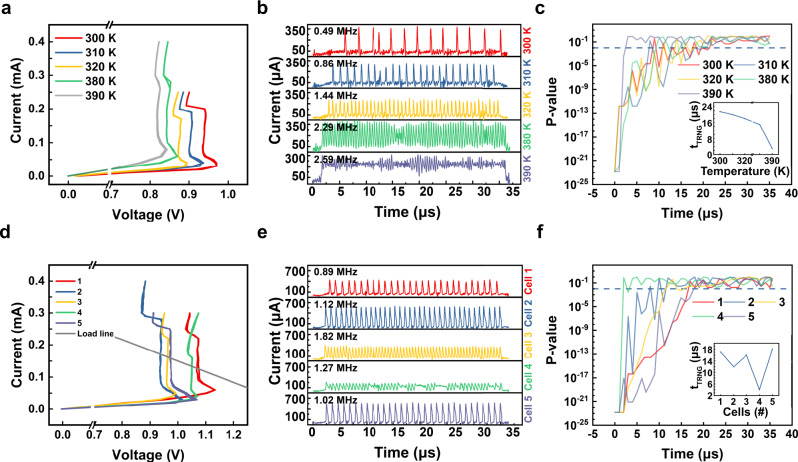
Abstract The intrinsic stochasticity of the memristor can be used to generate true random numbers, essential for non-decryptable hardware-based security devices. Here we propose a novel and advanced method to generate true random numbers utilizing the stochastic oscillation behavior of a NbOx mott memristor, exhibiting self-clocking, fast and variation tolerant characteristics. The random number generation rate of the device can be at least 40 kbs-1, which is the fastest record compared with previous volatile memristor-based TRNG devices. Also, its dimensionless operating principle provides high tolerance against both ambient temperature variation and device-to-device variation, enabling robust security hardware applicable in harsh environments.
Overview
The claims and statistics of this paper haven’t been checked yet.
Run the check — free, no account needed. It reads the open-access text and checks the sources it cites.
Integrity signals
Registry
Cites
Statistics
Figures
Verification
Claims the paper makes
The claims and statistics of this paper haven’t been checked yet.
Run the check — free, no account needed. It reads the open-access text and checks the sources it cites.
Claims other papers make about this one
Each is checked against this paper’s own text: does it say what the citing paper says it does?
The source backs part of the claim, not all of it — or backs it for a different population, condition or comparison.
In the citing paper
“For example, tRNGs such as RRAM or MRAM, which are not Si-based complementary metal-oxide semiconductor (CMOS) devices, are widely studied given their inherent switching stochasticity as an entropy source, which relies on material-induced variations (11–18).”
From Cryptographic transistor for true random number generator with low power consumption (2024) · cites this paper as [18]
Experimental — accuracy not yet measuredThe check wasn’t confident either way, so it gives no verdict — never disputed.
In the citing paper
“Moreover, their lack of compatibility with CMOS fabrication standards makes it difficult to apply them directly to the current CMOS logic platform used for mass production.”
From Cryptographic transistor for true random number generator with low power consumption (2024) · cites this paper as [18]
Experimental — accuracy not yet measuredThe check wasn’t confident either way, so it gives no verdict — never disputed.
In the citing paper
“However, these tRNGs require a few entropy extraction circuits, each of which consumes power at the milliwatt level.”
From Cryptographic transistor for true random number generator with low power consumption (2024) · cites this paper as [18]
Experimental — accuracy not yet measured
Self-check
Percentages, sums and reported differences re-computed from the paper’s own numbers.
The self-check needs the paper’s full text.
Citations
Cites
A scalable neuristor built with Mott memristors
Pickett, M. D., Medeiros‐Ribeiro, G., & Williams, R. S. (2012) · Nature Materials · doi:10.1038/nmat3510 · Cited by 1,046
Chaotic dynamics in nanoscale NbO2 Mott memristors for analogue computing
Kumar, S., Strachan, J. P., & Williams, R. S. (2017) · Nature · doi:10.1038/nature23307 · Cited by 620
A novel true random number generator based on a stochastic diffusive memristor
Jiang, H., Belkin, D., Savel’ev, S. E., Lin, S., Wang, Z., Li, Y., Joshi, S., Midya, R., Li, C., Rao, M., et al. (2017) · Nature Communications · doi:10.1038/s41467-017-00869-x · Cited by 459
2018 IEEE International Electron Devices Meeting (IEDM)
(2018) · doi:10.1109/iedm13552.2018 · Cited by 459
An artificial spiking afferent nerve based on Mott memristors for neurorobotics
Zhang, X., Zhuo, Y., Luo, Q., Wu, Z., Midya, R., Wang, Z., Song, W., Wang, R., Upadhyay, N. K., Fang, Y., et al. (2020) · Nature Communications · doi:10.1038/s41467-019-13827-6 · Cited by 401
Pickett, M. D., & Stanley Williams, R. (2012) · Nanotechnology · doi:10.1088/0957-4484/23/21/215202 · Cited by 385
Third-order nanocircuit elements for neuromorphic engineering
Kumar, S., Williams, R. S., & Wang, Z. (2020) · Nature · doi:10.1038/s41586-020-2735-5 · Cited by 370
Stochastic memristive devices for computing and neuromorphic applications
Gaba, S., Sheridan, P., Zhou, J., Choi, S., & Lu, W. (2013) · Nanoscale · doi:10.1039/c3nr01176c · Cited by 307
2005 IEEE International Electron Devices Meeting
(2005) · Journal of Lightwave Technology · doi:10.1109/jlt.2005.853686 · Cited by 258
Spin dice: A scalable truly random number generator based on spintronics
Fukushima, A., Seki, T., Yakushiji, K., Kubota, H., Imamura, H., Yuasa, S., & Ando, K. (2014) · Applied Physics Express · doi:10.7567/apex.7.083001 · Cited by 238
Research works printed but not linked: 2
- Hashim, N. A. B. N., Teo, J., Hamid, M. S. A. & Hamid, F. A. B. IEEE student conference on research and development (SCOReD). 1–5 (2016)
- Wang, Y., Wen, W., Li, H. & Hu, M. Proceedings of the 25th edition on Great Lakes Symposium on VLSI, 271–276 (2015).
Cited by
Sorted by citations
A review of memristor: material and structure design, device performance, applications and prospects
Xiao, Y., Jiang, B., Zhang, Z., Ke, S., Jin, Y., Wen, X., & Ye, C. (2023) · Science and Technology of Advanced Materials · doi:10.1080/14686996.2022.2162323 · Cited by 318
Artificial Neuronal Devices Based on Emerging Materials: Neuronal Dynamics and Applications
Liu, H., Qin, Y., Chen, H., Wu, J., Ma, J., Du, Z., Wang, N., Zou, J., Lin, S., Zhang, X., et al. (2023) · Advanced Materials · doi:10.1002/adma.202205047 · Cited by 100
Application of Resistive Random Access Memory in Hardware Security: A Review
Rajendran, G., Banerjee, W., Chattopadhyay, A., & Aly, M. M. S. (2021) · Advanced Electronic Materials · doi:10.1002/aelm.202100536 · Cited by 78
Tunable stochastic memristors for energy-efficient encryption and computing
Woo, K. S., Han, J., Yi, S., Thomas, L., Park, H., Kumar, S., & Hwang, C. S. (2024) · Nature Communications · doi:10.1038/s41467-024-47488-x · Cited by 77
A Unified PUF and TRNG Design Based on 40-nm RRAM With High Entropy and Robustness for IoT Security
Gao, B., Lin, B., Li, X., Tang, J., Qian, H., & Wu, H. (2022) · IEEE Transactions on Electron Devices · doi:10.1109/ted.2021.3138365 · Cited by 69
Lin, Y., Zhang, Q., Gao, B., Tang, J., Yao, P., Li, C., Huang, S., Liu, Z., Zhou, Y., Liu, Y., et al. (2023) · Nature Machine Intelligence · doi:10.1038/s42256-023-00680-y · Cited by 65
Bi2O2Se-Based True Random Number Generator for Security Applications
Liu, B., Chang, Y.-F., Li, J., Liu, X., Wang, L. A., Verma, D., Liang, H., Zhu, H., Zhao, Y., Li, L., et al. (2022) · ACS Nano · doi:10.1021/acsnano.2c01784 · Cited by 58
Lu, Y., Li, H., Li, Y., Li, L., Wan, T., Yang, L., Zuo, W., Xue, K., & Miao, X. (2022) · Advanced Electronic Materials · doi:10.1002/aelm.202200202 · Cited by 55
Mott neurons with dual thermal dynamics for spatiotemporal computing
Kim, G., In, J. H., Lee, Y., Rhee, H., Park, W., Song, H., Park, J., Jeon, J. B., Brown, T. D., Talin, A. A., et al. (2024) · Nature Materials · doi:10.1038/s41563-024-01913-0 · Cited by 61
Self-citationProbabilistic computing with NbOx metal-insulator transition-based self-oscillatory pbit
Rhee, H., Kim, G., Song, H., Park, W., Kim, D. H., In, J. H., Lee, Y., & Kim, K. M. (2023) · Nature Communications · doi:10.1038/s41467-023-43085-6 · Cited by 52
Self-citationLeveraging volatile memristors in neuromorphic computing: from materials to system implementation
Moon, T., Soh, K., Kim, J. S., Kim, J. E., Chun, S. Y., Cho, K., Yang, J. J., & Yoon, J. H. (2024) · Materials Horizons · doi:10.1039/d4mh00675e · Cited by 55
Volatile threshold switching memristor: An emerging enabler in the AIoT era
Zuo, W., Zhu, Q., Fu, Y., Zhang, Y., Wan, T., Li, Y., Xu, M., & Miao, X. (2023) · Journal of Semiconductors · doi:10.1088/1674-4926/44/5/053102 · Cited by 49
True random number generation using the spin crossover in LaCoO3
Woo, K. S., Zhang, A., Arabelo, A. K., Brown, T. D., Park, M., Talin, A. A., Fuller, E. J., Bisht, R. S., Qian, X., Arróyave, R., et al. (2024) · Nature Communications · doi:10.1038/s41467-024-49149-5 · Cited by 49
Advances in memristor based artificial neuron fabrication-materials, models, and applications
Bian, J., Liu, Z., Tao, Y., Wang, Z., Zhao, X., Lin, Y., Xu, H., & Liu, Y. (2023) · International Journal of Extreme Manufacturing · doi:10.1088/2631-7990/acfcf1 · Cited by 45
Random bit generation based on a self‐chaotic microlaser with enhanced chaotic bandwidth
Li, J., Xiao, J., Yang, Y., Chen, Y.-L., & Huang, Y. (2023) · Nanophotonics · doi:10.1515/nanoph-2023-0549 · Cited by 37
Cryptographic transistor for true random number generator with low power consumption
Kim, S.-I., You, H.-J., Kim, M.-S., An, U.-S., Kim, M.-S., Lee, D. H., Ryu, S.-T., & Choi, Y.-K. (2024) · Science Advances · doi:10.1126/sciadv.adk6042 · Cited by 33
“For example, tRNGs such as RRAM or MRAM, which are not Si-based complementary metal-oxide semiconductor (CMOS) devices, are widely studied given their inherent switching stochasticity as an entropy source, which relies on material-induced variations ( 11 – 18 ).”
ReLU-type memristor-based Hopfield neural network
Chen, C., & Min, F. (2022) · The European Physical Journal Special Topics · doi:10.1140/epjs/s11734-022-00642-2 · Cited by 33
High Amplitude Spike Generator in Au Nanodot-Incorporated NbOx Mott Memristor
Park, W., Kim, G., In, J. H., Rhee, H., Song, H., Park, J., Martinez, A., & Kim, K. M. (2023) · Nano Letters · doi:10.1021/acs.nanolett.2c04599 · Cited by 34
Self-citationFang, Y., Li, S., Deng, Y., Li, Y., & Chen, G. (2022) · IEEE Transactions on Industrial Electronics · doi:10.1109/tie.2022.3174294 · Cited by 32
Multielement Filament Memristor Enabling Multifunctional Neuromorphic Device
Jang, M., Song, H., Kim, H. J., Yoon, J. H., & Kim, K. M. (2025) · Advanced Functional Materials · doi:10.1002/adfm.202423273 · Cited by 33
Self-citationCheong, W. H., In, J. H., Jeon, J. B., Kim, G., & Kim, K. M. (2024) · Nature Communications · doi:10.1038/s41467-024-50592-7 · Cited by 32
Self-citationLocalized Conduction Channels in Memristors
Woo, K. S., Williams, R. S., & Kumar, S. (2024) · Chemical Reviews · doi:10.1021/acs.chemrev.4c00454 · Cited by 32
Nanofluidic Volatile Threshold Switching Ionic Memristor: A Perspective
Zhang, M., Xu, G., Zhang, H., & Xiao, K. (2025) · ACS Nano · doi:10.1021/acsnano.4c17760 · Cited by 29
Memristive True Random Number Generator with Intrinsic Two-Dimensional Physical Unclonable Function
Liu, B., Ma, J., Tai, H. H., Verma, D., Sahoo, M., Chang, Y.-F., Liang, H., Feng, S., Li, L., Hou, T., et al. (2023) · ACS Applied Electronic Materials · doi:10.1021/acsaelm.2c01533 · Cited by 27
Generative complex networks within a dynamic memristor with intrinsic variability
Guo, Y., Duan, W., Liu, X., Wang, X., Wang, L., Duan, S., Ma, C., & Li, H. (2023) · Nature Communications · doi:10.1038/s41467-023-41921-3 · Cited by 30
Deep Bayesian active learning using in-memory computing hardware
Lin, Y., Gao, B., Tang, J., Zhang, Q., Qian, H., & Wu, H. (2024) · Nature Computational Science · doi:10.1038/s43588-024-00744-y · Cited by 30
A 2.22 Mb/s True Random Number Generator Based on a GeTex Ovonic Threshold Switching Memristor
Fu, Y., Wen, J., Wang, L., Yang, L., Zhu, Q., Zuo, W., Zhang, P., Li, Y., Tong, H., Ma, G., et al. (2023) · IEEE Electron Device Letters · doi:10.1109/led.2023.3259000 · Cited by 25
Huang, Z., Huang, W., Xu, C., Xu, Y., Du, T., Liu, W., Li, J., Xie, S., Chen, G., & Chen, H. (2025) · Advanced Functional Materials · doi:10.1002/adfm.202502211 · Cited by 23
A true random number generator based on double threshold-switching memristors for image encryption
Bian, J., Tao, Y., Wang, Z., Dong, Y., Li, Z., Zhao, X., Lin, Y., Xu, H., & Liu, Y. (2023) · Applied Physics Letters · doi:10.1063/5.0145875 · Cited by 23
Stochasticity in the synchronization of strongly coupled spiking oscillators
Qiu, E., Salev, P., Fratino, L., Rocco, R., Navarro, H., Adda, C., Li, J., Lee, M., Kalcheim, Y., Rozenberg, M. J., et al. (2023) · Applied Physics Letters · doi:10.1063/5.0129205 · Cited by 20
Kim, N. J., Oh, J., Kim, S., Cha, J., Choi, J., Im, S. G., Choi, S., & Jang, B. C. (2024) · Advanced Functional Materials · doi:10.1002/adfm.202305136 · Cited by 20
Promotion of Probabilistic Bit Generation in Mott Devices by Embedded Metal Nanoparticles
Seo, Y., Park, Y., Hur, P., Jo, M., Heo, J., Choi, B. J., & Son, J. (2024) · Advanced Materials · doi:10.1002/adma.202402490 · Cited by 19
Fully Memristive Elementary Motion Detectors for a Maneuver Prediction
Song, H., Lee, M. G., Kim, G., Kim, D. H., Kim, G., Park, W., Rhee, H., In, J. H., & Kim, K. M. (2024) · Advanced Materials · doi:10.1002/adma.202309708 · Cited by 19
Self-citationChoi, W., Kwon, O., Lee, J., Oh, S., Heo, S., Ban, S., Seo, Y., Kim, D., & Hwang, H. (2024) · Applied Physics Reviews · doi:10.1063/5.0183292 · Cited by 18
Mott Memristors for Neuromorphics
Zhao, Z., Luan, W., Zhai, Y., Lv, Z., Zhang, M., Yan, Y., Xue, S., Zhou, K., Ding, G., Han, S., et al. (2024) · Advanced Physics Research · doi:10.1002/apxr.202400129 · Cited by 18
A bioinspired flexible artificial mechanoreceptor based on VO2 insulator-metal transition memristor
Fang, S. L., Han, C., Liu, W., Han, Z. R., Ma, B., Cui, Y. L., Fan, S. Q., Li, X., Wang, X. L., Zhang, G. H., et al. (2022) · Journal of Alloys and Compounds · doi:10.1016/j.jallcom.2022.165096 · Cited by 17
Stochastic current response in diffusive memristor for security applications
Xing, X., Huang, S., Gong, Y., Wang, J., Lv, Z., Zhou, Y., Zhao, X., Hao, J., & Han, S. (2023) · Materials Today Nano · doi:10.1016/j.mtnano.2023.100315 · Cited by 18
400 Gb/s physical random number generation based on deformed square self-chaotic lasers
Li, J., Li, Y., Dong, Y., Yang, Y., Xiao, J., & Huang, Y. (2023) · Chinese Optics Letters · doi:10.3788/col202321.061901 · Cited by 17
Han, C., Zhao, S., Fang, S. L., Liu, W., Tang, W. M., Lai, P. T., Li, C., Ma, Y. X., Song, J. Q., Li, X., et al. (2024) · ACS Applied Materials & Interfaces · doi:10.1021/acsami.4c12874 · Cited by 16
Light in, sound keys out: photoacoustic PUFs from stochastic nanocomposites
Park, T., Kim, J. H., Ko, R., Park, B., & Yoo, H. (2025) · Nature Communications · doi:10.1038/s41467-025-62747-1 · Cited by 16
A High-Speed True Random Number Generator Based on Unified Selector-RRAM
Qin, Y., Wang, Z., Yang, Y., Shan, L., Wang, Q., Bao, L., Robertson, J., Cai, Y., & Huang, R. (2023) · IEEE Electron Device Letters · doi:10.1109/led.2023.3322992 · Cited by 17
Ferroelectric Stochasticity in 2D CuInP 2 S 6 and Its Application for True Random Number Generator
Kang, S., Hong, D., Das, B., Lee, S., Park, J., Lee, Y., & Lee, S. (2024) · Advanced Materials · doi:10.1002/adma.202406850 · Cited by 16
Self-citationMemristive Explainable Artificial Intelligence Hardware
Song, H., Park, W., Kim, G., Choi, M. G., In, J. H., Rhee, H., & Kim, K. M. (2024) · Advanced Materials · doi:10.1002/adma.202400977 · Cited by 16
Self-citationA High-Quality Entropy Source Using van der Waals Heterojunction for True Random Number Generation
Abraham, N., Watanabe, K., Taniguchi, T., & Majumdar, K. (2022) · ACS Nano · doi:10.1021/acsnano.1c11084 · Cited by 17
A flexible and stretchable bionic true random number generator
Wan, Y., Chen, K., Huang, F. C., Wang, P., Leng, X., Li, D., Kang, J., Qiu, Z., & Yao, Y. (2022) · Nano Research · doi:10.1007/s12274-022-4109-9 · Cited by 16
Memristive True Random Number Generator for Security Applications
Zhao, X., Chen, L.-W., Li, K., Schmidt, H., Polian, I., & Du, N. (2024) · Sensors · doi:10.3390/s24155001 · Cited by 15
Jiang, B., Wang, Y., Qing, Y., Shan, Y., Li, R., Wu, Z.-H., Chen, Z., Zhao, L., Cai, D., Su, P., et al. (2025) · ACS Nano · doi:10.1021/acsnano.5c05204 · Cited by 14
MERRC: A Memristor-Enabled Reconfigurable Low-Power Reservoir Computing Architecture at the Edge
Nowshin, F., Huang, Y., Sarkar, M. R., Xia, Q., & Yi, Y. (2024) · IEEE Transactions on Circuits and Systems I: Regular Papers · doi:10.1109/tcsi.2023.3329337 · Cited by 12
An electro-optical Mott neuron based on niobium dioxide
Islam, M., Bohaichuk, S. M., Brown, T. D., Oh, S., Perez, C., Zhang, C., Park, T. J., Park, M., Talin, A. A., Ramanathan, S., et al. (2025) · Nature Electronics · doi:10.1038/s41928-025-01406-1 · Cited by 12
Fatigue of NbO x -Based Locally Active Memristors—Part I: Experimental Characteristics
Ding, Y., Li, Y., Jia, S., Chen, P., Zhang, X., Wang, W. J., Li, Y., Hao, Y., Bi, J., Gong, T., et al. (2023) · IEEE Transactions on Electron Devices · doi:10.1109/ted.2023.3322668 · Cited by 12
SecureMem: efficient flexible Pt/GO/Cu memristor for true random number generation
Abunahla, H., Humood, K., Alazzam, A., & Mohammad, B. S. (2021) · Flexible and Printed Electronics · doi:10.1088/2058-8585/ac1501 · Cited by 12
Memcapacitors in neuromorphic architectures: the mechanisms, challenges, and applications
Chen, K., Shih, L., Chen, Y.-C., Lin, K., & Chen, J. (2025) · Journal of Materials Chemistry C · doi:10.1039/d5tc00993f · Cited by 11
A high-speed true random number generator based on Ag/SiNx/n-Si memristor
Yan, X., Zhang, Z., Guan, Z., Fang, Z., Zhang, Y., Zhao, J., Sun, J., Han, X., Niu, J., Wang, L., et al. (2023) · Frontiers of Physics · doi:10.1007/s11467-023-1331-1 · Cited by 11
Liu, Y., Liu, P., Wen, Y., Liang, Z., Liu, S., Song, L., Pei, J., Fan, X., Ma, T., Wang, G., et al. (2024) · Nano Letters · doi:10.1021/acs.nanolett.4c03957 · Cited by 11
Chen, P., Zhang, X., Qiu, J., Li, Y., Jia, S., Cheng, L., Yang, D., Wang, X., Chen, J., Chen, X., et al. (2025) · Advanced Functional Materials · doi:10.1002/adfm.202423800 · Cited by 11
Low‐Power Optoelectronic Hybrid Perovskite‐Based Memristor for Ternary Hardware Security Monitoring
Du, F., Liu, J., Han, W., Hong, E., & Fang, X. (2025) · Advanced Functional Materials · doi:10.1002/adfm.202516930 · Cited by 11
Gu, R., Sun, Y., Wang, Y., Wang, W., & Li, Q. (2021) · AIP Advances · doi:10.1063/5.0064585 · Cited by 11
Maicke, A., Arzate, J. D., Liu, S., Kwon, J., Smith, J. D., Aimone, J. B., Misra, S., Schuman, C. D., Cardwell, S., & Incorvia, J. A. C. (2024) · Nanotechnology · doi:10.1088/1361-6528/ad3b01 · Cited by 11
Jin, Y., Zhu, M., Zhou, Y., Zhang, Z., Wang, J., Song, X., Meng, J., Ke, S., Zhang, T., Chen, S., et al. (2024) · Advanced Electronic Materials · doi:10.1002/aelm.202400072 · Cited by 10
A True Random Number Generator Based on High-Speed Ag/a-Si/Pt Memristor
Guo, Z., Fang, Z., Niu, J., Wang, H., Yan, L., Tong, L., Zhao, J., Yin, S., Sun, S., Feng, L., et al. (2024) · IEEE Transactions on Electron Devices · doi:10.1109/ted.2024.3454588 · Cited by 10
More-than-Moore Approaches Implemented Using van der Waals Heterostructures
Lee, S., Kim, Y. K., Noh, J., Jang, B. C., & Lee, S. (2025) · ACS Nano · doi:10.1021/acsnano.5c07260 · Cited by 9
Self-citationAmorphous indium–gallium–zinc–oxide memristor arrays for parallel true random number generators
Mao, H., Zhu, Y., Zhu, Y., Peng, B., Chen, C., Zhu, L. Q., Ke, S., Wang, X., Wan, C., & Wan, Q. (2023) · Applied Physics Letters · doi:10.1063/5.0131981 · Cited by 9
Han, Y., Chae, M., Choi, D., Song, I., Ko, C., Cresti, A., Theodorou, C. G., & Joo, M. (2023) · ACS Applied Materials & Interfaces · doi:10.1021/acsami.3c13699 · Cited by 9
Stochastic Photoresponse‐Driven Perovskite TRNGs for Secure Encryption Systems
Ahn, D., Lee, M., Kim, W., Lee, Y. K., Lee, J. Y., Jung, G. Y., Choi, H., Yoon, Y., Song, H. S., Lee, H., et al. (2025) · Advanced Science · doi:10.1002/advs.202412139 · Cited by 10
Self-citationSnS2 memtransistor-based Lorenz chaotic system for true random number generation
Rehman, S., Kim, M., Khan, M. F., & Kim, S. (2024) · Nano Energy · doi:10.1016/j.nanoen.2024.109764 · Cited by 9
Poly 3-methylthiophene based memristor device for neuromorphic computing
Shanbogh, S. M., Varade, A., Kumari, A., & Anjaneyulu, P. (2023) · Synthetic Metals · doi:10.1016/j.synthmet.2023.117360 · Cited by 8
Fully Resistive In‐Memory Cryptographic Engine with Dual‐Polarity Memristive Crossbar Array
Kim, Y. R., Shin, D. H., Ghenzi, N., Cheong, S., Cho, J. M., Shim, S. K., Lee, J., Kim, B. S., Yim, S., Park, T., et al. (2024) · Advanced Functional Materials · doi:10.1002/adfm.202414332 · Cited by 8
Self-citationLiu, Y.-X., Huang, K.-X., Bai, Y., Yang, Z., & Li, J. (2023) · Chinese Physics Letters · doi:10.1088/0256-307x/40/7/070303 · Cited by 7
Fatigue of NbO x -Based Locally Active Memristors—Part II: Mechanisms and Modeling
Li, Y., Ding, Y., Zhang, X., Jia, S., Wang, W. Q., Li, Y., Wang, M., Jiang, H., Liu, Q., Xu, N. S., et al. (2023) · IEEE Transactions on Electron Devices · doi:10.1109/ted.2023.3322672 · Cited by 7
Cryptographic triboelectric random number generator with gentle breezes of an entropy source
Kim, M., Tcho, I., & Choi, Y. (2024) · Scientific Reports · doi:10.1038/s41598-024-51939-2 · Cited by 6
Enhancing Johnson-Nyquist noise for high-performance Mott memristor-based oscillatory TRNG
Kim, G., In, J. H., Rhee, H., Park, W., Song, H., & Kim, K. M. (2025) · npj Unconventional Computing · doi:10.1038/s44335-025-00027-3 · Cited by 9
Self-citationJiang, D., Cao, C., Zhang, J., Zhang, O., Zhu, C., Xu, J., Zhang, Q., Li, W., Da, Y., Miao, X., et al. (2026) · ACS Applied Electronic Materials · doi:10.1021/acsaelm.5c02703 · Cited by 6
Xiao, Y., Ke, S., Jin, Y., Zhang, T., Jiang, B., Meng, J., Chen, S., Li, R., Zhang, Z., & Ye, C. (2023) · Ceramics International · doi:10.1016/j.ceramint.2023.12.211 · Cited by 6
Zhang, X., Yu, H., Li, W., Chen, Y., Zeng, N., Shi, W., Ling, H., Huang, W., & Yi, M. (2024) · ACS Applied Materials & Interfaces · doi:10.1021/acsami.4c08914 · Cited by 6
Liu, B., Zhao, Y., Chang, Y., Tai, H. H., Liang, H., Chen, T., Feng, S., Hou, T., & Lai, C. (2023) · Chip · doi:10.1016/j.chip.2023.100040 · Cited by 6
Over 1011-fold variability for a base-12 PUF using particle-damaged graphene
Lee, D. H., Han, Y., Woo, G., 구륜한, Shin, H., Cho, J., Lee, E. K., Shin, W., Kim, T., & Yoo, H. (2025) · Device · doi:10.1016/j.device.2025.100936 · Cited by 5
Jiang, B., Ke, S., Tao, Z., Jin, Y., Meng, J., Song, X., Xiao, Y., Jiang, L., Wang, J., Chen, Y. P., et al. (2023) · Science China Technological Sciences · doi:10.1007/s11431-023-2469-8 · Cited by 5
Zou, S., Zhao, X. G., Xue, Y., Gao, J., Li, Y.-L., Cui, Y., & Luo, J. (2025) · IEICE Electronics Express · doi:10.1587/elex.22.20250084 · Cited by 4
Enhancing IoT security with threshold switching-based unified security primitives
Zhang, G., Kan, J., Fan, X., Luo, Q., Sun, J., Gao, D., & Zhang, Y. (2025) · Nanotechnology · doi:10.1088/1361-6528/adb980 · Cited by 4
Ultrafast ~7 Mbps True Random Number Generator Based on SNGCT Selector
Guy, J., Ambrosi, E., Wu, C., & Bao, X. (2024) · IEEE Transactions on Electron Devices · doi:10.1109/ted.2024.3371424 · Cited by 3
Lin, Y., Zhang, Q., Gao, B., Tang, J., Zhao, H., Qin, Q., Wang, Z., Qian, H., & Wu, H. (2024) · IEEE Transactions on Electron Devices · doi:10.1109/ted.2024.3497917 · Cited by 3
Review on data-centric brain-inspired computing paradigms exploiting emerging memory devices
Wang, W. J., Kvatinsky, S., Schmidt, H., & Du, N. (2022) · Frontiers in Electronic Materials · doi:10.3389/femat.2022.1020076 · Cited by 3
Role of heat in post-silicon electronics
Woo, K. S., Kim, G., Kim, K. M., & Kumar, S. (2025) · Applied Physics Reviews · doi:10.1063/5.0258988 · Cited by 4
Self-citationA comprehensive study on resistive random access memory based true random number generators
Zahoor, F. (2025) · Computers & Electrical Engineering · doi:10.1016/j.compeleceng.2025.110901 · Cited by 2
Strangio, S., Dimaggio, E., Marian, D., Catania, A., Toral-López, A., Pieri, F., Iannaccone, G., & Fiori, G. (2026) · Advanced Functional Materials · doi:10.1002/adfm.202529572 · Cited by 2
Sub-mV tunable photonic p-bits for probabilistic computing
Seo, J., Park, T., Park, J.-Y., Lee, H.-K., Park, J. Y., Shin, W., Han, J., & Yoo, H. (2026) · Science Advances · doi:10.1126/sciadv.aeb9277 · Cited by 2
Self-citationInvestigation and mitigation of Mott neuronal oscillation fluctuation in spiking neural network
Wu, L., Wang, Z., Bao, L., Shan, L., Yu, Z., Yang, Y., Zhang, S., Bai, G., Wang, C., Robertson, J., et al. (2024) · Science China Information Sciences · doi:10.1007/s11432-023-3745-y · Cited by 2
Sequential Bayesian Inference and Monte-Carlo Sampling Using Memristor Stochasticity
Malik, A., & Papavassiliou, C. (2024) · IEEE Transactions on Circuits and Systems I Regular Papers · doi:10.1109/tcsi.2024.3470318 · Cited by 2
Improved AES scheme based on chaotic mapping
Dai, Q., & Liu, X. (2024) · International Conference on Electronic Information Engineering and Computer Communication (EIECC) · doi:10.1109/eiecc64539.2024.10929495 · Cited by 2
Random number generator via hexagonal boron nitride heterostructure
Sani, R. H., & Behnia, S. (2022) · Physica Scripta · doi:10.1088/1402-4896/ac54d2 · Cited by 2
TRIM: AI Guided Random Number Generation for Resource-Constrained IoT Systems
Suha, T., Rahman, M. H., Rice, A. E., Smith, C., Awad, R. A., & Chakraborty, P. (2025) · IEEE Access · doi:10.1109/access.2025.3586177 · Cited by 1
Kim, S.-I., Chin, H.-S., Han, J.-A., Kim, S., Kim, J., Lee, S., Lee, D. H., Kim, M., Ryu, S., & Choi, Y. (2025) · ACS Applied Materials & Interfaces · doi:10.1021/acsami.5c18669 · Cited by 1
Zhao, J., Li, S., Fan, Y., Sun, W., Gao, J., Wang, J., Liu, D., Hu, Z. J., Pei, Y., Zhou, Z., et al. (2025) · Nano Materials Science · doi:10.1016/j.nanoms.2025.11.008 · Cited by 1
An Ultra-Low-Power True Random Number Generator Based on Volatile RRAM
Luo, Q., Wang, Z., Fan, X., Li, P., Zhang, G., & Zhang, Y. (2025) · International Conference on Integrated Circuits and Microsystems (ICICM) · doi:10.1109/icicm66614.2025.11315989 · Cited by 1
Luo, Y., Li, X., Hu, Z.-H., Dong, Z., Hu, B.-W., Lei, B.-J., Xiao, J., Chen, Y.-L., Huang, Y., & Yang, Y. (2026) · Optics Express · doi:10.1364/oe.588177 · Cited by 1
Choi, H., Kim, J., Kim, Y., & Woo, J. (2026) · Advanced Intelligent Discovery · doi:10.1002/aidi.202500243 · Cited by 1
Self-citationWang, Z., Lu, L., Meng, J., & Wang, T. (2026) · Materials Today · doi:10.1016/j.mattod.2026.103346 · Cited by 1
Harnessing the Second-Order Metal−Insulator Transition for Neuromorphic Computing
Hofer, J. A., Alspaugh, D. J., Basaran, A. C., Wang, T. D., Schuman, C., Rozenberg, M. J., & Schuller, I. K. (2026) · ACS Applied Electronic Materials · doi:10.1021/acsaelm.6c00427 · Cited by 1
A New Game Plan: Coaches Tackle the Issues of Violence and Disrespect in Sports.
Bennett, L. (1998) · Teaching tolerance · Cited by 1
Emerging non-CMOS devices and technologies
Basak, A., Banerjee, W., Singh, A., Chakraborty, A., & Chanda, M. (2023) · Elsevier eBooks · doi:10.1016/b978-0-323-91832-9.00014-2 · Cited by 1
Metadata
- Authors
- Kim, G., In, J. H., Kim, Y. S., Rhee, H., Park, W., Song, H., Park, J., & Kim, K. M.
- Affiliations
- Korea Advanced Institute of Science and Technology (KR)
- Corresponding author
- Kim, Kyung Min
- ORCID
- Venue
- Nature Communications
- Published
- 2021-05-18
- Volume
- 12
- Issue
- 1
- Pages
- 2906-2906
- ISSN
- 2041-1723 (ISSN-L)
- PMC
- PMC8131590
- OpenAlex
- W3112007195
- Cited by
- 126
- References
- 41
- Citations by year
- 2026: 23 · 2025: 27 · 2024: 32 · 2023: 29 · 2022: 11 · 2021: 3
- FWCI
- 5.51
- Type
- journal article
- Language
- en
- Open access
- gold
- doi.org
- Locations
- Nature Communications (publishedVersion, cc-by)
- Research Square (acceptedVersion, cc-by)
- PubMed Central (publishedVersion, cc-by)
- PubMed (publishedVersion)
- RePEc: Research Papers in Economics (submittedVersion)
- DOAJ (DOAJ: Directory of Open Access Journals) (submittedVersion, cc-by-sa)
- Funders
- Ministry of Trade, Industry and Energy (20003655, 20003789)
- Korea Advanced Institute of Science and Technology
- Korea Semiconductor Research Consortium
- Topics
- Physical Sciences › Engineering › Electrical and Electronic Engineering › Advanced Memory and Neural Computing
- Physical Sciences › Computer Science › Hardware and Architecture › Physical Unclonable Functions (PUFs) and Hardware Security
- Physical Sciences › Computer Science › Computer Vision and Pattern Recognition › Chaos-based Image/Signal Encryption
- Keywords
- true random number generation, memristors, Mott transition, variation tolerance, temperature variation, device-to-device variation, hardware security, hardware-based cryptography
About these checks
Registry, retraction, Cites and statistics results are computed, not judged, with one exception: a printed reference that no index lists is read once by a model before it counts as a citation error. Claims are extracted by a model and kept only when their quote appears verbatim in the text; each cited source is then checked, with a model’s help, for whether it says what the claim relies on. Those verdicts can be wrong — read the claim’s quote and the cited source before relying on one.
Statistics and arithmetic are recomputed, not judged.
Confidence bands are shown only for fields calibrated on our annotated test set. None is calibrated yet, so no band is shown.
What counts as a claim ›How we measure confidence ›How we check this ›
Are you an author, or do you see a problem with this page? Request a review
