

The DOI matches its Crossref record; 20 of the 20 references it cites were found in a registry or an index.
Restoration of energy homeostasis by SIRT6 extends healthy lifespan
Abstract
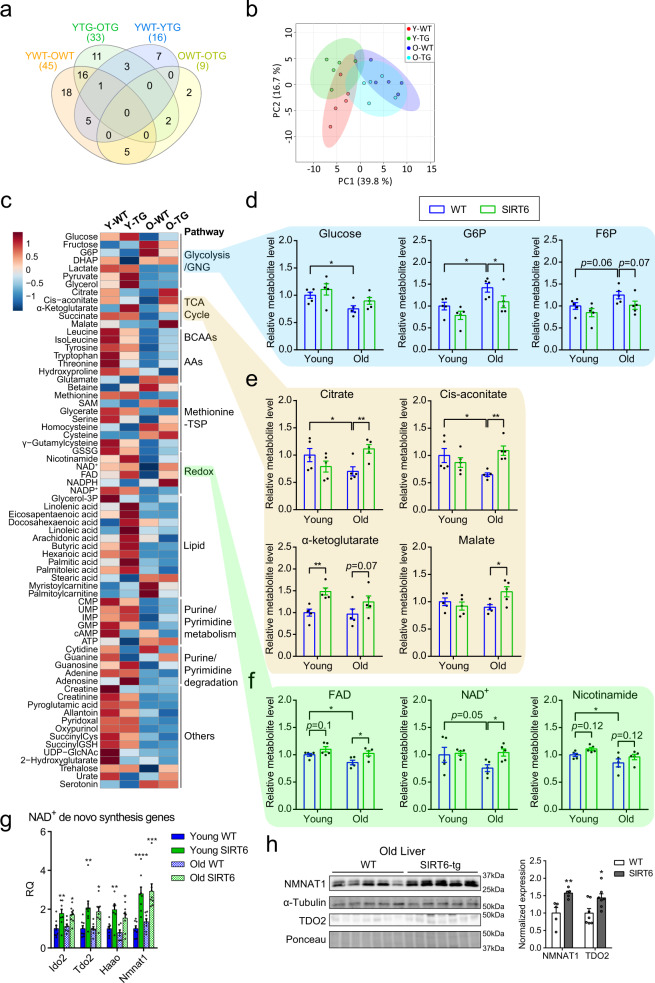
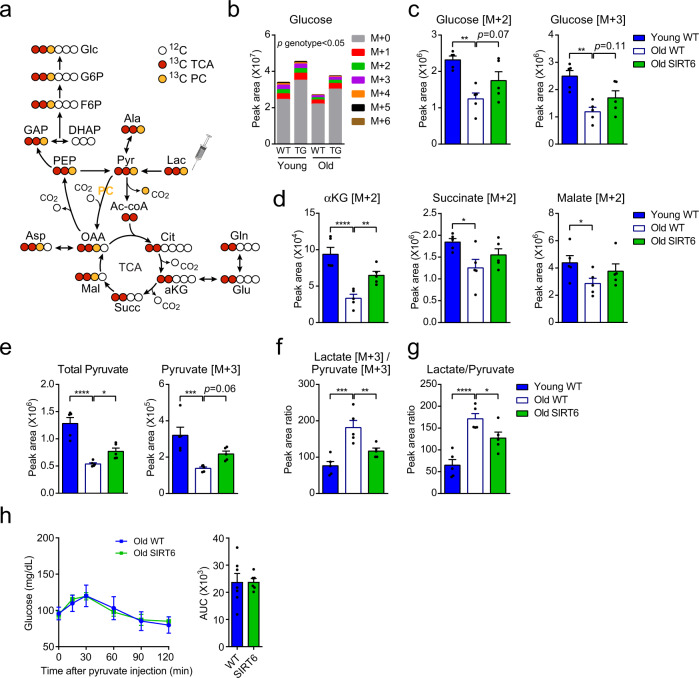
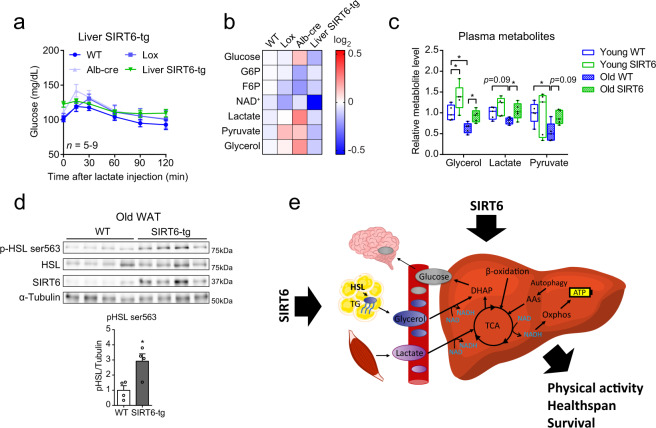
Aging leads to a gradual decline in physical activity and disrupted energy homeostasis. The NAD + -dependent SIRT6 deacylase regulates aging and metabolism through mechanisms that largely remain unknown. Here, we show that SIRT6 overexpression leads to a reduction in frailty and lifespan extension in both male and female B6 mice. A combination of physiological assays, in vivo multi-omics analyses and 13 C lactate tracing identified an age-dependent decline in glucose homeostasis and hepatic glucose output in wild type mice. In contrast, aged SIRT6-transgenic mice preserve hepatic glucose output and glucose homeostasis through an improvement in the utilization of two major gluconeogenic precursors, lactate and glycerol. To mediate these changes, mechanistically, SIRT6 increases hepatic gluconeogenic gene expression, de novo NAD + synthesis, and systemically enhances glycerol release from adipose tissue. These findings show that SIRT6 optimizes energy homeostasis in old age to delay frailty and preserve healthy aging.
Overview
The claims and statistics of this paper haven’t been checked yet.
Run the check — free, no account needed. It reads the open-access text and checks the sources it cites.
Integrity signals
Registry
Cites
Statistics
Figures
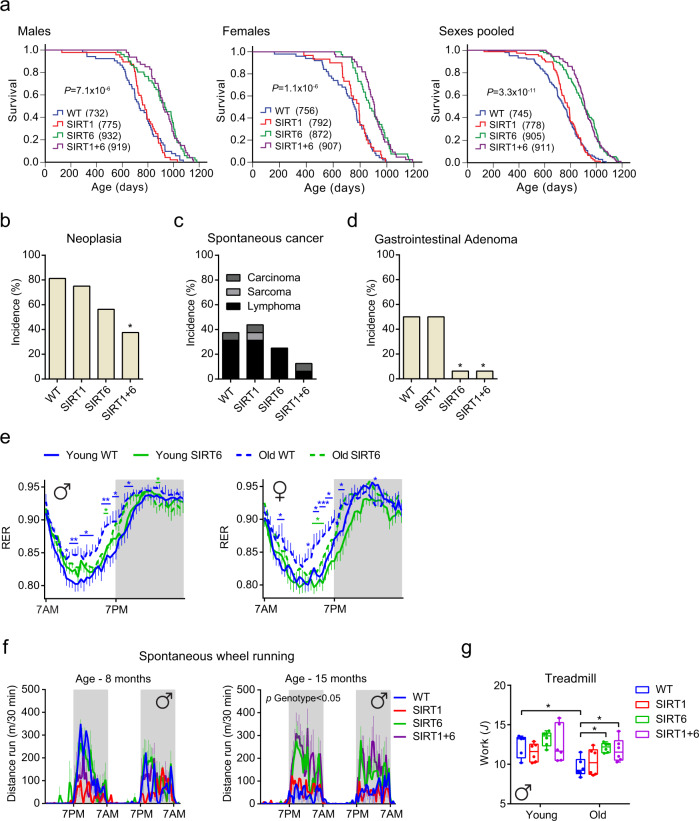
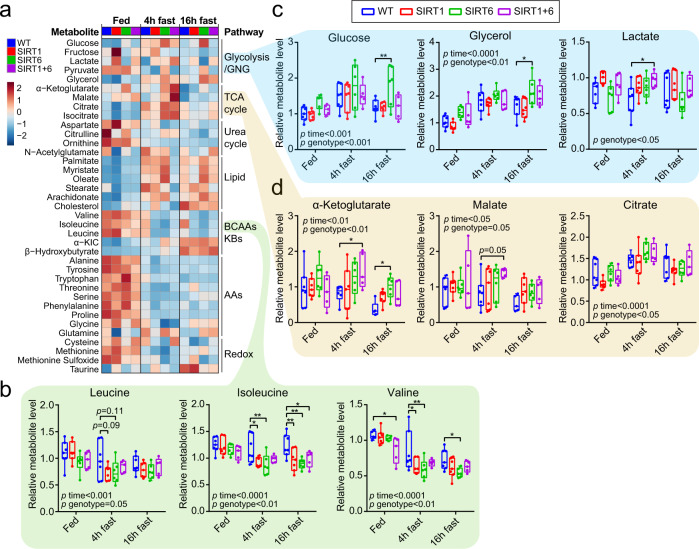
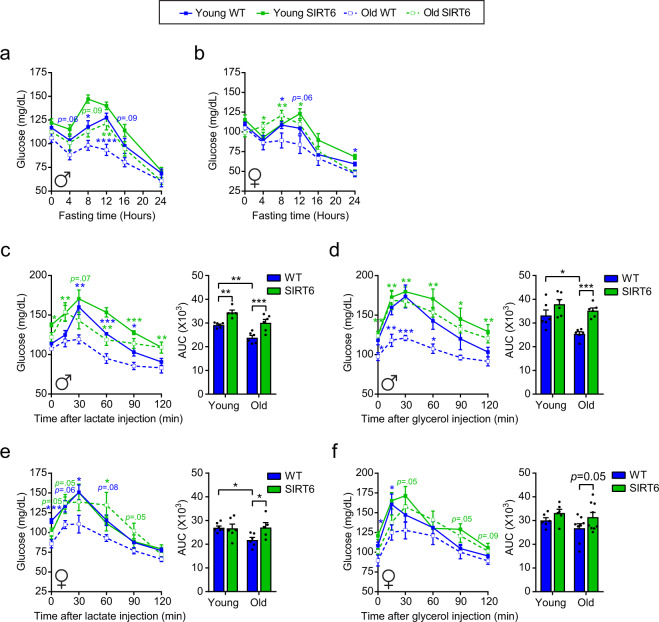
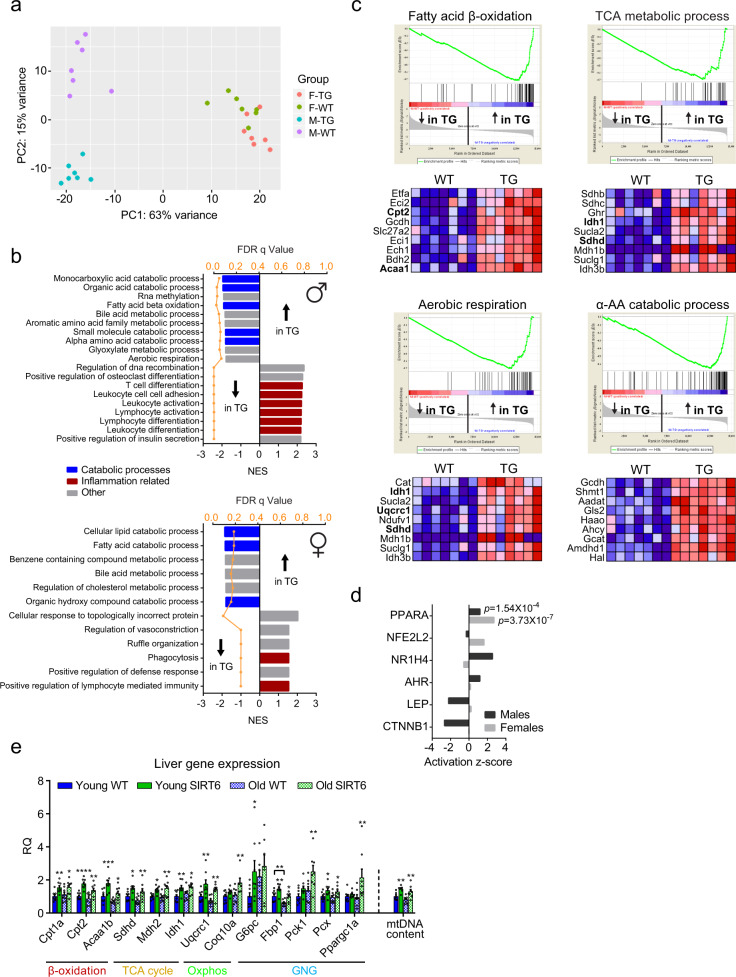
Verification
Claims the paper makes
The claims and statistics of this paper haven’t been checked yet.
Run the check — free, no account needed. It reads the open-access text and checks the sources it cites.
Claims other papers make about this one
Each is checked against this paper’s own text: does it say what the citing paper says it does?
The cited source says what the claim attributes to it.
In the citing paper
“while Sirt6 overexpression extends lifespan 16 .”
From Hallmarks of aging: An expanding universe (2023) · cites this paper as [16]
Self-check
Percentages, sums and reported differences re-computed from the paper’s own numbers.
The self-check needs the paper’s full text.
Citations
Cites
Subramanian, A., Tamayo, P., Mootha, V. K., Mukherjee, S., Ebert, B. L., Gillette, M. A., Paulovich, A., Pomeroy, S. L., Golub, T. R., Lander, E. S., et al. (2005) · Proceedings of the National Academy of Sciences · doi:10.1073/pnas.0506580102 · Cited by 53,625
Frailty in Older Adults: Evidence for a Phenotype
Fried, L. P., Tangen, C. M., Walston, J., Newman, A. B., Hirsch, C., Gottdiener, J., Seeman, T., Tracy, R., Kop, W. J., Burke, G., et al. (2001) · The Journals of Gerontology Series A: Biological Sciences and Medical Sciences · doi:10.1093/gerona/56.3.m146 · Cited by 24,907
HTSeq—a Python framework to work with high-throughput sequencing data
Anders, S., Pyl, P. T., & Huber, W. (2015) · Bioinformatics · doi:10.1093/bioinformatics/btu638 · Cited by 21,464
López-Otín, C., Blasco, M. A., Partridge, L., Serrano, M., & Kroemer, G. (2013) · Cell · doi:10.1016/j.cell.2013.05.039 · Cited by 14,982
Self-citationCantó, C., Menzies, K. J., & Auwerx, J. (2015) · Cell Metabolism · doi:10.1016/j.cmet.2015.05.023 · Cited by 1,648
Effects of intermittent fasting on health, aging, and disease
de Cabo, R., & Mattson, M. P. (2019) · New England Journal of Medicine · doi:10.1056/nejmra1905136 · Cited by 1,605
Metformin improves healthspan and lifespan in mice
Martin-Montalvo, A., Mercken, E. M., Mitchell, S. J., Palacios, H. H., Mote, P. L., Scheibye-Knudsen, M., Gomes, A. P., Ward, T. M., Minor, R. K., Blouin, M.-J., et al. (2013) · Nature Communications · doi:10.1038/ncomms3192 · Cited by 1,445
The sirtuin SIRT6 regulates lifespan in male mice
Kanfi, Y., Naiman, S., Amir, G., Peshti, V., Zinman, G., Nahum, L., Bar-Joseph, Z., & Cohen, H. Y. (2012) · Nature · doi:10.1038/nature10815 · Cited by 1,059
Self-citationThe Critical Role of Metabolic Pathways in Aging
Barzilai, N., Huffman, D. M., Muzumdar, R. H., & Bartke, A. (2012) · Diabetes · doi:10.2337/db11-1300 · Cited by 803
The histone deacetylase SIRT6 is a tumor suppressor that controls cancer metabolism
Sebastián, C., Zwaans, B. M. M., Silberman, D. M., Gymrek, M., Goren, A., Zhong, L., Ram, O., Truelove, J., Guimaraes, A. R., Toiber, D., et al. (2012) · Cell · doi:10.1016/j.cell.2012.10.047 · Cited by 660
Sirt1 improves healthy ageing and protects from metabolic syndrome-associated cancer
Herranz, D., Muñoz-Martin, M., Cañamero, M., Mulero, F., Martinez-Pastor, B., Fernandez-Capetillo, O., & Serrano, M. (2010) · Nature Communications · doi:10.1038/ncomms1001 · Cited by 612
SIRT1 Is Essential for Normal Cognitive Function and Synaptic Plasticity
Michan, S., Li, Y., Chou, M. M.-H., Parrella, E., Ge, H., Long, J. M., Allard, J. S., Lewis, K., Miller, M., Xu, W., et al. (2010) · Journal of Neuroscience · doi:10.1523/jneurosci.0027-10.2010 · Cited by 541
The metabolic footprint of aging in mice
Houtkooper, R. H., Argmann, C., Houten, S. M., Cantó, C., Jeninga, E. H., Andreux, P. A., Thomas, C., Doenlen, R., Schoonjans, K., & Auwerx, J. (2011) · Scientific Reports · doi:10.1038/srep00134 · Cited by 528
NAD(+) in aging: molecular mechanisms and translational implications
Fang, E. F., Lautrup, S., Hou, Y., Demarest, T. G., Croteau, D. L., Mattson, M. P., & Bohr, V. A. (2017) · Trends in Molecular Medicine · doi:10.1016/j.molmed.2017.08.001 · Cited by 501
Effects of Sex, Strain, and Energy Intake on Hallmarks of Aging in Mice
Mitchell, S. J., Madrigal-Matute, J., Scheibye-Knudsen, M., Fang, E., Aon, M., González-Reyes, J. A., Cortassa, S., Kaushik, S., Gonzalez-Freire, M., Patel, B., et al. (2016) · Cell Metabolism · doi:10.1016/j.cmet.2016.05.027 · Cited by 451 · cited 2×
“W T Y-T G O-W T O-T G Lipid Methionine -TSP Glycolysis /GNG TCA Cycle Purine/ Pyrimidine metabolism Purine/ Pyrimidine degradation Others −1 −0.5 0 0.5 1 11 7 2 18 16 1 0 3 0 2 0 5 0 5 0 YWT-OWT (45) YTG-OTG (33) YWT-YTG (16) OWT-OTG (9) 0 10 PC1 (39.8”
InfluentialSIRT6 is responsible for more efficient DNA double-strand break repair in long-lived species
Tian, X., Firsanov, D., Zhang, Z., Cheng, Y., Luo, L., Tombline, G., Tan, R., Simon, M., Henderson, S., Steffan, J., et al. (2019) · Cell · doi:10.1016/j.cell.2019.03.043 · Cited by 353
Nicotinamide Improves Aspects of Healthspan, but Not Lifespan, in Mice
Mitchell, S. J., Bernier, M., Aon, M. A., Cortassa, S., Kim, E. Y., Fang, E. F., Palacios, H. H., Ali, A., Navas-Enamorado, I., Di Francesco, A., et al. (2018) · Cell Metabolism · doi:10.1016/j.cmet.2018.02.001 · Cited by 338
Self-citationSIRT6 protects against pathological damage caused by diet‐induced obesity
Kanfi, Y., Peshti, V., Gil, R., Naiman, S., Nahum, L., Levin, E., Kronfeld‐Schor, N., & Cohen, H. Y. (2010) · Aging Cell · doi:10.1111/j.1474-9726.2009.00544.x · Cited by 311
Self-citationTipping the metabolic scales towards increased longevity in mammals
Riera, C. E., & Dillin, A. (2015) · Nature Cell Biology · doi:10.1038/ncb3107 · Cited by 153
Nuttall, F. Q., Ngo, A., & Gannon, M. C. (2008) · Diabetes/Metabolism Research and Reviews · doi:10.1002/dmrr.863 · Cited by 146
Research works printed but not linked: 70
- Partridge, L., Deelen, J. & Slagboom, P. E. Facing up to the global challenges of ageing. Nature 561, 45–56 (2018). · DOI · Paper page
- Osborne, T. B., Mendel, L. B. & Ferry, E. L. The effect of retardation of growth upon the breeding period and duration of life of rats. Science 45, 294–295 (1917). · DOI
- Di Francesco, A., Di Germanio, C., Bernier, M. & de Cabo, R. A time to fast. Science 362, 770–775 (2018). · DOI
- Bratic, I. & Trifunovic, A. Mitochondrial energy metabolism and ageing. Biochim. Biophys. Acta 1797, 961–967 (2010). · DOI
- Wilson, C. H. et al. Age-related proteostasis and metabolic alterations in Caspase-2-deficient mice. Cell Death Dis. 6, e1615–e1615 (2015). · DOI
- Ruetenik, A. & Barrientos, A. Dietary restriction, mitochondrial function and aging: from yeast to humans. Biochim. Biophys. Acta 1847, 1434–1447 (2015). · DOI · Paper page
- Rothman, D., Magnusson, I., Katz, L., Shulman, R. & Shulman, G. Quantitation of hepatic glycogenolysis and gluconeogenesis in fasting humans with 13C NMR. Science 254, 573–576 (1991). · DOI · Paper page
- Petersen, M. C., Vatner, D. F. & Shulman, G. I. Regulation of hepatic glucose metabolism in health and disease. Nat. Rev. Endocrinol. 13, 572–587 (2017). · DOI
- Satrústegui, J., Cuezva, J. M. & Machado, A. Increased basal gluconeogenesis in the aged rat.FEBS Lett. 197, 159–163 (1986). · DOI
- Sumida, K. D., Crandall, S. C., Chadha, P. L. & Qureshi, T. Hepatic gluconeogenic capacity from various precursors in young versus old rats. Metabolism 51, 876–880 (2002). · DOI
- Horn, D. B., Podolin, D. A., Friedman, J. E., Scholnick, D. A. & Mazzeo, R. S. Alterations in key gluconeogenic regulators with age and endurance training. Metabolism 46, 414–419 (1997). · DOI
- Podolin, D. A., Gleeson, T. T. & Mazzeo, R. S. Hormonal regulation of hepatic gluconeogenesis: influence of age and training. Am. J. Physiol. 270, R365–R372 (1996).
- Guarente, L. Sirtuins: methods and protocols. In Methods in Molecular Biology Vol. 1077 (ed. Hirschey, M.D.) (Humana Press, 2013).
- Kanfi, Y. et al. Regulation of SIRT1 protein levels by nutrient availability. FEBS Lett. 582, 2417–2423 (2008). · DOI
- Kanfi, Y. et al. Regulation of SIRT6 protein levels by nutrient availability. FEBS Lett. 582, 543–548 (2008). · DOI
- Cohen, H. Y. Calorie restriction promotes mammalian cell survival by inducing the SIRT1 deacetylase. Science 305, 390–392 (2004). · DOI · Paper page
- Cheng, H.-L. et al. Developmental defects and p53 hyperacetylation in Sir2 homolog (SIRT1)-deficient mice. Proc. Natl Acad. Sci. USA 100, 10794–10799 (2003). · DOI · Paper page
- McBurney, M. W. et al. The mammalian SIR2 protein has a role in embryogenesis and gametogenesis. Mol. Cell. Biol. 23, 38–54 (2003). · DOI · Paper page
- Mostoslavsky, R. et al. Genomic instability and aging-like phenotype in the absence of mammalian SIRT6. Cell 124, 315–329 (2006). · DOI · Paper page
- Naiman, S. & Cohen, H. Y. Role for the longevity protein SIRT6 in primate development. Nature 560, 559–560 (2018). · DOI
- Satoh, A. et al. Sirt1 extends life span and delays aging in mice through the regulation of Nk2 homeobox 1 in the DMH and LH. Cell Metab. 18, 416–430 (2013). · DOI
- Roichman, A. et al. SIRT6 overexpression improves various aspects of mouse healthspan. J. Gerontol. Ser. A Biol. Sci. Med. Sci. 72, 603–615 (2017).
- Kugel, S. & Mostoslavsky, R. Chromatin and beyond: the multitasking roles for SIRT6. Trends Biochem. Sci. 39, 72–81 (2014). · DOI
- Zhong, L. et al. The histone deacetylase Sirt6 regulates glucose homeostasis via Hif1alpha. Cell 140, 280–293 (2010). · DOI · Paper page
- Kim, H. et al. Hepatic-specific disruption of SIRT6 in mice results in fatty liver formation due to enhanced glycolysis and triglyceride synthesis. Cell Metab. 12, 224–236 (2010). · DOI
- Naiman, S. et al. SIRT6 promotes hepatic beta-oxidation via activation of PPARα. Cell Rep. 29, 4127–4143.e8 (2019). · DOI
- Dominy, J. E. et al. The deacetylase Sirt6 activates the acetyltransferase GCN5 and suppresses hepatic gluconeogenesis. Mol. Cell 48, 900–913 (2012). · DOI
- Zhang, P. et al. Tumor suppressor p53 cooperates with SIRT6 to regulate gluconeogenesis by promoting FoxO1 nuclear exclusion. Proc. Natl Acad. Sci. USA 111, 10684–10689 (2014). · DOI
- Harris, T. B. et al. Changes in weight at the end of life: characterizing weight loss by time to death in a cohort study of older men. Am. J. Epidemiol. 172, 558–565 (2010). · DOI
- Guo, W., Li, M. & Bhasin, S. Testosterone supplementation improves anemia in aging male mice. J. Gerontol. Ser. A Biol. Sci. Med. Sci. 69A, 505–513 (2014). · DOI
- Goodnough, L. T. & Schrier, S. L. Evaluation and management of anemia in the elderly. Am. J. Hematol. 89, 88–96 (2014). · DOI
- López-Otín, C., Galluzzi, L., Freije, J. M. P., Madeo, F. & Kroemer, G. Metabolic control of longevity. Cell 166, 802–821 (2016). · DOI · Paper page
- Liu, H., Graber, T. G., Ferguson-Stegall, L. & Thompson, L. V. Clinically relevant frailty index for mice. J. Gerontol. Ser. A Biol. Sci. Med. Sci. 69, 1485–1491 (2014). · DOI
- Rui, L. Energy metabolism in the liver.Compr. Physiol. 4, 177–197 (2014). · DOI
- Rush, M. J. P. et al. Caloric restriction engages hepatic RNA processing mechanisms in rhesus monkeys. Cell Metab. 27, 677–688.e5 (2018). · DOI
- Tomaru, U. et al. Decreased proteasomal activity causes age-related phenotypes and promotes the development of metabolic abnormalities. Am. J. Pathol. 180, 963–972 (2012). · DOI · Paper page
- Nguyen, N. N. et al. Proteasome β5 subunit overexpression improves proteostasis during aging and extends lifespan in Drosophila melanogaster. Sci. Rep. 9, 3170 (2019). · DOI
- Iacobazzi, V. & Infantino, V. Citrate – new functions for an old metabolite. Biol. Chem. 395, 387–399 (2014). · DOI
- Honda, Y., Tanaka, M. & Honda, S. Trehalose extends longevity in the nematode Caenorhabditis elegans. Aging Cell 9, 558–569 (2010). · DOI
- Hui, S. et al. Glucose feeds the TCA cycle via circulating lactate. Nature 551, 115–118 (2017). · DOI · Paper page
- Williamson, D. H., Lund, P. & Krebs, H. A. The redox state of free nicotinamide-adenine dinucleotide in the cytoplasm and mitochondria of rat liver. Biochem. J. 103, 514–527 (1967). · DOI · Paper page
- Chen, X., Iqbal, N. & Boden, G. The effects of free fatty acids on gluconeogenesis and glycogenolysis in normal subjects. J. Clin. Invest. 103, 365–372 (1999). · DOI · Paper page
- Kirkwood, T. B. L. & Austad, S. N. Why do we age? Nature 408, 233–238 (2000). · DOI · Paper page
- Xiong, X. et al. Fabp4-Cre-mediated Sirt6 deletion impairs adipose tissue function and metabolic homeostasis in mice. J. Endocrinol. 233, 307–314 (2017). · DOI
- Kuang, J. et al. Fat-specific Sirt6 ablation sensitizes mice to high-fat diet-induced obesity and insulin resistance by inhibiting lipolysis. Diabetes 66, 1159–1171 (2017). · DOI
- Yao, L. et al. Cold-inducible SIRT6 regulates thermogenesis of brown and beige fat. Cell Rep. 20, 641–654 (2017). · DOI
- Hagopian, K. Caloric restriction increases gluconeogenic and transaminase enzyme activities in mouse liver. Exp. Gerontol. 38, 267–278 (2003). · DOI
- Selman, C. et al. Coordinated multitissue transcriptional and plasma metabonomic profiles following acute caloric restriction in mice. Physiol. Genomics 27, 187–200 (2006). · DOI
- Exton, J. H. Gluconeogenesis. Metabolism 21, 945–990 (1972). · DOI
- Brooks, G. A. The precious few grams of glucose during exercise. Int. J. Mol. Sci. 21, 1–19 (2020). · DOI
- Korol, D. L. & Gold, P. E. Glucose, memory, and aging. Am. J. Clin. Nutr. 67, 764S–771S (1998). · DOI
- Spindler, S. R. Calorie restriction enhances the expression of key metabolic enzymes associated with protein renewal during aging. Ann. NY Acad. Sci. 928, 296–304 (2006). · DOI
- Yuan, Y. et al. Enhanced energy metabolism contributes to the extended life span of calorie-restricted Caenorhabditis elegans. J. Biol. Chem. 287, 31414–31426 (2012). · DOI
- Yuan, Y. et al. Reciprocal changes in phosphoenolpyruvate carboxykinase and pyruvate kinase with age are a determinant of aging in Caenorhabditis elegans. J. Biol. Chem. 291, 1307–1319 (2016). · DOI
- Baker, E. J., Miles, E. A., Burdge, G. C., Yaqoob, P. & Calder, P. C. Metabolism and functional effects of plant-derived omega-3 fatty acids in humans. Prog. Lipid Res. 64, 30–56 (2016). · DOI
- Gubbels Bupp, M. R. Sex, the aging immune system, and chronic disease. Cell. Immunol. 294, 102–110 (2015). · DOI
- Fiehn, O. et al. Quality control for plant metabolomics: reporting MSI-compliant studies. Plant J. 53, 691–704 (2008). · DOI
- Dobin, A. et al. STAR: ultrafast universal RNA-seq aligner. Bioinformatics 29, 15–21 (2013). · DOI · Paper page
- Love, M. I., Huber, W. & Anders, S. Moderated estimation of fold change and dispersion for RNA-seq data with DESeq2. Genome Biol. 15, 550 (2014). · DOI · Paper page
- Krämer, A., Green, J., Pollard, J. & Tugendreich, S. Causal analysis approaches in Ingenuity Pathway Analysis. Bioinformatics 30, 523–530 (2014). · DOI · Paper page
- Mackay, G.M., Zheng, L., van den Broek, N.J.F. & Gottlieb, E. Analysis of cell metabolism using LC-MS and isotope tracers.Methods Enzymol. 561, 171–196 (2015). · DOI
- Wessel, D. & Flügge, U. I. A method for the quantitative recovery of protein in dilute solution in the presence of detergents and lipids. Anal. Biochem. 138, 141–143 (1984). · DOI
- Wang, Y. et al. Reversed-phase chromatography with multiple fraction concatenation strategy for proteome profiling of human MCF10A cells. Proteomics 11, 2019–2026 (2011). · DOI
- Keller, A., Nesvizhskii, A. I., Kolker, E. & Aebersold, R. Empirical statistical model to estimate the accuracy of peptide identifications made by MS/MS and database search. Anal. Chem. 74, 5383–5392 (2002). · DOI
- Nesvizhskii, A. I., Keller, A., Kolker, E. & Aebersold, R. A statistical model for identifying proteins by tandem mass spectrometry. Anal. Chem. 75, 4646–4658 (2003). · DOI
- Herbrich, S. M. et al. Statistical inference from multiple iTRAQ experiments without using common reference standards. J. Proteome Res. 12, 594–604 (2013). · DOI
- Kammers, K., Cole, R. N., Tiengwe, C. & Ruczinski, I. Detecting significant changes in protein abundance. EuPA Open Proteom. 7, 11–19 (2015). · DOI
- Hayter, A. J. The maximum familywise error rate of Fisher’s least significant difference test. J. Am. Stat. Assoc. 81, 1000–1004 (1986). · DOI
- Chong, J. et al. MetaboAnalyst 4.0: towards more transparent and integrative metabolomics analysis. Nucleic Acids Res. 46, W486–W494 (2018). · DOI
- Perez-Riverol, Y. et al. The PRIDE database and related tools and resources in 2019: improving support for quantification data. Nucleic Acids Res. 47, D442–D450 (2019). · DOI
Cited by
Sorted by citations
Hallmarks of aging: An expanding universe
López-Otín, C., Blasco, M. A., Partridge, L., Serrano, M., & Kroemer, G. (2023) · Cell · doi:10.1016/j.cell.2022.11.001 · Cited by 6,549
Self-citationAging conundrum: A perspective for ovarian aging
Wu, J., Liu, Y., Song, Y., Wang, L., Ai, J., & Li, K. (2022) · Frontiers in Endocrinology · doi:10.3389/fendo.2022.952471 · Cited by 73
Ali, M., Timsina, J., Western, D., Liu, M., Beric, A., Budde, J., Do, A., Heo, G., Wang, L., Gentsch, J., et al. (2025) · Neuron · doi:10.1016/j.neuron.2025.02.014 · Cited by 61
Wang, X., Li, X., Zhou, J., Lei, Z., & Yang, X. (2024) · Chemico-Biological Interactions · doi:10.1016/j.cbi.2024.110890 · Cited by 40
The Role of Sirtuins in Sarcopenia and Frailty
Anwar, M., Pradhan, R., Dey, S., & Kumar, R. (2023) · Aging and disease · doi:10.14336/ad.2022.0622 · Cited by 19
Metadata
- Authors
- Roichman, A., Elhanati, S., Aon, M. A., Abramovich, I., Di Francesco, A., Shahar, Y., Avivi, M. Y., Shurgi, M., Rubinstein, A., Wiesner, Y., Shuchami, A., Petrover, Z., Lebenthal-Loinger, I., Yaron, O., Lyashkov, A., Ubaida-Mohien, C., Kanfi, Y., Lerrer, B., Fernández-Marcos, P. J., Serrano, M., Gottlieb, E., de Cabo, R., & Cohen, H. Y.
- Venue
- Nature Communications
- Published
- 2021-05-28
- Volume
- 12
- Issue
- 1
- ISSN
- 2041-1723
- PMC
- PMC8163764
- Cited by
- 214
- References
- 20
- Language
- en
About these checks
Registry, retraction, Cites and statistics results are computed, not judged, with one exception: a printed reference that no index lists is read once by a model before it counts as a citation error. Claims are extracted by a model and kept only when their quote appears verbatim in the text; each cited source is then checked, with a model’s help, for whether it says what the claim relies on. Those verdicts can be wrong — read the claim’s quote and the cited source before relying on one.
Statistics and arithmetic are recomputed, not judged.
Confidence bands are shown only for fields calibrated on our annotated test set. None is calibrated yet, so no band is shown.
What counts as a claim ›How we measure confidence ›How we check this ›
Are you an author, or do you see a problem with this page? Request a review
