

The DOI matches its Crossref record; 43 of the 43 references it cites were found in a registry or an index.
iPLA2β-mediated lipid detoxification controls p53-driven ferroptosis independent of GPX4
Open accessAbstract
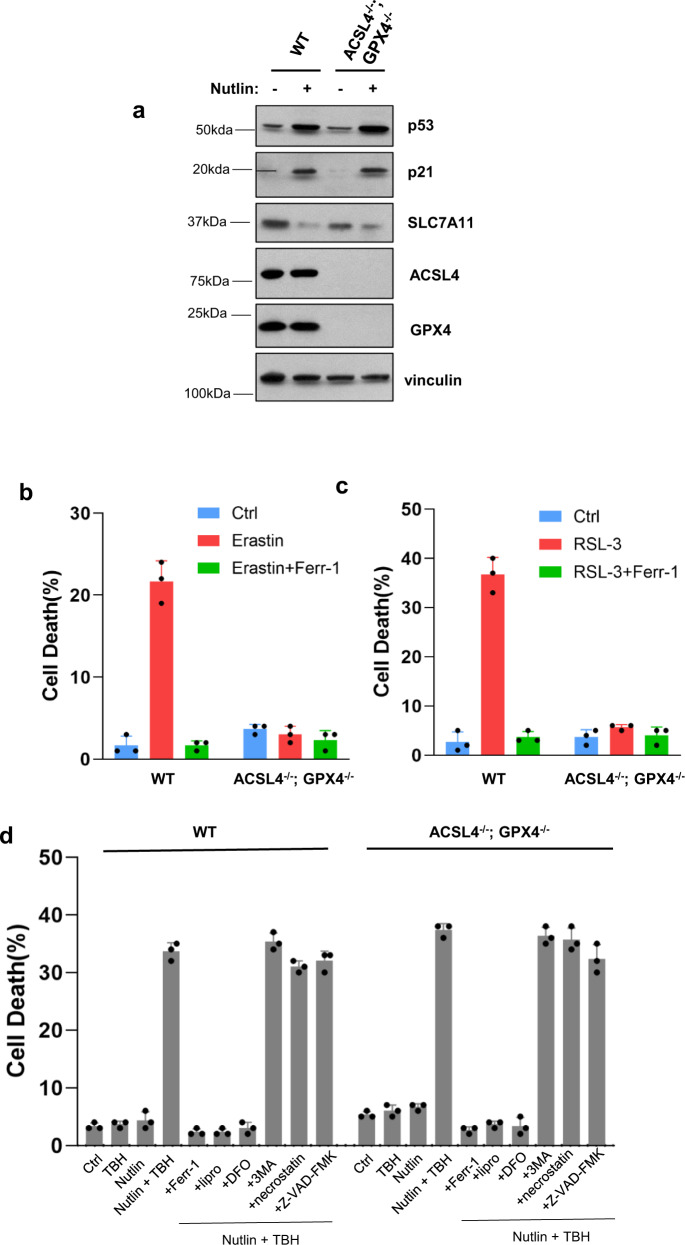
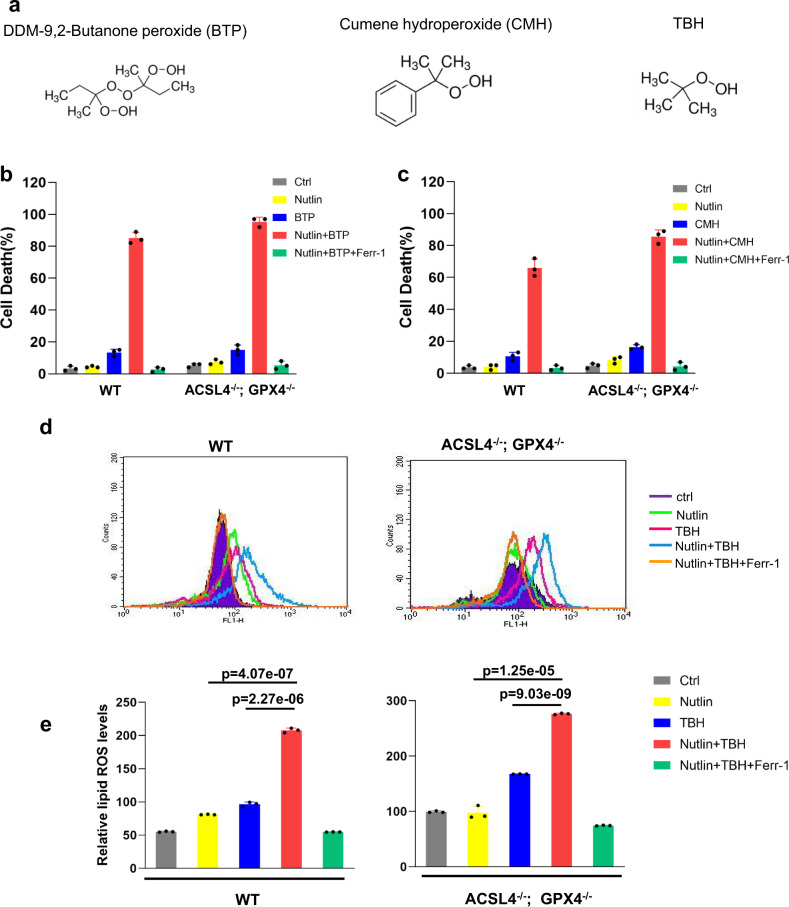
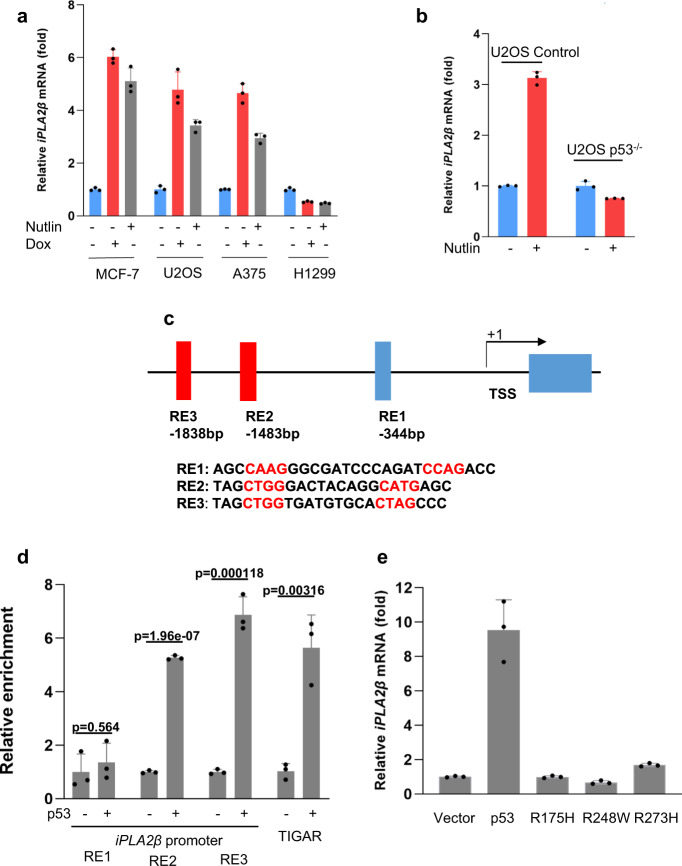
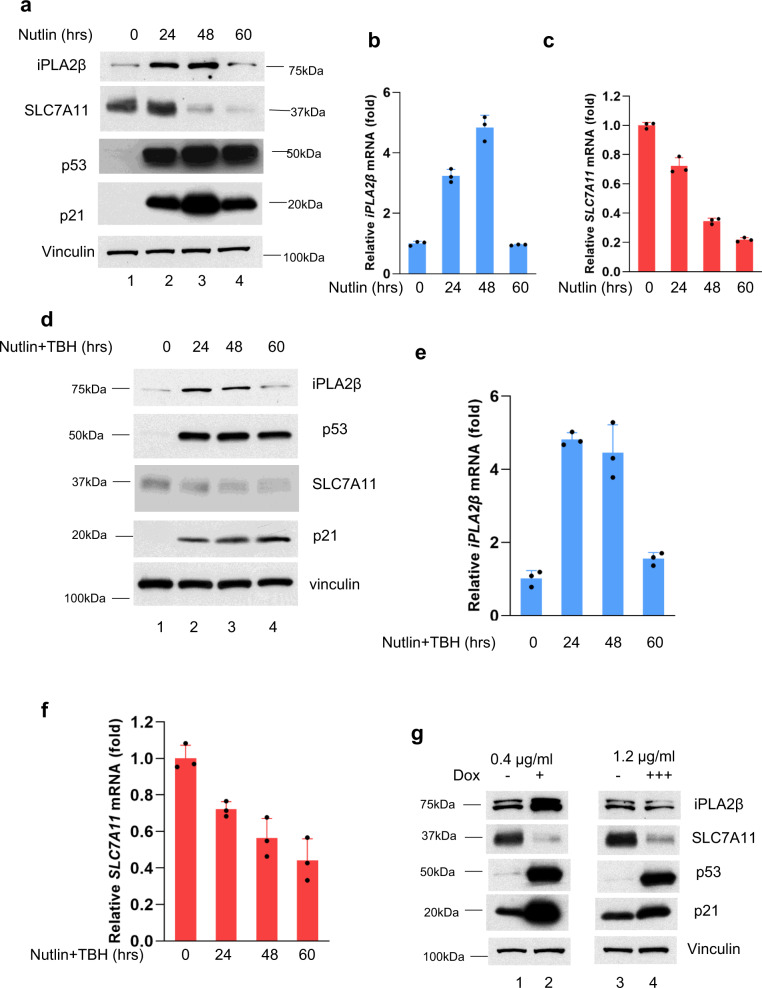
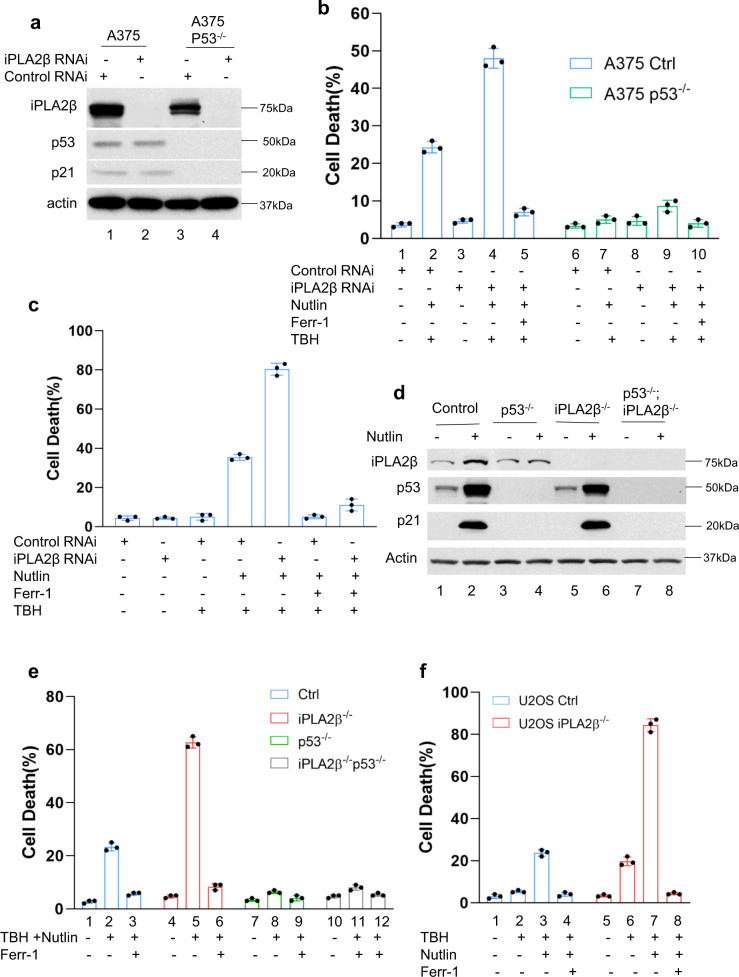
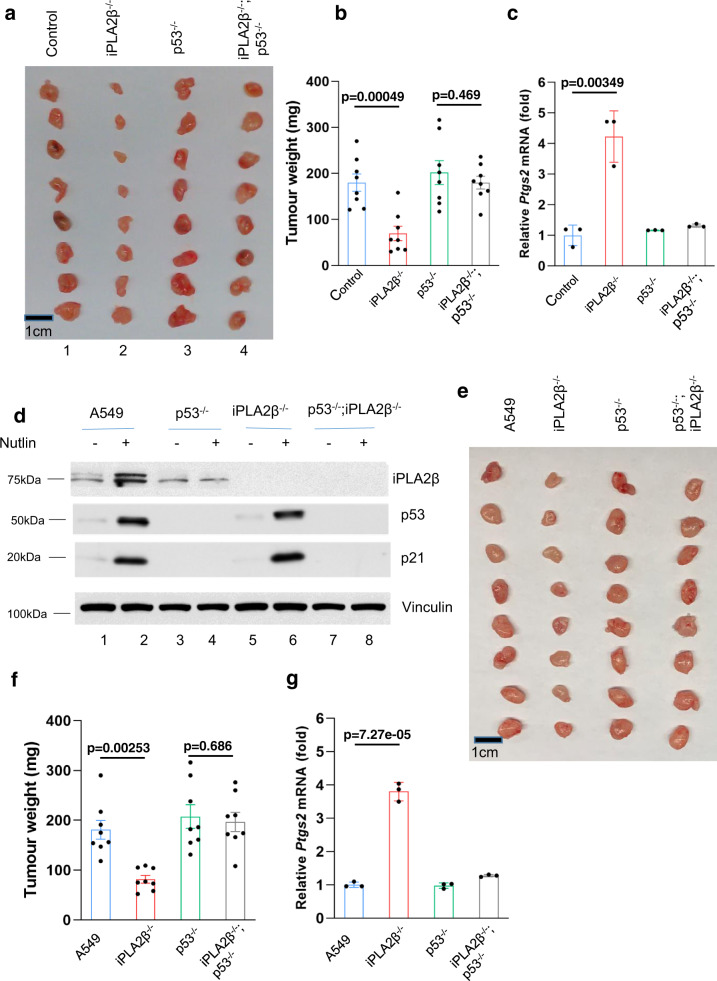
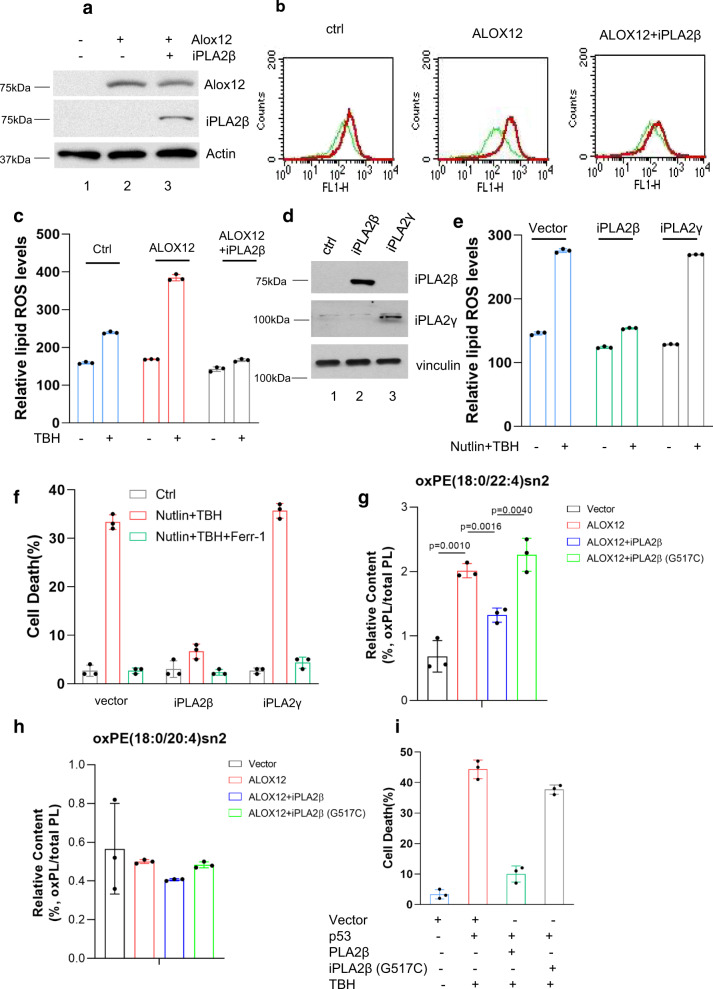
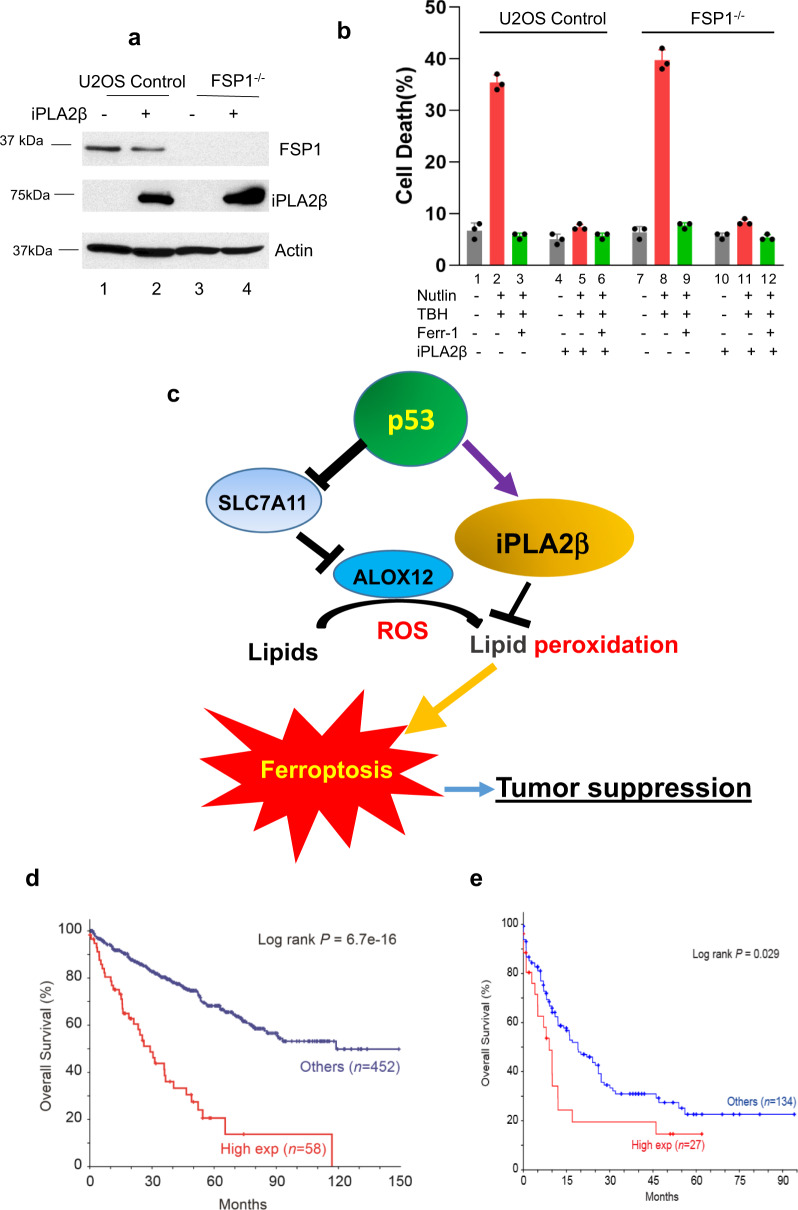
Here, we identify iPLA2β as a critical regulator for p53-driven ferroptosis upon reactive oxygen species (ROS)-induced stress. The calcium-independent phospholipase iPLA2β is known to cleave acyl tails from the glycerol backbone of lipids and release oxidized fatty acids from phospholipids. We found that iPLA2β-mediated detoxification of peroxidized lipids is sufficient to suppress p53-driven ferroptosis upon ROS-induced stress, even in GPX4-null cells. Moreover, iPLA2β is overexpressed in human cancers; inhibition of endogenous iPLA2β sensitizes tumor cells to p53-driven ferroptosis and promotes p53-dependent tumor suppression in xenograft mouse models. These results demonstrate that iPLA2β acts as a major ferroptosis repressor in a GPX4-independent manner. Notably, unlike GPX4, loss of iPLA2β has no obvious effect on normal development or cell viability in normal tissues but iPLA2β plays an essential role in regulating ferroptosis upon ROS-induced stress. Thus, our study suggests that iPLA2β is a promising therapeutic target for activating ferroptosis-mediated tumor suppression without serious toxicity concerns.
Overview
The claims and statistics of this paper haven’t been checked yet.
Run the check — free, no account needed. It reads the open-access text and checks the sources it cites.
Integrity signals
Registry
Cites
Statistics
Figures
Verification
Claims the paper makes
The claims and statistics of this paper haven’t been checked yet.
Run the check — free, no account needed. It reads the open-access text and checks the sources it cites.
Claims other papers make about this one
Each is checked against this paper’s own text: does it say what the citing paper says it does?
The source backs part of the claim, not all of it — or backs it for a different population, condition or comparison.
In the citing paper
“Each type of PLA2 has a substrate-specific activity, and depending on the substrate, PLA2 can either promote or block ferroptosis (28–31).”
From Secreted Apoe rewires melanoma cell state vulnerability to ferroptosis (2024) · cites this paper as [28]
Experimental — accuracy not yet measuredThe source backs part of the claim, not all of it — or backs it for a different population, condition or comparison.
In the citing paper
“In contrast, inhibition of the calcium-independent iPLA2β, which cleaves acyl tails from the glycerol backbone of lipids, fostered p53-driven ferroptosis and tumor suppression by depleting the pool of oxidized lipids in response to ROS-generating drugs (28).”
From Secreted Apoe rewires melanoma cell state vulnerability to ferroptosis (2024) · cites this paper as [28]
Experimental — accuracy not yet measured
Self-check
Percentages, sums and reported differences re-computed from the paper’s own numbers.
The self-check needs the paper’s full text.
Citations
Cites
Regulation of Ferroptotic Cancer Cell Death by GPX4
Yang, W. S., SriRamaratnam, R., Welsch, M. E., Shimada, K., Skouta, R., Viswanathan, V. S., Cheah, J. H., Clemons, P. A., Shamji, A. F., Clish, C. B., et al. (2014) · Cell · doi:10.1016/j.cell.2013.12.010 · Cited by 7,713
Self-citationACSL4 dictates ferroptosis sensitivity by shaping cellular lipid composition
Doll, S., Proneth, B., Tyurina, Y. Y., Panzilius, E., Kobayashi, S., Ingold, I., Irmler, M., Beckers, J., Aichler, M., Walch, A., et al. (2017) · Nature Chemical Biology · doi:10.1038/nchembio.2239 · Cited by 4,293
Inactivation of the ferroptosis regulator Gpx4 triggers acute renal failure in mice
Friedmann Angeli, J. P., Schneider, M., Proneth, B., Tyurina, Y. Y., Tyurin, V. A., Hammond, V. J., Herbach, N., Aichler, M., Walch, A., Eggenhofer, E., et al. (2014) · Nature Cell Biology · doi:10.1038/ncb3064 · Cited by 3,732
Self-citationFerroptosis: process and function
Xie, Y., Hou, W., Song, X., Yu, Y., Huang, J., Sun, X., Kang, R., & Tang, D. (2016) · Cell Death & Differentiation · doi:10.1038/cdd.2015.158 · Cited by 3,727
The CoQ oxidoreductase FSP1 acts parallel to GPX4 to inhibit ferroptosis
Bersuker, K., Hendricks, J. M., Li, Z., Magtanong, L., Ford, B., Tang, P. H., Roberts, M. A., Tong, B., Maimone, T. J., Zoncu, R., et al. (2019) · Nature · doi:10.1038/s41586-019-1705-2 · Cited by 3,703
Ferroptosis as a p53-mediated activity during tumour suppression
Jiang, L., Kon, N., Li, T., Wang, S.-J., Su, T., Hibshoosh, H., Baer, R., & Gu, W. (2015) · Nature · doi:10.1038/nature14344 · Cited by 3,398
Self-citationFSP1 is a glutathione-independent ferroptosis suppressor
Doll, S., Freitas, F. P., Shah, R., Aldrovandi, M., da Silva, M. C., Ingold, I., Goya Grocin, A., Xavier da Silva, T. N., Panzilius, E., Scheel, C. H., et al. (2019) · Nature · doi:10.1038/s41586-019-1707-0 · Cited by 3,341
Oxidized arachidonic and adrenic PEs navigate cells to ferroptosis
Kagan, V. E., Mao, G., Qu, F., Angeli, J. P. F., Doll, S., Croix, C. S., Dar, H. H., Liu, B., Tyurin, V. A., Ritov, V. B., et al. (2017) · Nature Chemical Biology · doi:10.1038/nchembio.2238 · Cited by 3,029
Self-citationTIGAR, a p53-Inducible Regulator of Glycolysis and Apoptosis
Bensaad, K., Tsuruta, A., Selak, M. A., Vidal, M. N. C., Nakano, K., Bartrons, R., Gottlieb, E., & Vousden, K. H. (2006) · Cell · doi:10.1016/j.cell.2006.05.036 · Cited by 2,019
Dependency of a therapy-resistant state of cancer cells on a lipid peroxidase pathway
Viswanathan, V. S., Ryan, M. J., Dhruv, H. D., Gill, S., Eichhoff, O. M., Seashore-Ludlow, B., Kaffenberger, S. D., Eaton, J. K., Shimada, K., Aguirre, A. J., et al. (2017) · Nature · doi:10.1038/nature23007 · Cited by 2,011
Self-citation
Cited by
Sorted by citations
Items 101–200 of 349
Melatonin and ferroptosis: Mechanisms and therapeutic implications
Zhang, D., Jia, X., Lin, D., & Ma, J. (2023) · Biochemical Pharmacology · doi:10.1016/j.bcp.2023.115909 · Cited by 39
mTORC1 beyond anabolic metabolism: Regulation of cell death
Zhu, J., Wang, H., & Jiang, X. (2022) · The Journal of Cell Biology · doi:10.1083/jcb.202208103 · Cited by 42
Self-citationPeroxiredoxin 6 suppresses ferroptosis in lung endothelial cells
Torres-Velarde, J. M., Allen, K. N., Salvador‐Pascual, A., Leija, R. G., Luong, D., Moreno-Santillán, D. D., Ensminger, D. C., & Vázquez‐Medina, J. P. (2024) · Free Radical Biology and Medicine · doi:10.1016/j.freeradbiomed.2024.04.208 · Cited by 44
Molecular Mechanisms of Ferroptosis and Updates of Ferroptosis Studies in Cancers and Leukemia
Akiyama, H., Carter, B. Z., Andreeff, M., & Ishizawa, J. (2023) · Cells · doi:10.3390/cells12081128 · Cited by 38
Paclitaxel Prodrug Enables Glutathione Depletion to Boost Cancer Treatment
Zhang, B., Zhou, S., Lu, S., Xiang, X., Yao, X., Lei, W., Pei, Q., Xie, Z., & Chen, X. (2024) · ACS Nano · doi:10.1021/acsnano.4c06399 · Cited by 37
The interplay of miRNAs and ferroptosis in diseases related to iron overload
Jin, S., Liu, P.-S., Zheng, D., & Xie, X. (2023) · APOPTOSIS · doi:10.1007/s10495-023-01890-w · Cited by 37
Zhou, D., Lu, P., Mo, X., Yang, B., Chen, T., Yao, Y., Xiong, T., Lin, Y., & Yang, X. (2024) · Frontiers in Endocrinology · doi:10.3389/fendo.2023.1248934 · Cited by 38
Self-citationProteomic analysis of ferroptosis pathways reveals a role of CEPT1 in suppressing ferroptosis
Liu, X., Chen, Z., Yan, Y., Zandkarimi, F., Nie, L., Li, Q., Horbath, A. D., Olszewski, K. L., Kondiparthi, L., Mao, C., et al. (2024) · Protein & Cell · doi:10.1093/procel/pwae004 · Cited by 38
Self-citationGAS41 modulates ferroptosis by anchoring NRF2 on chromatin
Wang, Z., Yang, X. P., Chen, D., Liu, Y., Li, Z., Duan, S., Zhang, Z., Jiang, X., Stockwell, B. R., & Gu, W. J. (2024) · Nature Communications · doi:10.1038/s41467-024-46857-w · Cited by 38
Self-citationFefelova, N., Wongjaikam, S., Pamarthi, S. H., Siri‐Angkul, N., Comollo, T. W., Kumari, A., Garg, V., Ivessa, A., Chattipakorn, S. C., Chattipakorn, N., et al. (2023) · Basic Research in Cardiology · doi:10.1007/s00395-023-00990-7 · Cited by 35
Ferroptosis: A mixed blessing for infectious diseases
Xiao, L.-Y., Huang, H., Fan, S., Zheng, B., Wu, J., Zhang, J., Pi, J., & Xu, J.-F. (2022) · Frontiers in Pharmacology · doi:10.3389/fphar.2022.992734 · Cited by 37
Pharmacological approaches for targeting lysosomes to induce ferroptotic cell death in cancer
Ji, F., Wang, Z.-X., Bin, J.-L., Chen, Y., Ma, J., Deng, J.-H., Huang, X., Zhou, J., & Lu, G. (2024) · Cancer Letters · doi:10.1016/j.canlet.2024.216728 · Cited by 38
A guide to ferroptosis in cancer
Yapici, F. I., Bebber, C. M., & von Karstedt, S. (2024) · Molecular Oncology · doi:10.1002/1878-0261.13649 · Cited by 35
Ferroptosis and its role in osteoarthritis: mechanisms, biomarkers, and therapeutic perspectives
Lu, S., Liu, Z., Qi, M., Wang, Y., Chang, L., Bai, X., Jiao, Y., Chen, X., & Zhen, J. (2024) · Frontiers in Cell and Developmental Biology · doi:10.3389/fcell.2024.1510390 · Cited by 33
Self-citationShin, D., Lee, J., & Roh, J. (2024) · Cancer Letters · doi:10.1016/j.canlet.2024.216645 · Cited by 33
The crosstalk between oncogenic signaling and ferroptosis in cancer
Pang, Q., Tang, Z., & Luo, L. (2024) · Critical Reviews in Oncology/Hematology · doi:10.1016/j.critrevonc.2024.104349 · Cited by 32
Ferroptosis: Redox Imbalance and Hematological Tumorigenesis
Lan, H., Gao, Y., Zhao, Z., Mei, Z., & Wang, F. (2022) · Frontiers in Oncology · doi:10.3389/fonc.2022.834681 · Cited by 34
Links between Vitamin K, Ferroptosis and SARS-CoV-2 Infection
Nuszkiewicz, J., Sutkowy, P., Wróblewski, M., Pawłowska, M., Wesołowski, R., Wróblewska, J., & Woźniak, A. (2023) · Antioxidants · doi:10.3390/antiox12030733 · Cited by 31
Ferroptosis: a potential bridge linking gut microbiota and chronic kidney disease
Mao, Z., Gao, Z., Pan, S.-K., Liu, D., Liu, Z., & Wu, P. (2024) · Cell Death Discovery · doi:10.1038/s41420-024-02000-8 · Cited by 30
Self-citationPhospholipase iPLA2β acts as a guardian against ferroptosis
Mao, C., Lei, G., Zhuang, L., & Gan, B. (2021) · 癌症:英文版 · doi:10.1002/cac2.12231 · Cited by 30
Nanomaterial‐Triggered Ferroptosis and Cuproptosis in Cancer Therapy
Sahoo, S. S., & Manna, D. (2025) · Small · doi:10.1002/smll.202412462 · Cited by 28
Epithelial-mesenchymal transition promotes metabolic reprogramming to suppress ferroptosis
Guo, W., Duan, Z., Wu, J., & Zhou, B. P. (2025) · Seminars in Cancer Biology · doi:10.1016/j.semcancer.2025.02.013 · Cited by 33
Harnessing Antioxidants in Cancer Therapy: Opportunities, Challenges, and Future Directions
Liu, Y., Wu, G., Feng, L., Li, J., Xia, Y., Guo, W., & Zhao, K. (2025) · Antioxidants · doi:10.3390/antiox14060674 · Cited by 32
Ferroptosis in Chronic Liver Diseases: Opportunities and Challenges
Zhou, G., Fu, Y., Liu, W., Mu, Y., Zhang, H., Chen, J., & Liu, P. (2022) · Frontiers in Molecular Biosciences · doi:10.3389/fmolb.2022.928321 · Cited by 29
Emerging field: O-GlcNAcylation in ferroptosis
Zhang, H., Zhang, J., Dong, H., Kong, Y., & Guan, Y. (2023) · Frontiers in Molecular Biosciences · doi:10.3389/fmolb.2023.1203269 · Cited by 27
Targeting ferroptosis regulators by natural products in colorectal cancer
Zhang, Y., & Xie, J. (2024) · Frontiers in Pharmacology · doi:10.3389/fphar.2024.1374722 · Cited by 27
Ferroptosis-associated genes and compounds in renal cell carcinoma
He, C., Li, Q., Wu, W., Liu, K., Li, X., Zheng, H., & Lai, Y. (2024) · Frontiers in Immunology · doi:10.3389/fimmu.2024.1473203 · Cited by 29
Lipid metabolism in ferroptosis: Unraveling key mechanisms and therapeutic potential in cancer
Lee, J., & Roh, J. (2024) · Biochimica et Biophysica Acta (BBA) - Reviews on Cancer · doi:10.1016/j.bbcan.2024.189258 · Cited by 29
Emerging insights into the role of ferroptosis in the pathogenesis of autoimmune diseases
Fan, J., Jiang, T., & He, D. (2023) · Frontiers in Immunology · doi:10.3389/fimmu.2023.1120519 · Cited by 27
Excessive Lipid Peroxidation in Uterine Epithelium Causes Implantation Failure and Pregnancy Loss
Lu, Y., Shao, Y., Cui, W., Jia, Z., Zhang, Q., Zhao, Q., Chen, Z., Yan, J., Chu, B., & Yuan, J. (2023) · Advanced Science · doi:10.1002/advs.202302887 · Cited by 29
Self-citationLei, Y., Yf, W., Xiao, J., Shen, Q., Chi, S., Gao, Y., Lin, D., Ding, J., Fang, Y.-F., & Chen, Y. (2023) · Acta Pharmacologica Sinica · doi:10.1038/s41401-023-01097-4 · Cited by 26
The Emerging Role of Ferroptosis in Sepsis, Opportunity or Challenge?
Huang, Q., Ding, Y., Fang, C., Wang, H., & Kong, L. (2023) · Infection and Drug Resistance · doi:10.2147/idr.s419993 · Cited by 28
Wang, S., Wang, R., Hu, D., Zhang, C.-X., Cao, P., Huang, J., & Wang, B. (2024) · Cancer Cell International · doi:10.1186/s12935-024-03391-5 · Cited by 28
An update on the role of ferroptosis in ischemic stroke: from molecular pathways to Neuroprotection
Gowtham, A., Chauhan, C., Rahi, V., & Kaundal, R. K. (2024) · Expert Opinion on Therapeutic Targets · doi:10.1080/14728222.2024.2446319 · Cited by 27
Terahertz Wave Desensitizes Ferroptosis by Inhibiting the Binding of Ferric Ions to the Transferrin
Li, X., Li, Y., Xu, J., Lu, X., Ma, S., Sun, L., Chang, C., Min, L., & Fan, C. (2025) · ACS Nano · doi:10.1021/acsnano.4c13075 · Cited by 27
Hu, Y., Li, Z., Li, M., Wu, X., Zhang, S., Tang, M., Yu, R., Yang, M., Chen, X., Song, L., et al. (2025) · Molecular Cell · doi:10.1016/j.molcel.2025.11.023 · Cited by 31
The roles of sirtuins in ferroptosis
Zeng, J., Guo, J., Huang, S., Cheng, Y., Luo, F., Xu, X., Chen, R., Ma, G., & Wang, Y. (2023) · Frontiers in Physiology · doi:10.3389/fphys.2023.1131201 · Cited by 29
Secreted Apoe rewires melanoma cell state vulnerability to ferroptosis
More, S., Bonnereau, J., Wouters, D., Spotbeen, X., Karras, P., Rizzollo, F., Killian, T., Venken, T., Naulaerts, S., Vervoort, E., et al. (2024) · Science Advances · doi:10.1126/sciadv.adp6164 · Cited by 25
Self-citationIron metabolism and ferroptosis in nonalcoholic fatty liver disease: what is our next step?
Shen, X., Yu, Z., Wei, C., Hu, C., & Chen, J. (2024) · American Journal of Physiology-Endocrinology and Metabolism · doi:10.1152/ajpendo.00260.2023 · Cited by 28
Kessel, A. T. M. V., Karimi, R., & Cosa, G. (2022) · Chemical Science · doi:10.1039/d2sc00525e · Cited by 27
Perspectives and mechanisms for targeting ferroptosis in the treatment of hepatocellular carcinoma
Li, L., Wang, X., Xu, H., Liu, X., & Xu, K. (2022) · Frontiers in Molecular Biosciences · doi:10.3389/fmolb.2022.947208 · Cited by 25
Shi, J., Liu, Y., Wang, Y., Gao, R., Wang, Y., & Liu, J. (2023) · Frontiers in Pharmacology · doi:10.3389/fphar.2023.1194343 · Cited by 26
Adverse effects of ferroptotic therapy: mechanisms and management
Liu, J., Kang, R., & Tang, D. (2024) · Trends in cancer · doi:10.1016/j.trecan.2024.01.002 · Cited by 25
Zhao, J., Wang, Q., Liu, Z., Zhang, M., Li, J., Fu, Z. F., Zhao, L., & Zhou, M. (2024) · Journal of Biological Chemistry · doi:10.1016/j.jbc.2024.107168 · Cited by 24
Self-citationMurakami, M., Takamiya, R., Miki, Y., Sugimoto, N., Nagasaki, Y., Suzuki-Yamamoto, T., & Taketomi, Y. (2022) · Biochemical Pharmacology · doi:10.1016/j.bcp.2022.115176 · Cited by 26
Gong, Y., Luo, G., Zhang, S., Chen, Y., & Hu, Y. (2024) · Cellular Signalling · doi:10.1016/j.cellsig.2024.111068 · Cited by 24
Wu, T., Ji, M., Li, T. X., & Luo, L. (2024) · Journal of Pharmaceutical Analysis · doi:10.1016/j.jpha.2024.101050 · Cited by 26
Multifaceted interplays between the essential players and lipid peroxidation in ferroptosis
Liu, C., Liu, Z., Dong, Z., Liu, S., Kan, H., & Zhang, S. (2025) · Journal of genetics and genomics/Journal of Genetics and Genomics · doi:10.1016/j.jgg.2025.01.009 · Cited by 25
Self-citationThe mist of ferroptosis: The Orpheus journey of mitochondria - Exploring the symphony of cell fate
Jiang, Y., Liu, X., & Sun, M. (2025) · International Journal of Biological Macromolecules · doi:10.1016/j.ijbiomac.2025.145472 · Cited by 27
Roggero, A., Toyama, M. H., & Sousa, S. F. (2025) · ACS Pharmacology & Translational Science · doi:10.1021/acsptsci.5c00482 · Cited by 27
p53-Dependent ferroptosis pathways in sepsis
Gao, N., Tang, A.-L., Liu, X., Chen, J., & Zhang, G. (2023) · International Immunopharmacology · doi:10.1016/j.intimp.2023.110083 · Cited by 25
Molecular mechanism of ferroptosis and its role in the occurrence and treatment of diabetes
Du, G.-H., Zhang, Q., Huang, X., & Wang, Y. (2022) · Frontiers in Genetics · doi:10.3389/fgene.2022.1018829 · Cited by 22
Marine Alkaloid Lepadins E and H Induce Ferroptosis for Cancer Chemotherapy
Wang, W., Ma, F., Cheung, Y. T., Zeng, G., Zhou, Y., Chen, Z., Liang, L., Luo, T., & Tong, R. (2023) · Journal of Medicinal Chemistry · doi:10.1021/acs.jmedchem.3c00659 · Cited by 23
Zhang, L., Hou, N., Chen, B., Kan, C., Han, F., Zhang, J., & Sun, X. (2022) · Frontiers in Pharmacology · doi:10.3389/fphar.2022.908772 · Cited by 21
Lee, J., & Roh, J. (2023) · Cellular Oncology · doi:10.1007/s13402-023-00840-7 · Cited by 21
Ferroptosis, a subtle talk between immune system and cancer cells: To be or not to be?
Zhou, Q., Tao, C., Yuan, J., Pan, F., & Wang, R. (2023) · Biomedicine & Pharmacotherapy · doi:10.1016/j.biopha.2023.115251 · Cited by 21
Peng, X., Hou, L., Wu, X. F., Liu, Z., Wang, Y., Zeng, P., Yang, Y., Ma, W., & Yang, P. (2023) · Journal of Molecular Medicine · doi:10.1007/s00109-023-02361-0 · Cited by 22
Self-citationNi, X., Ye, C., Xi, Y., Zhang, Y., Hou, Y., Zheng, Q., Chen, Z., Wang, L., Weng, X., Yang, C., et al. (2023) · European Journal of Pharmacology · doi:10.1016/j.ejphar.2023.176110 · Cited by 23
P53 together with ferroptosis: a promising strategy leaving cancer cells without escape
Zhan, J., Wang, J., Liang, Y., Zeng, X., Li, E., & Wang, H. (2023) · Acta Biochimica et Biophysica Sinica · doi:10.3724/abbs.2023270 · Cited by 22
Cell Death in Crustacean Immune Defense
Chen, Z., Tayyab, M., Yao, D., Aweya, J. J., Zheng, Z., Zhao, X., Lin, Z., & Zhang, Y. (2024) · Reviews in Aquaculture · doi:10.1111/raq.12976 · Cited by 20
Regulatory mechanism and research progress of ferroptosis in obstetrical and gynecological diseases
Wang, X., Wei, Y., Wei, F., & Kuang, H. (2023) · Frontiers in Cell and Developmental Biology · doi:10.3389/fcell.2023.1146971 · Cited by 23
Lu, L., Jifu, C., Xia, J., & Wang, J. (2024) · Biomedicine & Pharmacotherapy · doi:10.1016/j.biopha.2024.116753 · Cited by 26
Molecular and therapeutic landscape of ferroptosis in skin diseases
Le, J., Meng, Y., Wang, Y., Li, D., Zeng, F., Xiong, Y., Chen, X., & Deng, G. (2024) · Chinese Medical Journal · doi:10.1097/cm9.0000000000003164 · Cited by 20
What Is the Role of Ferroptosis in Neurodegeneration?
Benarroch, E. E. (2023) · Neurology · doi:10.1212/wnl.0000000000207730 · Cited by 26
Lipid-derived electrophiles inhibit the function of membrane channels during ferroptosis
Kessel, A. T. M. V., & Cosa, G. (2024) · Proceedings of the National Academy of Sciences · doi:10.1073/pnas.2317616121 · Cited by 21
Bypassing the guardian: regulated cell death pathways in p53-mutant cancers
Chung, J., & Knutson, B. A. (2025) · Cellular & Molecular Biology Letters · doi:10.1186/s11658-025-00751-5 · Cited by 22
Ferroptosis: biology and role in liver disease
Hino, K., Nishina, S., & Yanatori, I. (2025) · Journal of Gastroenterology · doi:10.1007/s00535-025-02300-5 · Cited by 21
Ferroptosis in lymphoma: Emerging mechanisms and a novel therapeutic approach
Zhou, Q., Li, T., Qin, Q., Huang, X., & Wang, Y. (2022) · Frontiers in Genetics · doi:10.3389/fgene.2022.1039951 · Cited by 21
Wild-type and mutant p53 in cancer-related ferroptosis. A matter of stress management?
Corazzari, M., & Collavin, L. (2023) · Frontiers in Genetics · doi:10.3389/fgene.2023.1148192 · Cited by 21
Zhou, X.-N., Zhang, Q., Peng, H., Qin, Y.-J., Liu, Y., Wang, L., Cheng, M., Luo, X., & Li, H. (2024) · World Journal of Gastroenterology · doi:10.3748/wjg.v30.i11.1588 · Cited by 19
Targeting ferroptosis as a potential prevention and treatment strategy for aging-related diseases
Jiao, T., Chen, Y., Sun, H., & Yang, L. (2024) · Pharmacological Research · doi:10.1016/j.phrs.2024.107370 · Cited by 20
Liu, Y., Tang, Q., Tao, Q., Dong, H., Shi, Z., & Zhou, L. (2025) · Journal of Advanced Research · doi:10.1016/j.jare.2024.03.024 · Cited by 18
The role of peroxiredoxin 6 in biosynthesis of FAHFAs
Paluchová, V., Čajka, T., Durand, T., Vigor, C., Dodia, C., Chatterjee, S., Fisher, A. B., & Kuda, O. (2022) · Free Radical Biology and Medicine · doi:10.1016/j.freeradbiomed.2022.11.015 · Cited by 18
Hayashi, D., & Dennis, E. A. (2023) · Pharmacology & Therapeutics · doi:10.1016/j.pharmthera.2023.108395 · Cited by 19
Exploiting Mass Spectrometry to Unlock the Mechanism of Nanoparticle-Induced Inflammasome Activation
Gupta, G. S., Kaur, J., Bhattacharya, K., Chambers, B. J., Gazzi, A., Furesi, G., Rauner, M., Fuoco, C., Orecchioni, M., Delogu, L. G., et al. (2023) · ACS Nano · doi:10.1021/acsnano.3c05600 · Cited by 17
Ferroptosis: potential targets and emerging roles in pancreatic diseases
Huang, Z., Ma, Y., Sun, Z., Cheng, L., & Wang, G. (2023) · Archives of Toxicology · doi:10.1007/s00204-023-03625-x · Cited by 19
Sterols in ferroptosis: from molecular mechanisms to therapeutic strategies
Li, Y., Li, Z., Qiao, R., & Wang, P. (2024) · Trends in Molecular Medicine · doi:10.1016/j.molmed.2024.08.007 · Cited by 23
Su, X., Liang, F., Zeng, Y., Yang, Z., Deng, Y., Xu, Y., & Cai, X. (2024) · Biomolecules · doi:10.3390/biom14070879 · Cited by 21
Wang, Y., Hao, S., Miao, Q., Wang, Y., Qi, J., Xu, X., & Sun, J. (2022) · Frontiers in Oncology · doi:10.3389/fonc.2022.819235 · Cited by 18
Ferroptosis and its emerging role in esophageal cancer
Maimaitizunong, R., Wang, K., & Li, H. (2022) · Frontiers in Molecular Biosciences · doi:10.3389/fmolb.2022.1027912 · Cited by 18
Natural compounds efficacy in complicated diabetes: A new twist impacting ferroptosis
Bao, T., Zhang, X., Xie, W., Wang, Y., Li, X., Tang, C., Yang, Y., Sun, J., Gao, J., Yu, T., et al. (2023) · Biomedicine & Pharmacotherapy · doi:10.1016/j.biopha.2023.115544 · Cited by 18
Half is enough: Oxidized lysophospholipids as novel bioactive molecules
Petan, T., & Manček‐Keber, M. (2022) · Free Radical Biology and Medicine · doi:10.1016/j.freeradbiomed.2022.06.228 · Cited by 20
Ironing out the details: ferroptosis and its relevance to diabetic cardiomyopathy
Gawargi, F. I., & Mishra, P. K. (2023) · American Journal of Physiology-Regulatory, Integrative and Comparative Physiology · doi:10.1152/ajpregu.00117.2023 · Cited by 18
Preparation of Iron-Based Sulfides and Their Applications in Biomedical Fields
Duan, Y., & Sun, J. (2023) · Biomimetics · doi:10.3390/biomimetics8020177 · Cited by 17
Unveiling the role of iPLA2β in neurodegeneration: From molecular mechanisms to advanced therapies
Liu, J., Tan, J., Tang, B., & Guo, J. (2024) · Pharmacological Research · doi:10.1016/j.phrs.2024.107114 · Cited by 18
Vermonden, P., Martin, M., Glowacka, K., Neefs, I., Ecker, J., Höring, M., Liebisch, G., Debier, C., Féron, O., & Larondelle, Y. (2024) · iScience · doi:10.1016/j.isci.2024.109774 · Cited by 17
Lagal, D. J., Ortiz-Alcántara, Á., Pedrajas, J. R., McDonagh, B., Bárcena, J. A., Requejo-Aguilar, R., & Padilla, C. A. (2024) · Biochemical Journal · doi:10.1042/bcj20240445 · Cited by 16
Neuronal Injury after Ischemic Stroke: Mechanisms of Crosstalk Involving Necroptosis
Zhang, X. Y., Li, H., Zhao, Y., Zhao, T., Wang, Z., & Tang, Q. (2025) · Journal of Molecular Neuroscience · doi:10.1007/s12031-025-02313-y · Cited by 19
Zhang, F., Yan, Y., Cai, Y., Liang, Q., Liu, Y., Peng, B., Xu, Z., & Liu, W. (2023) · Frontiers in Cell and Developmental Biology · doi:10.3389/fcell.2023.1112751 · Cited by 16
Zhou, S., Wang, Z., Wang, T., Peng, C., Zhang, J., Liu, C., Xu, J., Zhang, Y., Zhang, L., Luo, L., et al. (2024) · Phytomedicine · doi:10.1016/j.phymed.2024.155622 · Cited by 15
Exploring therapeutic strategies for infantile neuronal axonal dystrophy (INAD/PARK14)
Lin, G., Tepe, B., McGrane, G., Tipon, R. C., Croft, G. F., Panwala, L., Hope, A., Liang, A. J., Zuo, Z., Byeon, S. K., et al. (2023) · eLife · doi:10.7554/elife.82555 · Cited by 16
Cho, S., Tam, E., Nguyen, K. D., Lei, Y., Fillebeen, C., Pantopoulos, K., Sung, H. K., & Sweeney, G. (2025) · APOPTOSIS · doi:10.1007/s10495-025-02121-0 · Cited by 20
Hao, D., Liu, L., Tu, X., Zhang, X., Li, J., Xu, W., Wang, D., & Li, P. (2025) · Food Chemistry · doi:10.1016/j.foodchem.2025.145439 · Cited by 14
Intersection of ferroptosis and nanomaterials brings benefits to breast cancer
Gao, J., Ma, N., Ni, S., & Han, X. F. (2025) · Cell Biology and Toxicology · doi:10.1007/s10565-025-10067-x · Cited by 17
Ferroptosis: A New Pathway in the Interaction between Gut Microbiota and Multiple Sclerosis
Jian, J., & Wei, J. (2025) · Frontiers in Bioscience-Landmark · doi:10.31083/fbl26265 · Cited by 14
A Panoramic View of Ferroptosis in Cardiovascular Disease
Cheng, X., Yu, C., Yang, X., Wang, F., & Min, J. (2023) · Kidney Diseases · doi:10.1159/000530046 · Cited by 14
Self-citationFan, X.-R., Huang, Y., Su, Y., Chen, S., Zhang, Y., Huang, W.-K., & Wang, H. (2023) · World Journal of Gastroenterology · doi:10.3748/wjg.v29.i30.4642 · Cited by 14
The PNPLA family of enzymes: characterisation and biological role
Lulić, A.-M., & Katalinić, M. (2023) · Archives of Industrial Hygiene and Toxicology · doi:10.2478/aiht-2023-74-3723 · Cited by 14
Cao, Y., Song, N., Wang, Y., Leng, X., Wang, Q., Ma, Y., Chen, S., Ju, X., & Jia, L. (2024) · Combinatorial Chemistry & High Throughput Screening · doi:10.2174/0113862073271348231213071225 · Cited by 13
Research progress of ferroptosis and inflammatory bowel disease
Ma, B., Hu, X., Ai, X., & Zhang, Y. (2024) · BioMetals · doi:10.1007/s10534-024-00604-2 · Cited by 14
Metadata
- Authors
- Chen, D., Chu, B., Yang, X., Liu, Z., Jin, Y., Kon, N., Rabadan, R., Jiang, X., Stockwell, B. R., & Gu, W.
- Affiliations
- Herbert Irving Comprehensive Cancer Center (US)
- Columbia University (US)
- Memorial Sloan Kettering Cancer Center (US)
- Corresponding author
- Gu, Wei
- ORCID
- Venue
- Nature Communications
- Published
- 2021-06-15
- Volume
- 12
- Issue
- 1
- Pages
- 3644-3644
- ISSN
- 2041-1723 (ISSN-L)
- PMC
- PMC8206155
- OpenAlex
- W3168103972
- Cited by
- 348
- References
- 43
- Citations by year
- 2026: 51 · 2025: 72 · 2024: 88 · 2023: 86 · 2022: 40 · 2021: 10
- FWCI
- 36.53
- Type
- journal article
- Language
- en
- Open access
- gold
- doi.org
- Locations
- Nature Communications (publishedVersion, cc-by)
- PubMed Central (publishedVersion, cc-by)
- PubMed (publishedVersion)
- RePEc: Research Papers in Economics (submittedVersion)
- DOAJ (DOAJ: Directory of Open Access Journals) (submittedVersion, cc-by-sa)
- Funders
- U.S. Department of Health & Human Services | NIH | National Cancer Institute (5R01CA216884, 5R01CA085533, 5R01CA254970, 5RO1CA224272)
- Topics
- Life Sciences › Biochemistry, Genetics and Molecular Biology › Cancer Research › Ferroptosis and cancer prognosis
- Life Sciences › Biochemistry, Genetics and Molecular Biology › Cancer Research › Cancer, Lipids, and Metabolism
- Health Sciences › Medicine › Hematology › Iron Metabolism and Disorders
- Keywords
- iPLA2β, phospholipase A2, ferroptosis, p53, lipid peroxidation, reactive oxygen species, tumor suppression, cancer therapy targets
- MeSH terms
- A549 Cells, Ferroptosis, Phospholipid Hydroperoxide Glutathione Peroxidase, Animals, Cell Survival, Disease Models, Animal, Fatty Acids, Female, Humans, Mice, Nude, Phospholipids, Tumor Suppressor Protein p53, Reactive Oxygen Species, Xenograft Model Antitumor Assays, Cell Line, Tumor, Mice, Group VI Phospholipases A2
About these checks
Registry, retraction, Cites and statistics results are computed, not judged, with one exception: a printed reference that no index lists is read once by a model before it counts as a citation error. Claims are extracted by a model and kept only when their quote appears verbatim in the text; each cited source is then checked, with a model’s help, for whether it says what the claim relies on. Those verdicts can be wrong — read the claim’s quote and the cited source before relying on one.
Statistics and arithmetic are recomputed, not judged.
Confidence bands are shown only for fields calibrated on our annotated test set. None is calibrated yet, so no band is shown.
What counts as a claim ›How we measure confidence ›How we check this ›
Are you an author, or do you see a problem with this page? Request a review
