

The DOI matches its Crossref record; 52 of the 55 references it cites were found in a registry or an index.
Development of a BCL-xL and BCL-2 dual degrader with improved anti-leukemic activity,
Open accessAbstract
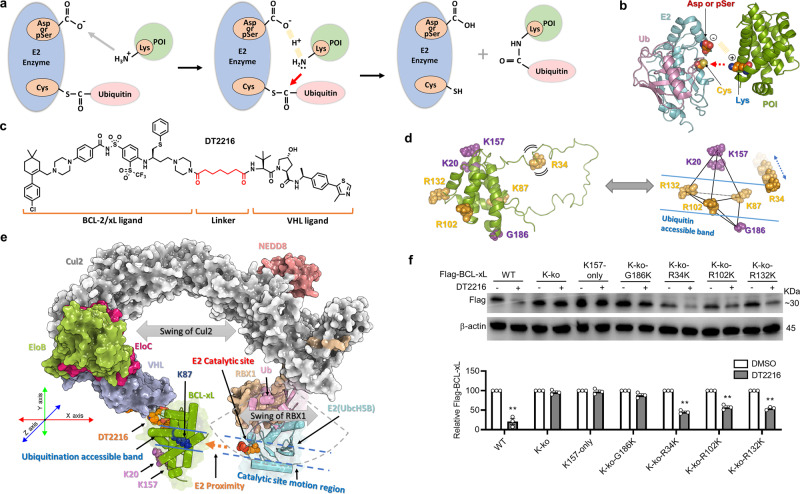
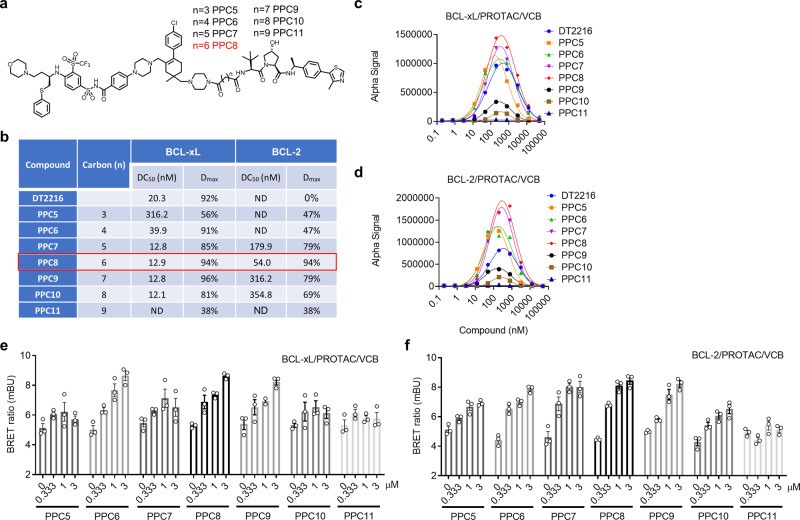
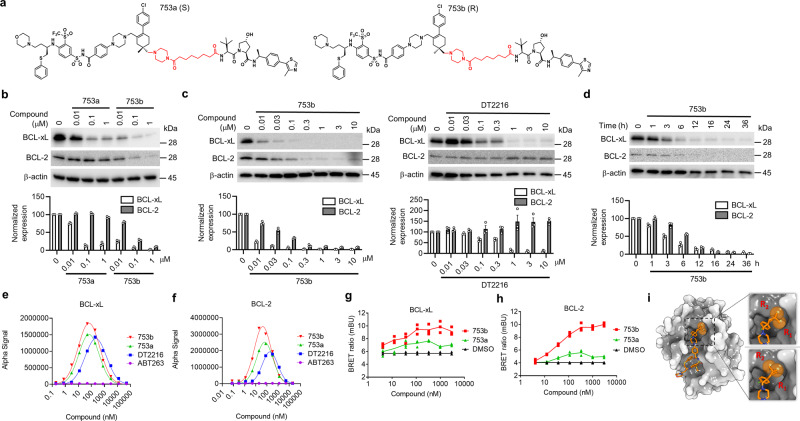
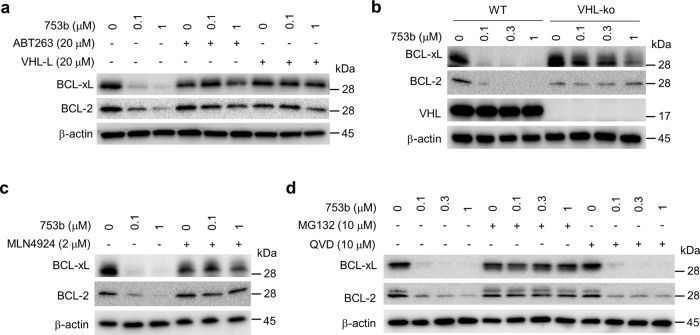
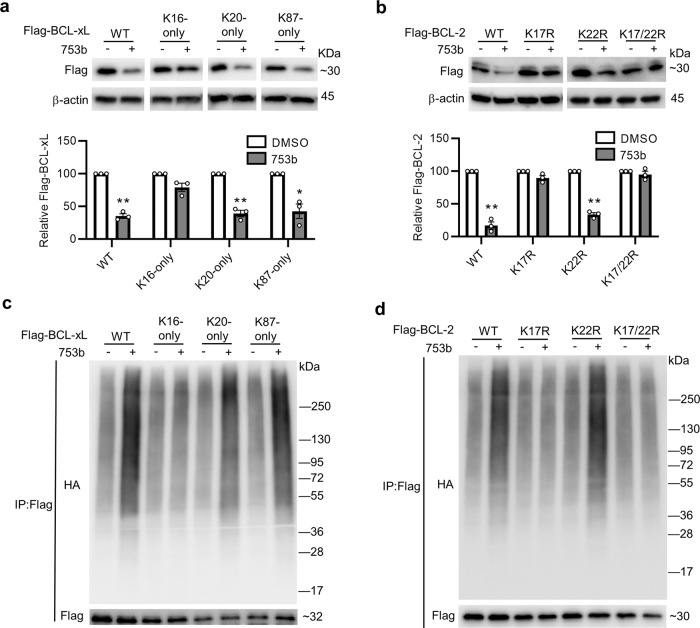
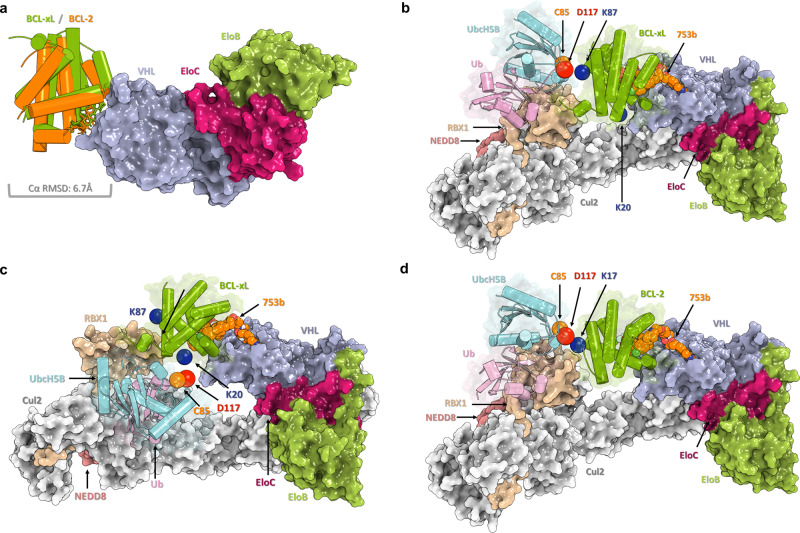
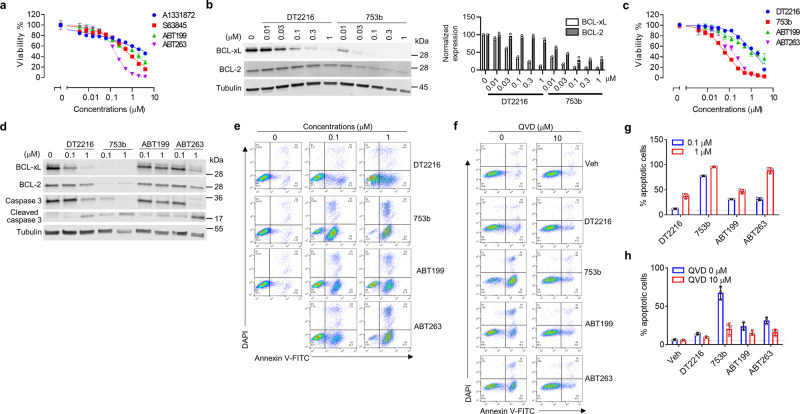
PROteolysis-TArgeting Chimeras (PROTACs) have emerged as an innovative drug development platform. However, most PROTACs have been generated empirically because many determinants of PROTAC specificity and activity remain elusive. Through computational modelling of the entire NEDD8-VHL Cullin RING E3 ubiquitin ligase (CRL VHL )/PROTAC/BCL-xL/UbcH5B(E2)-Ub/RBX1 complex, we find that this complex can only ubiquitinate the lysines in a defined band region on BCL-xL. Using this approach to guide our development of a series of ABT263-derived and VHL-recruiting PROTACs, we generate a potent BCL-xL and BCL-2 (BCL-xL/2) dual degrader with significantly improved antitumor activity against BCL-xL/2-dependent leukemia cells. Our results provide experimental evidence that the accessibility of lysines on a target protein plays an important role in determining the selectivity and potency of a PROTAC in inducing protein degradation, which may serve as a conceptual framework to guide the future development of PROTACs.
Overview
The claims and statistics of this paper haven’t been checked yet.
Run the check — free, no account needed. It reads the open-access text and checks the sources it cites.
Integrity signals
Registry
Cites
Statistics
Figures
Verification
Claims the paper makes
The claims and statistics of this paper haven’t been checked yet.
Run the check — free, no account needed. It reads the open-access text and checks the sources it cites.
Claims other papers make about this one
Each is checked against this paper’s own text: does it say what the citing paper says it does?
In the citing paper
“Finally, 753b (203) displayed high selectivity for cancer cells over normal platelets and a lower toxicity profile, making it a promising candidate for future cancer therapy (Table 4).495”
From Recent advances in targeting the “undruggable” proteins: from drug discovery to clinical trials (2023) · cites this paper as [495]
In the citing paper
“Moreover, some recent studies have shown that only the ternary complex models with optimal target-lysine accessibility for the E2 could predict target degradation outcomes.[181][182][183]”
From Chasing molecular glue degraders: screening approaches (2022) · cites this paper as [183]
Self-check
Percentages, sums and reported differences re-computed from the paper’s own numbers.
The self-check needs the paper’s full text.
Citations
Cites
Hallmarks of Cancer: The Next Generation
Hanahan, D., & Weinberg, R. A. (2011) · Cell · doi:10.1016/j.cell.2011.02.013 · Cited by 66,590
Double-slit photoelectron interference in strong-field ionization of the neon dimer
Kunitski, M., Eicke, N., Huber, P., Köhler, J., Zeller, S., Voigtsberger, J., Schlott, N., Henrichs, K., Sann, H., Trinter, F., et al. (2019) · Institutional Repository of Leibniz Universität Hannover (Leibniz Universität Hannover) · doi:10.15488/5174 · Cited by 8,378
ABT-199, a potent and selective BCL-2 inhibitor, achieves antitumor activity while sparing platelets
Souers, A. J., Leverson, J. D., Boghaert, E. R., Ackler, S. L., Catron, N. D., Chen, J., Dayton, B. D., Ding, H., Enschede, S. H., Fairbrother, W. J., et al. (2013) · Nature Medicine · doi:10.1038/nm.3048 · Cited by 3,058
The Bcl-2 apoptotic switch in cancer development and therapy
Adams, J. M., & Cory, S. (2007) · Oncogene · doi:10.1038/sj.onc.1210220 · Cited by 2,256
Structural basis of PROTAC cooperative recognition for selective protein degradation
Gadd, M. S., Testa, A., Lucas, X., Chan, K.-H., Chen, W., Lamont, D. J., Zengerle, M., & Ciulli, A. (2017) · Nature Chemical Biology · doi:10.1038/nchembio.2329 · Cited by 1,242
Gray, J. J., Moughon, S. E., Wang, C., Schueler‐Furman, O., Kuhlman, B. A., Rohl, C. A., & Baker, D. A. (2003) · Journal of Molecular Biology · doi:10.1016/s0022-2836(03)00670-3 · Cited by 1,130
Konopleva, M. Y., Pollyea, D. A., Potluri, J., Chyla, B., Hogdal, L. J., Busman, T. A., McKeegan, E. M., Salem, A. H., Zhu, M., Ricker, J. L., et al. (2016) · Cancer Discovery · doi:10.1158/2159-8290.cd-16-0313 · Cited by 1,101
Self-citationThe MCL1 inhibitor S63845 is tolerable and effective in diverse cancer models
Kotschy, A., Szlavik, Z., Murray, J., Davidson, J., Maragno, A. L., Le Toumelin-Braizat, G., Chanrion, M., Kelly, G. L., Gong, J.-N., Moujalled, D. M., et al. (2016) · Nature · doi:10.1038/nature19830 · Cited by 1,047
Lessons in PROTAC Design from Selective Degradation with a Promiscuous Warhead
Bondeson, D. P., Smith, B. E., Burslem, G. M., Buhimschi, A. D., Hines, J., Jaime-Figueroa, S., Wang, J., Hamman, B. D., Ishchenko, A., & Crews, C. M. (2018) · Cell Chemical Biology · doi:10.1016/j.chembiol.2017.09.010 · Cited by 923
From basic apoptosis discoveries to advanced selective BCL-2 family inhibitors
Ashkenazi, A., Fairbrother, W. J., Leverson, J. D., & Souers, A. J. (2017) · Nature Reviews Drug Discovery · doi:10.1038/nrd.2016.253 · Cited by 903
Hergenrother, C. W., Maleszewski, C., Nolan, M. C., Li, J., d’Aubigny, C. D., Shelly, F. C., Howell, E. S., Kareta, T., Izawa, M. R. M., Barucci, M. A., et al. (2019) · Nature Communications · doi:10.1038/s41467-019-09213-x · Cited by 902
Structural biology of the Bcl-2 family of proteins
Petros, A. M., Olejniczak, E. T., & Fesik, S. W. (2004) · Biochimica et Biophysica Acta (BBA) - Molecular Cell Research · doi:10.1016/j.bbamcr.2003.08.012 · Cited by 745
Suhre, K., & Sanejouand, Y. (2004) · Nucleic Acids Research · doi:10.1093/nar/gkh368 · Cited by 689
A selective BCL-XL PROTAC degrader achieves safe and potent antitumor activity
Khan, S., Zhang, X., Lv, D., Zhang, Q., He, Y., Zhang, P., Liu, X., Thummuri, D., Yuan, Y., Wiegand, J. S., et al. (2019) · Nature Medicine · doi:10.1038/s41591-019-0668-z · Cited by 688
Self-citationPROTACs: great opportunities for academia and industry
Sun, X., Gao, H., Yang, Y., He, M., Wu, Y., Song, Y.-G., Tong, Y., & Rao, Y. (2019) · Signal Transduction and Targeted Therapy · doi:10.1038/s41392-019-0101-6 · Cited by 663
Structural basis of lenalidomide-induced CK1α degradation by the CRL4CRBN ubiquitin ligase
Petzold, G., Fischer, E. S., & Thomä, N. H. (2016) · Nature · doi:10.1038/nature16979 · Cited by 620
Modular PROTAC design for the degradation of oncogenic BCR-ABL
Lai, A. C., Toure, M., Hellerschmied, D., Salami, J., Jaime‐Figueroa, S., Ko, E., Hines, J., & Crews, C. M. (2016) · Angewandte Chemie International Edition · doi:10.1002/anie.201507634 · Cited by 618
Leverson, J. D., Phillips, D. C., Mitten, M. J., Boghaert, E. R., Diaz, D., Tahir, S. K., Belmont, L. D., Nimmer, P., Xiao, Y., Ma, X. M., et al. (2015) · Science Translational Medicine · doi:10.1126/scitranslmed.aaa4642 · Cited by 541
Differential PROTAC substrate specificity dictated by orientation of recruited E3 ligase
Smith, B. E., Wang, S. L., Jaime-Figueroa, S., Harbin, A., Wang, J., Hamman, B. D., & Crews, C. M. (2019) · Nature Communications · doi:10.1038/s41467-018-08027-7 · Cited by 517
SPR-measured dissociation kinetics of PROTAC ternary complexes influence target degradation rate
Roy, M. J., Winkler, S., Hughes, S. J., Whitworth, C., Galant, M., Farnaby, W., Rumpel, K., & Ciulli, A. (2019) · ACS Chemical Biology · doi:10.1021/acschembio.9b00092 · Cited by 386
Bcl-2–family proteins and hematologic malignancies: history and future prospects
Reed, J. C. (2008) · Blood · doi:10.1182/blood-2007-09-078162 · Cited by 354
Schoenwaelder, S. M., Jarman, K. E., Gardiner, E. E., Hua, M., Qiao, J., White, M. J., Josefsson, E. C., Alwis, I., Ono, A., Willcox, A., et al. (2011) · Blood · doi:10.1182/blood-2011-04-347849 · Cited by 351
Targeting the Bcl-2 family for cancer therapy
Thomas, S., Quinn, B. A., Das, S. K., Dash, R., Emdad, L., Dasgupta, S., Wang, X., Dent, P., Reed, J. C., Pellecchia, M., et al. (2012) · Expert Opinion on Therapeutic Targets · doi:10.1517/14728222.2013.733001 · Cited by 277
Exploring Targeted Degradation Strategy for Oncogenic KRASG12C
Zeng, M., Xiong, Y., Safaee, N., Nowak, R. P., Donovan, K. A., Yuan, C. J., Nabet, B., Gero, T. W., Feru, F., Li, L., et al. (2020) · Cell Chemical Biology · doi:10.1016/j.chembiol.2019.12.006 · Cited by 275
Crew, A. P., Raina, K., Dong, H., Qian, Y., Wang, J., Vigil, D., Serebrenik, Y. V., Hamman, B. D., Morgan, A., Ferraro, C., et al. (2018) · Journal of Medicinal Chemistry · doi:10.1021/acs.jmedchem.7b00635 · Cited by 257
PROteolysis TArgeting Chimeras (PROTACs) as emerging anticancer therapeutics
Khan, S., He, Y., Zhang, X., Yuan, Y., Pu, S., Kong, Q., Zheng, G., & Zhou, D. (2020) · Oncogene · doi:10.1038/s41388-020-1336-y · Cited by 252
Self-citationPRosettaC: Rosetta Based Modeling of PROTAC Mediated Ternary Complexes
Zaidman, D., Prilusky, J., & London, N. (2020) · Journal of Chemical Information and Modeling · doi:10.1021/acs.jcim.0c00589 · Cited by 224
Chemically induced degradation of CDK9 by a proteolysis targeting chimera (PROTAC)
Robb, C. M., Contreras, J. I., Kour, S., Taylor, M., Abid, M., Sonawane, Y. A., Zahid, M., Murry, D. J., Natarajan, A., & Rana, S. (2017) · Chemical Communications · doi:10.1039/c7cc03879h · Cited by 223
Wurz, R. P., Dellamaggiore, K., Dou, H., Javier, N., LO, M. M. ‐., McCarter, J. D., Mohl, D. A., Sastri, C. E., Lipford, J. R., & Cee, V. J. (2017) · Journal of Medicinal Chemistry · doi:10.1021/acs.jmedchem.6b01781 · Cited by 218
Abbasi, A., Peeke, S. Z., Shah, N. N., Mustafa, J., Khatun, F., Lombardo, A., Abreu, M., Elkind, R., Fehn, K., de Castro, A., et al. (2020) · Journal of Hematology & Oncology · doi:10.1186/s13045-019-0838-y · Cited by 205
Scott, D. C., Sviderskiy, V. O., Monda, J. K., Lydeard, J. R., Cho, S. E., Harper, J. W., & Schulman, B. A. (2014) · Cell · doi:10.1016/j.cell.2014.04.037 · Cited by 201
Phosphorylation of Pex11p does not regulate peroxisomal fission in the yeast Hansenula polymorpha
Thomas, A. S., Krikken, A. M., van der Klei, I. J., & Williams, C. (2015) · Scientific Reports · doi:10.1038/srep11493 · Cited by 173
Lysine-targeting specificity in ubiquitin and ubiquitin-like modification pathways
Mattiroli, F., & Sixma, T. K. (2014) · Nature Structural & Molecular Biology · doi:10.1038/nsmb.2792 · Cited by 164
Kaefer, A., Yang, J., Noertersheuser, P., Mensing, S., Humerickhouse, R., Awni, W., & Xiong, H. (2014) · Cancer Chemotherapy and Pharmacology · doi:10.1007/s00280-014-2530-9 · Cited by 161
Crystal Structure of the Cul2-Rbx1-EloBC-VHL Ubiquitin Ligase Complex
Cardote, T. A. F., Gadd, M. S., & Ciulli, A. (2017) · Structure · doi:10.1016/j.str.2017.04.009 · Cited by 150
Guharoy, M., Bhowmick, P., Sallam, M., & Tompa, P. (2016) · Nature Communications · doi:10.1038/ncomms10239 · Cited by 145
DynOmics: dynamics of structural proteome and beyond
Li, H., Chang, Y.-Y., Lee, J. Y., Bahar, İ., & Yang, L. (2017) · Nucleic Acids Research · doi:10.1093/nar/gkx385 · Cited by 137
Selective degradation of CDK6 by a palbociclib based PROTAC
Rana, S., Bendjennat, M., Kour, S., King, H. M., Kizhake, S., Zahid, M., & Natarajan, A. (2019) · Bioorganic & Medicinal Chemistry Letters · doi:10.1016/j.bmcl.2019.03.035 · Cited by 135
Oxidation resistance 1 is a novel senolytic target
Zhang, X., Zhang, S., Liu, X., Wang, Y., Chang, J., Zhang, X., Mackintosh, S. G., Tackett, A. J., He, Y., Lv, D., et al. (2018) · Aging Cell · doi:10.1111/acel.12780 · Cited by 127
Self-citationProteolysis targeting chimeras (PROTACs) are emerging therapeutics for hematologic malignancies
He, Y., Khan, S., Huo, Z., Lv, D., Zhang, X., Liu, X., Yuan, Y., Hromas, R., Xu, M., Zheng, G., et al. (2020) · Journal of Hematology & Oncology · doi:10.1186/s13045-020-00924-z · Cited by 126
Self-citationDrug resistance is dramatically restored by hedgehog inhibitors in CD34+ leukemic cells
Kobune, M., Takimoto, R., Murase, K., Iyama, S., Sato, T., Kikuchi, S., Kawano, Y., Miyanishi, K., Sato, Y., Niitsu, Y., et al. (2009) · Cancer Science · doi:10.1111/j.1349-7006.2009.01111.x · Cited by 126
Zhang, X., Thummuri, D., Liu, X., Hu, W., Zhang, P., Khan, S., Yuan, Y., Zhou, D., & Zheng, G. (2020) · European Journal of Medicinal Chemistry · doi:10.1016/j.ejmech.2020.112186 · Cited by 123
Self-citationAttacking cancer's Achilles heel: antagonism of anti‐apoptotic BCL ‐2 family members
Opferman, J. T. (2015) · FEBS Journal · doi:10.1111/febs.13472 · Cited by 118
Progress in targeting the BCL-2 family of proteins
Garner, T. P., López, A., Reyna, D. E., Spitz, A. Z., & Gavathiotis, E. (2017) · Current Opinion in Chemical Biology · doi:10.1016/j.cbpa.2017.06.014 · Cited by 109
The Structural Biology of Bcl-xL
Lee, E. F., & Fairlie, W. D. (2019) · International Journal of Molecular Sciences · doi:10.3390/ijms20092234 · Cited by 84
Runting, R. K., Meijaard, E., Abram, N. K., Wells, J. A., Gaveau, D., Ancrenaz, M., Possingham, H. P., Wich, S. A., Ardiansyah, F., Gumal, M. T., et al. (2016) · Nature Communications · doi:10.1038/ncomms12018 · Cited by 67
Ramachandran, S., & Ciulli, A. (2020) · Current Opinion in Structural Biology · doi:10.1016/j.sbi.2020.10.009 · Cited by 62
Valimberti, I., Tiberti, M., Lambrughi, M., Šarčević, B., & Papaleo, E. (2015) · Scientific Reports · doi:10.1038/srep14849 · Cited by 60
Flexible Cullins in Cullin-RING E3 Ligases Allosterically Regulate Ubiquitination
Liu, J., & Nussinov, R. (2011) · Journal of Biological Chemistry · doi:10.1074/jbc.m111.277236 · Cited by 56
Lv, D., Zhang, K., & Li, R. (2018) · PLoS Pathogens · doi:10.1371/journal.ppat.1006868 · Cited by 53
Self-citationKong, Y., Kong, X., He, C., Liu, C., Wang, L., Su, L., Gao, J., Guo, Q., & Cheng, R. (2020) · Journal of Hematology & Oncology · doi:10.1186/s13045-020-00925-y · Cited by 26
Cullin neddylation may allosterically tune polyubiquitin chain length and topology
Onel, M., Sumbul, F., Liu, J., Nussinov, R., & Haliloǧlu, T. (2017) · Biochemical Journal · doi:10.1042/bcj20160748 · Cited by 14
Research works printed but not linked: 1
- Ester, M., Kriegel, H.-P., Sander, J. & Xu, X. in Kdd, Vol. 96, 226-231 (1996).
Cited by
Sorted by citations
The BCL2 family: from apoptosis mechanisms to new advances in targeted therapy
Vogler, M., Braun, Y., Smith, V. M., Westhoff, M.-A., Pereira, R. S., Pieper, N. M., Anders, M., Callens, M., Vervliet, T., Abbas, M., et al. (2025) · Signal Transduction and Targeted Therapy · doi:10.1038/s41392-025-02176-0 · Cited by 462
Recent advances in targeting the “undruggable” proteins: from drug discovery to clinical trials
Xie, X., Yu, T., Li, X., Zhang, N., Foster, L. J., Peng, C., Huang, W., & He, G. (2023) · Signal Transduction and Targeted Therapy · doi:10.1038/s41392-023-01589-z · Cited by 396
Targeted protein degradation: advances in drug discovery and clinical practice
Zhong, G., Chang, X., Xie, W., & Zhou, X. (2024) · Signal Transduction and Targeted Therapy · doi:10.1038/s41392-024-02004-x · Cited by 326
PROTACs: great opportunities for academia and industry (an update from 2020 to 2021)
He, M., Cao, C., Ni, Z., Liu, Y., Song, P., Hao, S., He, Y., Sun, X., & Rao, Y. (2022) · Signal Transduction and Targeted Therapy · doi:10.1038/s41392-022-00999-9 · Cited by 283
Diehl, C. J., & Ciulli, A. (2022) · Chemical Society Reviews · doi:10.1039/d2cs00387b · Cited by 269
Metadata
- Authors
- Lv, D., Pal, P., Liu, X., Jia, Y., Thummuri, D., Zhang, P., Hu, W., Pei, J., Zhang, Q., Zhou, S., Khan, S., Zhang, X., Hua, N., Yang, Q., Arango, S., Zhang, W., Nayak, D., Olsen, S. K., Weintraub, S. T., Hromas, R., Konopleva, M., Yuan, Y., Zheng, G., & Zhou, D.
- Affiliations
- University of Florida (US)
- The University of Texas MD Anderson Cancer Center (US)
- The University of Texas at San Antonio Health Science Center (US)
- Corresponding author
- Yuan, Yaxia
- Zheng, Guangrong
- Zhou, Daohong
- ORCID
- Venue
- Nature Communications
- Published
- 2021-11-25
- Volume
- 12
- Issue
- 1
- Pages
- 6896-6896
- ISSN
- 2041-1723 (ISSN-L)
- PMC
- PMC8617031
- OpenAlex
- W3215130076
- Cited by
- 158
- References
- 55
- Citations by year
- 2026: 27 · 2025: 38 · 2024: 41 · 2023: 22 · 2022: 30
- FWCI
- 7.30
- Type
- journal article
- Language
- en
- Open access
- gold
- doi.org
- Locations
- Nature Communications (publishedVersion, cc-by)
- PubMed Central (publishedVersion, cc-by)
- PubMed (publishedVersion)
- RePEc: Research Papers in Economics (submittedVersion)
- DOAJ (DOAJ: Directory of Open Access Journals) (submittedVersion, cc-by-sa)
- Funders
- U.S. Department of Health & Human Services | National Institutes of Health (R01 CA241191, R01 AG063801, R01 CA205224, R01 GM115568, R01 GM128731, R01 CA200673, R01 CA203834)
- Cancer Prevention and Research Institute of Texas (RR200030)
- Topics
- Life Sciences › Biochemistry, Genetics and Molecular Biology › Molecular Biology › Protein Degradation and Inhibitors
- Life Sciences › Biochemistry, Genetics and Molecular Biology › Molecular Biology › Ubiquitin and proteasome pathways
- Life Sciences › Biochemistry, Genetics and Molecular Biology › Molecular Biology › Cell death mechanisms and regulation
- Keywords
- PROTACs, Bcl-xL, Bcl-2, UbcH5b, RBX1, ubiquitination, navitoclax, leukemia, protein degradation
- MeSH terms
- Antineoplastic Agents, Cell Line, Cell Survival, Humans, Leukemia, Lysine, Models, Molecular, Protein Binding, Protein Conformation, Proto-Oncogene Proteins c-bcl-2, Ubiquitin-Conjugating Enzymes, Ubiquitin-Protein Ligases, Proteasome Endopeptidase Complex, bcl-X Protein, Von Hippel-Lindau Tumor Suppressor Protein, Small Molecule Libraries, Ubiquitination, Proteolysis
About these checks
Registry, retraction, Cites and statistics results are computed, not judged, with one exception: a printed reference that no index lists is read once by a model before it counts as a citation error. Claims are extracted by a model and kept only when their quote appears verbatim in the text; each cited source is then checked, with a model’s help, for whether it says what the claim relies on. Those verdicts can be wrong — read the claim’s quote and the cited source before relying on one.
Statistics and arithmetic are recomputed, not judged.
Confidence bands are shown only for fields calibrated on our annotated test set. None is calibrated yet, so no band is shown.
What counts as a claim ›How we measure confidence ›How we check this ›
Are you an author, or do you see a problem with this page? Request a review
