

The DOI matches its Crossref record; 66 of the 66 references it cites were found in a registry or an index.
Normalizing and denoising protein expression data from droplet-based single cell profiling
Open accessPublished version of a preprint
Abstract
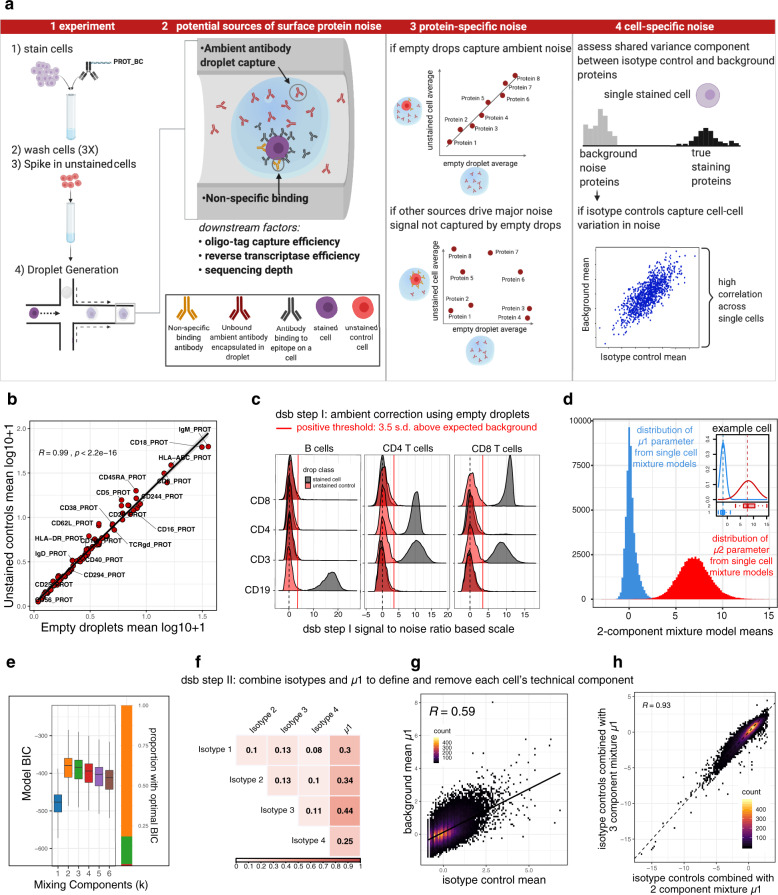
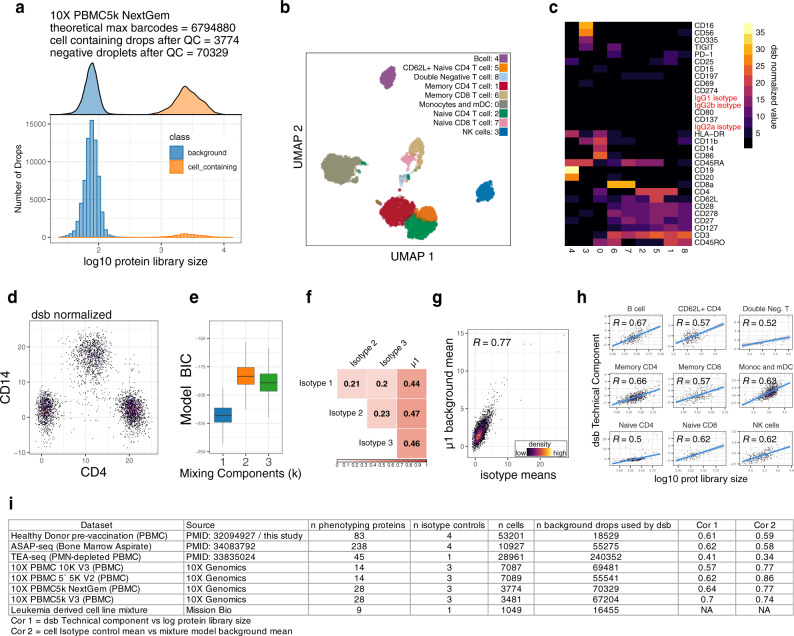
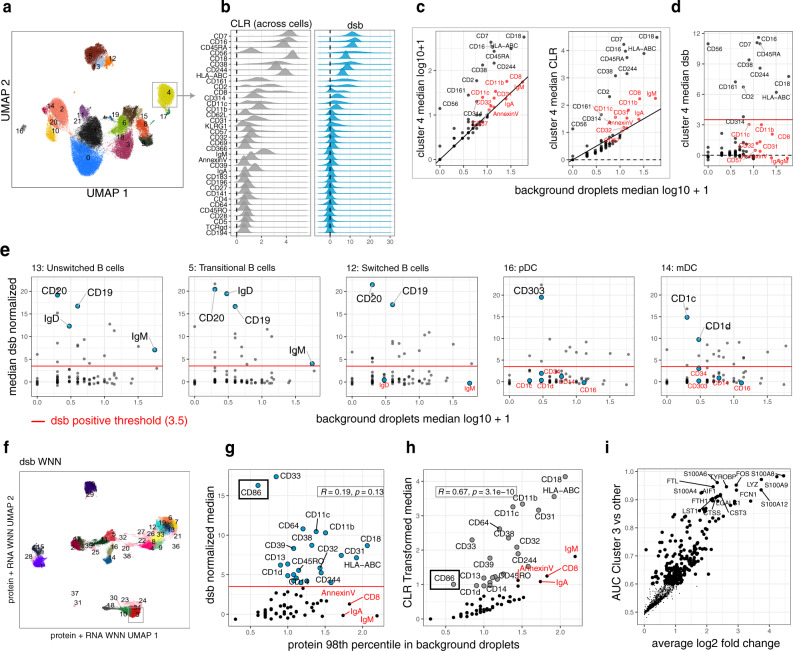
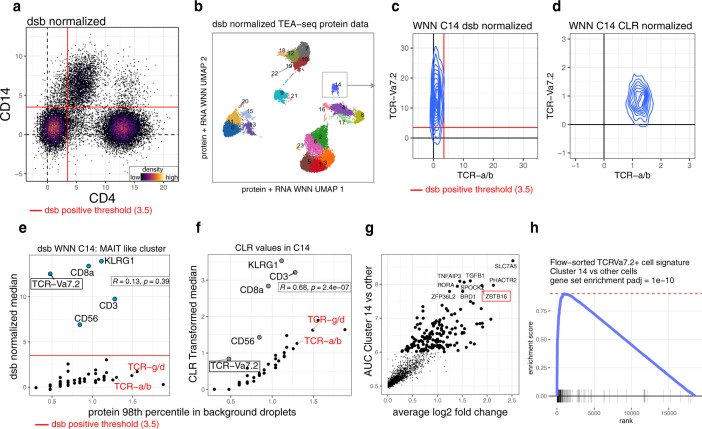
Multimodal single-cell profiling methods that measure protein expression with oligo-conjugated antibodies hold promise for comprehensive dissection of cellular heterogeneity, yet the resulting protein counts have substantial technical noise that can mask biological variations. Here we integrate experiments and computational analyses to reveal two major noise sources and develop a method called "dsb" (denoised and scaled by background) to normalize and denoise droplet-based protein expression data. We discover that protein-specific noise originates from unbound antibodies encapsulated during droplet generation; this noise can thus be accurately estimated and corrected by utilizing protein levels in empty droplets. We also find that isotype control antibodies and the background protein population average in each cell exhibit significant correlations across single cells, we thus use their shared variance to correct for cell-to-cell technical noise in each cell. We validate these findings by analyzing the performance of dsb in eight independent datasets spanning multiple technologies, including CITE-seq, ASAP-seq, and TEA-seq. Compared to existing normalization methods, our approach improves downstream analyses by better unmasking biologically meaningful cell populations. Our method is available as an open-source R package that interfaces easily with existing single cell software platforms such as Seurat, Bioconductor, and Scanpy and can be accessed at "dsb [ https://cran.r-project.org/package=dsb ]".
Overview
The claims and statistics of this paper haven’t been checked yet.
Run the check — free, no account needed. It reads the open-access text and checks the sources it cites.
Integrity signals
Registry
Cites
Statistics
Figures
Verification
Claims the paper makes
The claims and statistics of this paper haven’t been checked yet.
Run the check — free, no account needed. It reads the open-access text and checks the sources it cites.
Claims other papers make about this one
Each is checked against this paper’s own text: does it say what the citing paper says it does?
In the citing paper
“DSB uses background droplets that represent protein background noise to correct values in cells while removing cell-to-cell variation by combining isotype control levels with the specific background level of the respective cell.”
From Best practices for single-cell analysis across modalities (2023) · cites this paper as [161]
Self-check
Percentages, sums and reported differences re-computed from the paper’s own numbers.
The self-check needs the paper’s full text.
Citations
Cites
limma powers differential expression analyses for RNA-sequencing and microarray studies
Ritchie, M. E., Phipson, B., Wu, D., Hu, Y., Law, C. W., Shi, W., & Smyth, G. K. (2015) · Nucleic Acids Research · doi:10.1093/nar/gkv007 · Cited by 40,458
Integrated analysis of multimodal single-cell data
Hao, Y., Hao, S., Andersen-Nissen, E., Mauck, W. M., Zheng, S., Butler, A., Lee, M. J., Wilk, A. J., Darby, C., Zagar, M., et al. (2020) · doi:10.1101/2020.10.12.335331 · Cited by 15,508
Comprehensive Integration of Single-Cell Data
Stuart, T., Butler, A., Hoffman, P., Hafemeister, C., Papalexi, E., Mauck, W. M., Hao, Y., Stoeckius, M., Smibert, P., & Satija, R. (2019) · Cell · doi:10.1016/j.cell.2019.05.031 · Cited by 15,453
Integrating single-cell transcriptomic data across different conditions, technologies, and species
Butler, A., Hoffman, P., Smibert, P., Papalexi, E., & Satija, R. (2018) · Nature Biotechnology · doi:10.1038/nbt.4096 · Cited by 13,174
UMAP: Uniform Manifold Approximation and Projection
McInnes, L., Healy, J., Saul, N., & Großberger, L. (2018) · Journal of Open Source Software · doi:10.21105/joss.00861 · Cited by 9,826
Near-optimal probabilistic RNA-seq quantification
Bray, N. L., Pimentel, H., Melsted, P., & Pachter, L. (2016) · Nature Biotechnology · doi:10.1038/nbt.3519 · Cited by 9,723
SCANPY: large-scale single-cell gene expression data analysis
Wolf, F. A., Angerer, P., & Theis, F. J. (2018) · Genome Biology · doi:10.1186/s13059-017-1382-0 · Cited by 8,881
Santos, A. G., da Rocha, G. O., & de Andrade, J. B. (2019) · Scientific Reports · doi:10.1038/s41598-018-37186-2 · Cited by 8,495
Wood, S. N. (2010) · Journal of the Royal Statistical Society Series B (Statistical Methodology) · doi:10.1111/j.1467-9868.2010.00749.x · Cited by 7,538
Estimating the Number of Clusters in a Data Set Via the Gap Statistic
Tibshirani, R., Walther, G., & Hastie, T. (2001) · Journal of the Royal Statistical Society Series B: Statistical Methodology · doi:10.1111/1467-9868.00293 · Cited by 6,205
Research works printed but not linked: 1
- Swanson, E. et al. Integrated single cell analysis of chromatin accessibility and cell surface markers. eLife. 10, e63632 (2021). · DOI · Paper page
Cited by
Sorted by citations
Items 101–200 of 204
Hahn, W. O., Parks, K. R., Shen, M., Ozorowski, G., Janes, H., Ballweber-Fleming, L., Davis, A. S. W., Duplessis, C. A., Tomai, M. A., Dey, A., et al. (2024) · medRxiv · doi:10.1101/2024.05.08.24306957 · Cited by 6
Homeostatic maturation programs drive human cDC2s into a tolerogenic state
Lu, M., Han, R. H., Yang, H. Y., Yang, L., Zhao, Q., Wang, J., Yu, Z., Liu, N. K., Xu, Y., Luo, F., et al. (2026) · Immunity · doi:10.1016/j.immuni.2026.01.028 · Cited by 8
Kong, G., Nguyen, T. T., Rosales, W. K., Panikar, A. D., Cheney, J. H. W., Lusardi, T. A., Yashar, W. M., Curtiss, B. M., Carratt, S. A., Braun, T. P., et al. (2024) · BMC Bioinformatics · doi:10.1186/s12859-024-05762-1 · Cited by 5
Mulè, M. P., Martins, A. J., Cheung, F., Farmer, R., Sellers, B. A., Quiel, J. A., Jain, A., Kotliarov, Y., Bansal, N., Chen, J., et al. (2023) · medRxiv · doi:10.1101/2023.03.20.23287474 · Cited by 5
Self-citationCross‐Modal Denoising and Integration of Spatial Multi‐Omics Data with CANDIES
Liu, Y., Zou, W., Li, Y., Wang, J., Cai, M., & Cai, H. (2026) · Advanced Science · doi:10.1002/advs.202523754 · Cited by 6
Li, S., & Zou, J. (2026) · Computational Biology and Chemistry · doi:10.1016/j.compbiolchem.2026.108951 · Cited by 4
Repapi, E., Agarwal, D., Napolitani, G., Sims, D., & Taylor, S. (2023) · F1000Research · doi:10.12688/f1000research.121829.3 · Cited by 4
Wasdin, P. T., Abu-Shmais, A. A., Irvin, M., Vukovich, M. J., & Georgiev, I. S. (2024) · Bioinformatics Advances · doi:10.1093/bioadv/vbae170 · Cited by 4
T cell receptor usage and epitope specificity amongst CD8+ and CD4+ SARS-CoV-2-specific T cells
Fahnøe, U., Feng, S., Underwood, A. P., Jacobsen, K., Ameri, A., Blicher, T. H., Sølund, C. S., Rosenberg, B. R., Brix, L., Weis, N. M., et al. (2025) · Frontiers in Immunology · doi:10.3389/fimmu.2025.1510436 · Cited by 4
Gerakopoulos, V., Ramos, C., Müller, C., Walterskirchen, N., Vintila, S., Zotter, C., Ilg, M., Pap, A., Riss, S., Bergmann, M. M., et al. (2025) · Cancer Letters · doi:10.1016/j.canlet.2025.217678 · Cited by 4
SNACS: a tool for demultiplexing single-cell DNA sequencing data
Kennedy, V. E., Roy, R., Peretz, C. A. C., Koh, A., Tran, E., Smith, C. C., & Olshen, A. B. (2025) · Bioinformatics · doi:10.1093/bioinformatics/btaf265 · Cited by 4
Kleino, I., Nowlan, K., Kotimaa, J. P., & Kekäläinen, E. (2022) · Biotechnology Journal · doi:10.1002/biot.202100213 · Cited by 4
CAMML with the Integration of Marker Proteins (ChIMP)
Schiebout, C. T., & Frost, H. R. (2022) · Bioinformatics · doi:10.1093/bioinformatics/btac674 · Cited by 3
Peretz, C. A. C., Kennedy, V. E., Walia, A., Delley, C. L., Koh, A., Tran, E., Clark, I. C., Hayford, C. E., D’Amato, C., Xue, Y., et al. (2023) · bioRxiv (Cold Spring Harbor Laboratory) · doi:10.1101/2023.05.15.540305 · Cited by 4
Kim, Y. J., Tarashansky, A. J., Liang, K., Urisko, M., Dorman, L. C., Borja, M., Neff, N. F., Pisco, A. O., & Granados, A. A. (2023) · bioRxiv (Cold Spring Harbor Laboratory) · doi:10.1101/2023.07.11.548639 · Cited by 4
Kennedy, V. E., Peretz, C. A. C., Walia, A., Chyla, B., Sun, Y., Hill, J. E., Tran, E., Koh, A., Ferng, T. T., Pintar, S. M., et al. (2025) · bioRxiv (Cold Spring Harbor Laboratory) · doi:10.1101/2025.02.02.636108 · Cited by 4
Mindt, B. C., Kim, J. S., Warren, T., Song, Y., & DiGiandomenico, A. (2023) · Frontiers in Immunology · doi:10.3389/fimmu.2023.1227175 · Cited by 3
High-dimensional multi-study multi-modality covariate-augmented generalized factor model
Liu, W., & Zhong, Q. (2025) · Biometrics · doi:10.1093/biomtc/ujaf107 · Cited by 3
Sayed, M., Wang, Y. J., & Lim, H. (2024) · Briefings in Functional Genomics · doi:10.1093/bfgp/elae039 · Cited by 3
Zhao, C. N., Mulè, M. P., Martins, A. J., Pinal‐Fernandez, I., Donahue, R. N., Chen, J., Schlom, J., Gulley, J. L., Mammen, A. L., Tsang, J. S., et al. (2022) · bioRxiv (Cold Spring Harbor Laboratory) · doi:10.1101/2022.06.05.494592 · Cited by 2
Self-citationMulti-organ functions of yolk sac during human early developmentPreprint
Botting, R. A., Goh, I., Rose, A., Webb, S., Engelbert, J., Gitton, Y., Stephenson, E., Londoño, M. Q., Mather, M., Mende, N., et al. (2022) · bioRxiv (Cold Spring Harbor Laboratory) · doi:10.1101/2022.08.03.502475 · Cited by 3
Castellanos-Rueda, R., Wang, K.-L. K., Forster, J. L., Driessen, A., Frank, J. A., Martínez, M. R., & Reddy, S. T. (2024) · bioRxiv (Cold Spring Harbor Laboratory) · doi:10.1101/2024.02.26.582129 · Cited by 3
Sequencing-based methods for single-cell multi-omics studies
Qin, S., Liu, S., & Weng, X. (2023) · Science China Chemistry · doi:10.1007/s11426-023-1793-7 · Cited by 2
Zhou, J., Xue, J., Li, Y., Liu, F., Du, F., & Yu, Z. (2025) · Briefings in Bioinformatics · doi:10.1093/bib/bbaf400 · Cited by 2
Schmidt, F., Wu, K.-X., Purwanti, Y., Tan, N., Carbajo, D., Ke, X.-B., Wilm, A., Fehlings, M., Macleod, D., Nardin, A., et al. (2025) · Frontiers in Oncology · doi:10.3389/fonc.2025.1629802 · Cited by 3
Fenton, T. M., Wulff, L., Väänänen, V. A., Jones, G., Lemvigh, C. K., Riis, L. B., Wewer, M. D., Vandamme, J., Jørgensen, P. B., Bain, C. C., et al. (2025) · Science Immunology · doi:10.1126/sciimmunol.adz8650 · Cited by 3
dos Santos, J. C., Groenendijk, A. L., Ruijten, S. D. E., Knoll, R., Vadaq, N., ter Horst, R., Fok, E. T., Witkowski, W., Blaauw, M. J. T., van Eekeren, L. E., et al. (2026) · iScience · doi:10.1016/j.isci.2026.114807 · Cited by 4
MultiSP deciphers tissue structure and multicellular communication from spatial multi-omics data
Mo, C., Zou, X., & Jin, S. (2026) · Cell Genomics · doi:10.1016/j.xgen.2026.101141 · Cited by 2
Immune-microbiome coordination defines interferon setpoints in healthy humans
Babdor, J., Patel, R. K., Davidson, B. R., Koser, K. L., Noecker, C. A., Rahim, M. K., Bisanz, J. E., Tenvooren, I., Marquez, D., Calvo, M., et al. (2026) · Cell · doi:10.1016/j.cell.2026.02.003 · Cited by 4
Nishio, A., Kodama, T., Daiku, K., Maesaka, K., Tanaka, S., Nozaki, Y., Kurahashi, T., Matsumoto, K., Nawa, T., Tawara, S., et al. (2026) · Journal for ImmunoTherapy of Cancer · doi:10.1136/jitc-2025-013648 · Cited by 2
Jespersen, J. M., Avanesyan, L., Publicover, J., Carey, N. D., Patel, R. K., Edwards, A. W., Stenske, S., Shin, J., Li, J., Simone, M., et al. (2026) · Science Translational Medicine · doi:10.1126/scitranslmed.adx1523 · Cited by 3
Semenova, A., Poor, T. A., Müller, J., Prakki, S. R. S., Geyer, P. E., Mück-Häusl, M., Grant, R. A., Rasmussen, L., Holdt, L. M., Teupser, D., et al. (2026) · JCI Insight · doi:10.1172/jci.insight.203056 · Cited by 3
de Sande, A. H., Turunen, T., Bouvy‐Liivrand, M., Örd, T., Palani, S., Lahnalampi, M., Tundidor-Centeno, C., Liljenbäck, H., Virta, J., Niskanen, H., et al. (2025) · Genome Medicine · doi:10.1186/s13073-025-01530-9 · Cited by 3
Lacar, B. (2021) · Methods in molecular biology · doi:10.1007/978-1-0716-1771-7_14 · Cited by 2
Brown, M. E., Thirawatananond, P., Peters, L. D., Kern, E. J., Vijay, S., Sachs, L. K., Posgai, A. L., Brusko, M., Shapiro, M. R., Mathews, C. E., et al. (2024) · bioRxiv (Cold Spring Harbor Laboratory) · doi:10.1101/2024.07.16.603756 · Cited by 2
PTPN11 Mutation Clonal Hierarchy in Acute Myeloid LeukemiaPreprint
Fobare, S., Sharpe, C., Quinn, K. R., Bryant, K., Miles, L. A., Bowman, R. L., Cheney, C. M., Furby, C., Long, M., Fyock, K., et al. (2024) · bioRxiv (Cold Spring Harbor Laboratory) · doi:10.1101/2024.09.18.612239 · Cited by 2
Urbanski, G., Taylor, K. E., Flynn, E., Norouzi, A., Chu, C., Davidson, B. R., Ghosh, A., Nititham, J., Patel, R. K., Poon, A. W., et al. (2025) · bioRxiv (Cold Spring Harbor Laboratory) · doi:10.1101/2025.02.27.640483 · Cited by 2
A proteogenomic tool uncovers protein markers for human microglial statesPreprint
Haage, V. C., Bautista, A. R., Tuddenham, J. F., Marshe, V. S., Chiu, R., Liu, Y., Lama, T., Kelly, S. S., Parghi, N., Park, J., et al. (2025) · bioRxiv (Cold Spring Harbor Laboratory) · doi:10.1101/2025.03.31.646212 · Cited by 3
Avila, J., Simmons, J. D., Figueiredo, M. C., Turner, M., Cordeiro‐Santos, M., Rolla, V. C., Kristki, A. L., Gangula, R., Nochowicz, C. H., Ram, R., et al. (2025) · medRxiv · doi:10.1101/2025.04.29.25326433 · Cited by 2
Ashida, S., Kosa, P. F., Otaizo-Carrasquero, F. A., Sturdevant, D. E., Shamsaddini, A., Zhao, Y., Shetty, J., Martens, C., Cohen, J. I., & Bielekova, B. (2025) · medRxiv · doi:10.1101/2025.08.05.25333071 · Cited by 2
Automated denoising of CITE-seq data with ThresholdR
Oliaeimotlagh, M., Kumar, S., Taraskin, A. S., Suthahar, S. S. A., Suryawanshi, V., Chiang, A. W. T., & Ley, K. F. (2025) · Cell Reports Methods · doi:10.1016/j.crmeth.2025.101088 · Cited by 1
A role for Fas/FasL-dependent NK-mediated cytotoxicity in infants with perinatal HIV
Iyer, A., de Armas, L. R., Dinh, V. B., Pallikkuth, S., Pahwa, R. N., Vaz, P., Lain, M. G., & Pahwa, S. G. (2025) · iScience · doi:10.1016/j.isci.2025.113637 · Cited by 1
Fobare, S., Sharpe, C., Quinn, K. R., Bryant, K., Miles, L. A., Bowman, R. L., Cheney, C. M., Furby, C., Long, M., Fyock, K., et al. (2026) · JCI Insight · doi:10.1172/jci.insight.193779 · Cited by 1
Lima, N. S., McCormick, L., Li, S., Wake, C., Subramanian, R., Spangler, A., Pinto, Y., Catalano, W. L., Henry, A. R., Laboune, F., et al. (2026) · Science Translational Medicine · doi:10.1126/scitranslmed.aeb9837 · Cited by 1
A multimodal atlas for immunotherapeutic targeting of AML surface heterogeneity
Ung, M. H., Etchin, J., Halfond, A. L., DiFazio, J., Keschner, Y., Pyclik, A., Campbell, A., Wang, R., Silva, M., Gjeci, B., et al. (2026) · iScience · doi:10.1016/j.isci.2026.115337 · Cited by 1
Maksimovic, J., Shanthikumar, S., Howitt, G., Dixit, G., Hickey, P. F., Anttila, C., Brown, D. V., Gubbels, L., Senabouth, A., Amann‐Zalcenstein, D., et al. (2026) · Mucosal Immunology · doi:10.1016/j.mucimm.2026.03.012 · Cited by 1
Spatial multi-omics imputation and embedding with SpaMIE
Liu, W., Xiang, D.-W., Jiang, X., Bai, Y.-H., Li, S., Li, W., Lv, S.-X., Li, Q., Jiang, J.-K., & Liu, J. (2026) · Cell Reports Methods · doi:10.1016/j.crmeth.2026.101456
SARS-CoV-2 infection and vaccination elicit distinct pharyngeal mucosal B cell responses in children
Xu, Q., Shi, L., Wang, L., Cheung, F., Kotekar, A., Koroleva, G., Rice, E., Apps, R., Lack, J., Martens, C., et al. (2026) · Nature Communications · doi:10.1038/s41467-026-72996-3 · Cited by 1
Self-citationImmune dysregulation and stem-like CD8+ T cell enrichment in type 1 diabetes pancreatic lymph nodes
Peters, L. D., Seay, H. R., Smith, J. A., Posgai, A. L., Berkowitz, R. L., Wasserfall, C. H., Atkinson, P. M. A., Bacher, R. L., Brusko, M., & Brusko, T. M. (2026) · Journal of Clinical Investigation · doi:10.1172/jci196445 · Cited by 1
Hart, A. P., Merolle, M. I., Howard, C., Haskins, B. E., Cohn, I. S., Bobba, S., Xiao, R., Yang, Y., Cadwell, K., Ma, J., et al. (2026) · Nature Immunology · doi:10.1038/s41590-026-02665-6 · Cited by 1
Interpretable modeling of time-resolved single-cell gene–protein expression with CrossmodalNet
Yang, Y., Lin, Y.-T., Li, G., Zhong, Y., Xu, Q., & Cai, J. J. (2023) · Briefings in Bioinformatics · doi:10.1093/bib/bbad342 · Cited by 1
A Comparative Study of Computational Methods for Multimodal Single-Cell Data Integration
Tran, B., Pham, T. N., Huynh, T. V., & Hoang, K. (2023) · International Conference on Multimedia Analysis and Pattern Recognition (MAPR) · doi:10.1109/mapr59823.2023.10289050 · Cited by 1
scPDA: denoising protein expression in droplet-based single-cell data
Zhu, O., & Li, J. (2025) · Genome biology · doi:10.1186/s13059-025-03686-4 · Cited by 1
Pathogenic neutrophilia drives acute respiratory distress syndrome in severe COVID-19 patientsPreprint
Eddins, D. J., Yang, J., Kosters, A., Giacalone, V. D., Pechuan-Jorge, X., Chandler, J. D., Eum, J., Babcock, B. R., Dobosh, B. S., Hernandez, M., et al. (2021) · bioRxiv (Cold Spring Harbor Laboratory) · doi:10.1101/2021.06.02.446468 · Cited by 1
de Sande, A. H., Turunen, T., Bouvy‐Liivrand, M., Örd, T., Palani, S., Tundidor-Centeno, C., Liljenbäck, H., Virta, J., Smålander, O.-P., Sinkkonen, L., et al. (2023) · bioRxiv (Cold Spring Harbor Laboratory) · doi:10.1101/2023.10.09.561173 · Cited by 1
Allen, D., Weaver, M., Prokopchuk, S. V., Lekschas, F., Jiang, M., Finak, G., Greene, E., & McDavid, A. (2024) · bioRxiv (Cold Spring Harbor Laboratory) · doi:10.1101/2024.03.14.584720 · Cited by 1
dsb: Normalize & Denoise Droplet Single Cell Protein Data (CITE-Seq)
Mulè, M. P., & Martins, A. J. (2021) · doi:10.32614/cran.package.dsb · Cited by 1
Self-citationDermatopontin-expressing fibroblasts mediate an essential skin macrophage nichePreprint
Vollmers, A. C., Wu, S. Z., Altieri, A., McCartney, E. E., Bender, H. S., Lee, W. P., Zhang, J., Hu, C., Uttarwar, S., Heiden, J. A. V., et al. (2024) · bioRxiv (Cold Spring Harbor Laboratory) · doi:10.1101/2024.11.21.624708 · Cited by 2
Wirtz, T. H., Palomino‐Echeverría, S., Pollmanns, M. R., Huergo, E., Schreibing, F., Reißing, J., Sánchez-Garrido, C., López‐Vicario, C., Aransay, A. M., Baldassarre, M., et al. (2025) · medRxiv · doi:10.1101/2025.02.04.25321370 · Cited by 1
Chen, Y.-H., Bi, T., Xu, M. Q., Lee, J., Lu, W. S., Zhuang, M., Velarde, A. M., McCurry, D., Yang, H., Alatrash, G., et al. (2025) · bioRxiv (Cold Spring Harbor Laboratory) · doi:10.1101/2025.10.17.682671 · Cited by 1
Modeling human B cell development with pluripotent stem cellsPreprint
Sun, X., Kwan, J. J., Kothari, K., Nazzari, A. F., Kosters, A., Fields, C. A., Thai, B., Bhattacharya, D., Atkins, M. H., Tung, K. W. C., et al. (2026) · bioRxiv (Cold Spring Harbor Laboratory) · doi:10.64898/2026.05.04.722674 · Cited by 1
Repapi, E., Agarwal, D., Napolitani, G., Sims, D., & Taylor, S. (2022) · F1000Research · doi:10.12688/f1000research.121829.1 · Cited by 1
Ismail, W. M., Fernandez, J. A., Binder, M., Lasho, T. L., Kim, M., Geyer, S. M., Mazzone, A., Finke, C. M., Mangaonkar, A. A., Lee, J., et al. (2022) · bioRxiv (Cold Spring Harbor Laboratory) · doi:10.1101/2022.08.25.505316
Interpretable modeling of time-resolved single-cell gene-protein expression using CrossmodalNetPreprint
Yang, Y., Lin, Y.-T., Li, G., Zhong, Y., Xu, Q., & Cai, J. J. (2023) · bioRxiv (Cold Spring Harbor Laboratory) · doi:10.1101/2023.05.16.541011
Wasdin, P. T., Abu-Shmais, A. A., Irvin, M., Vukovich, M. J., & Georgiev, I. S. (2023) · bioRxiv (Cold Spring Harbor Laboratory) · doi:10.1101/2023.10.13.562258
Wehbe, F., Adams, L., Yuen, S., Kim, Y., & Tanaka, Y. (2023) · bioRxiv (Cold Spring Harbor Laboratory) · doi:10.1101/2023.12.01.569595
Ismail, W. M., Fernandez, J. A., Binder, M., Lasho, T., Kim, M., Geyer, S. M., Mazzone, A., Finke, C. M., Mangaonkar, A. A., Lee, J., et al. (2024) · Research Square · doi:10.21203/rs.3.rs-4481664/v1
ADTGP: correcting single-cell antibody sequencing data using Gaussian process regression
Liu, A. C. H., & Chan, S. M. (2024) · Bioinformatics · doi:10.1093/bioinformatics/btae660
Interpretable Multi-Omics Representation Learning Via Covariate-Augumented Generalized Factor ModelPreprint
Liu, W., Xiang, D., Zhou, X., & Jiang, J. (2025) · SSRN Electronic Journal · doi:10.2139/ssrn.5143837
Murakami, T., Yamaguchi, Y., Amiya, S., Yoshimine, Y., Nameki, S., Okita, Y., Kato, Y., Hirata, H., Takeda, Y., Kumanogoh, A., et al. (2025) · Inflammation and Regeneration · doi:10.1186/s41232-025-00371-8
A proteogenomic tool uncovers protein markers for human microglial statesPreprint
Jager, P. L. D., Haage, V. C., Bautista, A. R., Tuddenham, J. F., Marshe, V. S., Chiu, R., Liu, Y., Lama, T., Kelly, S. S., Parghi, N., et al. (2025) · Research Square · doi:10.21203/rs.3.rs-6380446/v1
Peters, L. D., Seay, H. R., Smith, J., Posgai, A. L., Berkowitz, R. L., Wasserfall, C. H., Atkinson, M. A., Bacher, R. L., Brusko, M., & Brusko, T. M. (2025) · bioRxiv (Cold Spring Harbor Laboratory) · doi:10.1101/2025.05.23.655848
Moslehi, Z., AmeriFar, S., de Azevedo, K., & Buettner, F. (2025) · Nucleic Acids Research · doi:10.1093/nar/gkaf630
Immune interaction signatures in adipose tissue fibroblasts in obesity-associated atherosclerosisPreprint
Mikkola, L., Bölük, A., Piipponen, M., Mikocziova, I., Valkonen, M., Fagersund, J., Hakovirta, H. H., Saraste, A., de Sande, A. H., Palani, S., et al. (2025) · bioRxiv (Cold Spring Harbor Laboratory) · doi:10.1101/2025.09.02.673686
Jespersen, J. M., Avanesyan, L., Publicover, J., Carey, N. D., Patel, R. K., Edwards, A. W., Stenske, S., Shin, J. H., Li, J., Simone, M., et al. (2025) · bioRxiv (Cold Spring Harbor Laboratory) · doi:10.1101/2025.09.29.677401
Jani, S., Bencomo, T., Shasha, C., Pulliam, T., Jojic, A., Church, C. D., Gooley, T. A., Koelle, D. M., Newell, E. W., & Nghiem, P. (2025) · Cancer Immunology Research · doi:10.1158/2326-6066.cir-25-0082
Local B cell maturation and mast cell regulation of choroid plexus function in early life.Preprint
Ali-Moussa, S., Blas-Medina, A., Josephides, J. M., Mirabeau, O., Bouteau, I., Matijevic, T., Kovacs, M., Pakulska, V., Pangan, A. R., Thomas, C., et al. (2025) · bioRxiv (Cold Spring Harbor Laboratory) · doi:10.1101/2025.11.27.690721
Wang, W., Cen, Y., Lu, Z., Xu, Y., Sun, T., Xiao, Y., Liu, W., Li, J. J., & Wang, C. (2024) · Figshare · doi:10.6084/m9.figshare.25893887
Wang, W., Cen, Y., Lu, Z., Xu, Y., Sun, T., Xiao, Y., Liu, W., Li, J. J., & Wang, C. (2024) · Figshare · doi:10.6084/m9.figshare.26724686
Curion, F., Rich‐Griffin, C., Agarwal, D., Ouologuem, S., Rue-Albrecht, K., May, L., Garcia, G. E. L., Heumos, L., Thomas, T. R., Lason, W., et al. (2024) · Figshare · doi:10.6084/m9.figshare.26211618
Kong, G., Nguyen, T. T., Rosales, W. K., Panikar, A. D., Cheney, J. H. W., Lusardi, T. A., Yashar, W. M., Curtiss, B. M., Carratt, S. A., Braun, T. P., et al. (2024) · Figshare · doi:10.6084/m9.figshare.25530298
Wang, W., Cen, Y., Lu, Z., Xu, Y., Sun, T., Xiao, Y., Liu, W., Li, J. J., & Wang, C. (2024) · Figshare · doi:10.6084/m9.figshare.26724677
Curion, F., Rich‐Griffin, C., Agarwal, D., Ouologuem, S., Rue-Albrecht, K., May, L., Garcia, G. E. L., Heumos, L., Thomas, T. R., Lason, W., et al. (2024) · Figshare · doi:10.6084/m9.figshare.26211351
Wang, W., Cen, Y., Lu, Z., Xu, Y., Sun, T., Xiao, Y., Liu, W., Li, J. J., & Wang, C. (2024) · Figshare · doi:10.6084/m9.figshare.25893716
Wang, W., Cen, Y., Lu, Z., Xu, Y., Sun, T., Xiao, Y., Liu, W., Li, J. J., & Wang, C. (2024) · Figshare · doi:10.6084/m9.figshare.26724689
Wang, W., Cen, Y., Lu, Z., Xu, Y., Sun, T., Xiao, Y., Liu, W., Li, J. J., & Wang, C. (2024) · Figshare · doi:10.6084/m9.figshare.26724680
Kong, G., Nguyen, T., Rosales, W. K., Panikar, A. D., Cheney, J. H. W., Lusardi, T. A., Yashar, W. M., Curtiss, B. M., Carratt, S. A., Braun, T. P., et al. (2024) · Figshare · doi:10.6084/m9.figshare.25530441
Wang, W., Cen, Y., Lu, Z., Xu, Y., Sun, T., Xiao, Y., Liu, W., Li, J. J., & Wang, C. (2024) · Figshare · doi:10.6084/m9.figshare.26724683
Wang, W., Cen, Y., Lu, Z., Xu, Y., Sun, T., Xiao, Y., Liu, W., Li, J. J., & Wang, C. (2024) · Figshare · doi:10.6084/m9.figshare.26724674
Lance, C., Shitov, V. A., Wen, H., Ji, Y., Holderrieth, P., Wu, Y., Liu, R., Cannoodt, R., Tang, W., Waldrant, K., et al. (2026) · bioRxiv (Cold Spring Harbor Laboratory) · doi:10.64898/2026.02.24.707614
Identifying cancer cell-state transitions from multimodal single-cell dataPreprint
Baselli, G., Alekseenko, A., Liaño-Pons, J., Sinanis, L., Rrapaj, E., Arsenian‐Henriksson, M., & Pelechano, V. (2026) · bioRxiv (Cold Spring Harbor Laboratory) · doi:10.64898/2026.03.02.708945
Predicting how perturbations reshape cellular trajectories with PerturbGenPreprint
Ly, K. C. H., Feriz, A. M., Isobe, T., Vahidi, A., Vaghari, D., Rostron, A., Londoño, M. Q., Mende, N., Vijayabaskar, M. S., Moullet, M., et al. (2026) · bioRxiv (Cold Spring Harbor Laboratory) · doi:10.64898/2026.03.04.709254 · Cited by 2
Spintge, J. B., Mai, K., Carraro, C., van Uelft, M., Elli, F., Mauer, K., Holsten, L., Frolov, A., Elangikal, J., Hinkley, E. R., et al. (2026) · medRxiv · doi:10.64898/2026.03.12.26348228
Fernandez, M. L., Gajardo-Escobar, F., Sjöberg-Herrera, M. K., Romagnoli, P. A., & Ceschin, D. G. (2026) · Annual Review of Biomedical Data Science · doi:10.1146/annurev-biodatasci-092724-061209
Decoding Spatial Heterogeneity and Multi‐Omics Regulation with Hierarchical Graph Learning
Chen, J., Xie, J., Liao, Y., Li, J. J., Liu, L., Gao, X., & Cai, H. (2026) · Advanced Science · doi:10.1002/advs.75574
Wagner, J. A., Sandel, D. A., Patel, R. K., Gruenhagen, G. W., Tibúrcio, R., Singh, S. S., Schwartz, K., Traglia, M., Milani, P., Germanio, C. D., et al. (2026) · bioRxiv (Cold Spring Harbor Laboratory) · doi:10.64898/2026.05.29.728863
Hierarchical classification of immune cell transcriptomes at population-scalePreprint
Beltz, C., Qiu, Z., Sadowski, L., Kraske, J. A., Aggarwal, A., Quintanal-Villalonga, À., Manoj, P., Littbarski, A., Bajaj, S., Meškauskaitė, B., et al. (2026) · bioRxiv (Cold Spring Harbor Laboratory) · doi:10.64898/2026.05.30.728980 · Cited by 1
Malek, R., Matassoli, F. L., Gordon, K., Shimberg, G. D., Mantus, G. E., Spangler, A., Chopde, A. J., Teng, I., Zhou, T., Lin, B. C., et al. (2026) · Science Translational Medicine · doi:10.1126/scitranslmed.aeb9847
Interpretable multi-omics representation learning via covariate-augmented generalized factor model
Liu, W., Xiang, D., Zhou, X., & Jiang, J. (2026) · Pattern Recognition · doi:10.1016/j.patcog.2026.114718
Zhang, Y., & Sun, Q.-S. (2026) · Biomedicines · doi:10.3390/biomedicines14092035
Metadata
- Authors
- Mulè, M. P., Martins, A. J., & Tsang, J. S.
- Affiliations
- National Institutes of Health (US)
- Corresponding author
- Tsang, John S.
- Venue
- Nature Communications
- Published
- 2022-04-19
- Volume
- 13
- Issue
- 1
- Pages
- 2099-2099
- ISSN
- 2041-1723 (ISSN-L)
- PMC
- PMC9018908
- OpenAlex
- W4225731526
- Cited by
- 197
- References
- 65
- Citations by year
- 2026: 39 · 2025: 43 · 2024: 41 · 2023: 36 · 2022: 27
- FWCI
- 12.65
- Type
- journal article
- Language
- en
- Open access
- gold
- doi.org
- Locations
- Nature Communications (publishedVersion, cc-by)
- bioRxiv (Cold Spring Harbor Laboratory) (acceptedVersion, public-domain)
- PubMed Central (publishedVersion, cc-by)
- PubMed (publishedVersion)
- RePEc: Research Papers in Economics (submittedVersion)
- DOAJ (DOAJ: Directory of Open Access Journals) (submittedVersion, cc-by-sa)
- Apollo (University of Cambridge) (submittedVersion, cc-by)
- Apollo
- Apollo (cc-by)
- Funders
- Johns Hopkins University
- National Institutes of Health
- National Institute of Allergy and Infectious Diseases (ZIAAI001152)
- Topics
- Life Sciences › Biochemistry, Genetics and Molecular Biology › Molecular Biology › Single-cell and spatial transcriptomics
- Life Sciences › Biochemistry, Genetics and Molecular Biology › Molecular Biology › Gene expression and cancer classification
- Physical Sciences › Chemical Engineering › Fluid Flow and Transfer Processes › Innovative Microfluidic and Catalytic Techniques Innovation
- Keywords
- data denoising, CITE-seq, cellular heterogeneity
- MeSH terms
- Software, Gene Expression Profiling, Single-Cell Analysis
About these checks
Registry, retraction, Cites and statistics results are computed, not judged, with one exception: a printed reference that no index lists is read once by a model before it counts as a citation error. Claims are extracted by a model and kept only when their quote appears verbatim in the text; each cited source is then checked, with a model’s help, for whether it says what the claim relies on. Those verdicts can be wrong — read the claim’s quote and the cited source before relying on one.
Statistics and arithmetic are recomputed, not judged.
Confidence bands are shown only for fields calibrated on our annotated test set. None is calibrated yet, so no band is shown.
What counts as a claim ›How we measure confidence ›How we check this ›
Are you an author, or do you see a problem with this page? Request a review
