

The DOI matches its Crossref record; 78 of the 78 references it cites were found in a registry or an index; 5 of the 51 sources its claims cite were checked for support.
Accuracy prompts are a replicable and generalizable approach for reducing the spread of misinformation
Open accessAbstract
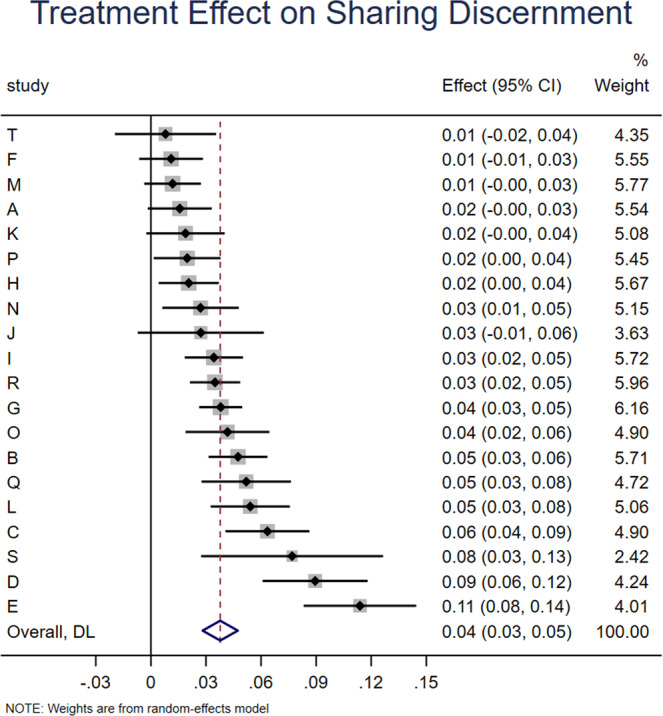
Interventions that shift users attention toward the concept of accuracy represent a promising approach for reducing misinformation sharing online. We assess the replicability and generalizability of this accuracy prompt effect by meta-analyzing 20 experiments (with a total N = 26,863) completed by our group between 2017 and 2020. This internal meta-analysis includes all relevant studies regardless of outcome and uses identical analyses across all studies. Overall, accuracy prompts increased the quality of news that people share (sharing discernment) relative to control, primarily by reducing sharing intentions for false headlines by 10% relative to control in these studies. The magnitude of the effect did not significantly differ by content of headlines (politics compared with COVID-19 related news) and did not significantly decay over successive trials. The effect was not robustly moderated by gender, race, political ideology, education, or value explicitly placed on accuracy, but was significantly larger for older, more reflective, and more attentive participants. This internal meta-analysis demonstrates the replicability and generalizability of the accuracy prompt effect on sharing discernment.
Overview
AI snapshot
Written from the paper’s full text.
TL;DR
This internal meta-analysis of 20 experiments (total N = 26,863) finds that accuracy prompts reliably increase sharing discernment, mainly by reducing intentions to share false news by about 10% relative to control. The authors conclude the effect is replicable and generalizable across prompt types, topics, and samples, though effects are modest and mostly tested in U.S. online survey experiments by one research group.
Key findings
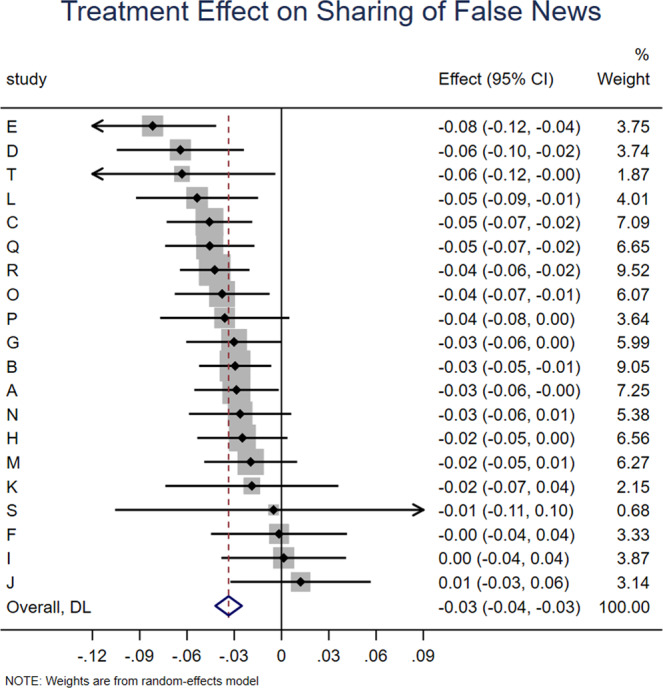
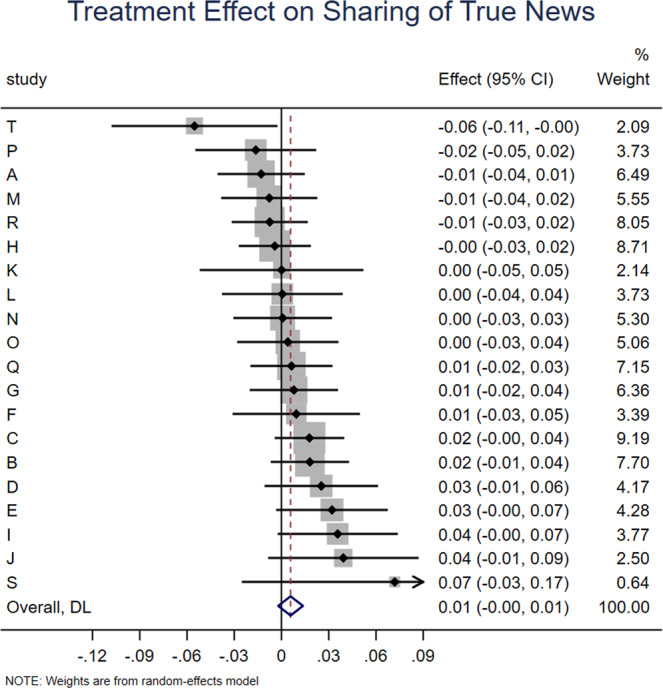
- Across all 20 experiments, accuracy prompts significantly increased sharing discernment (interaction between headline veracity and treatment: b = 0.038, z = 7.102, p < 0.001), a 71.7% increase over baseline control discernment. This was driven by a significant decrease in sharing intentions for false news (b = −0.034, z = 7.851, p < 0.001), a 10% decrease relative to control, with no significant effect on true news (b = 0.006, z = 1.44, p = 0.150).
- The most-tested Evaluation prompt (k = 14) significantly increased discernment (b = 0.034, p < 0.001), a 59.6% increase over baseline, and reduced false-news sharing by 8.2%. Combined Evaluation-plus-additional treatments were roughly twice as effective as Evaluation alone (discernment b = 0.054, p = 0.006; false-news sharing decrease 16.5%), and non-Evaluation treatments also increased discernment (b = 0.039, p < 0.001; false-news sharing decrease 11.0%).
- Effects did not significantly differ for political versus COVID-19 headlines (b = −0.017, p = 0.244) and did not significantly decay over successive trials (three-way interaction with trial number: b = −0.001, p = 0.062; excluding first four trials: b = −0.000, p = 0.770).
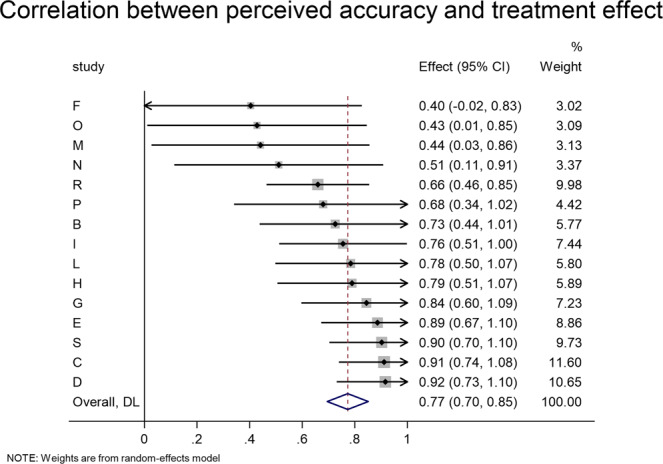
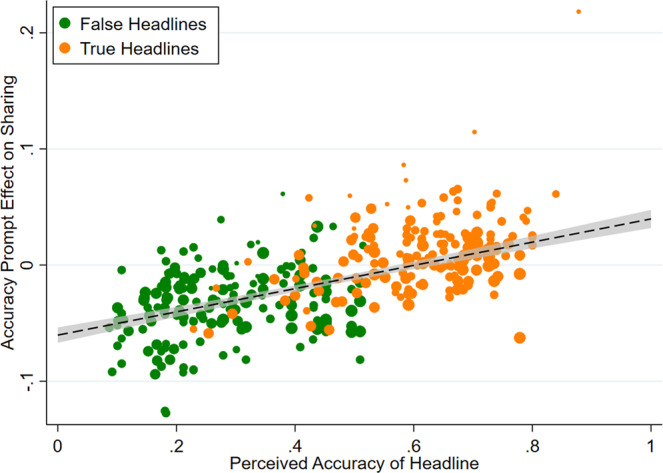
- Abstract reports no robust moderation by gender, race, political ideology, education, or value explicitly placed on accuracy, but effects were significantly larger for older, more reflective, and more attentive participants. At the item level, the treatment effect was strongly correlated with a headline’s out-of-sample perceived accuracy (meta-analytic r = 0.773, z = 19.417, p < 0.001; pooled r(355) = 0.663, p < 0.001).
Methods
- Design: internal meta-analysis of 20 experiments conducted by the authors’ group between 2017 and 2020, including all qualifying studies regardless of outcome and using identical analyses across studies.
- Data/sample: U.S. online survey participants (N = 26,863) recruited from Amazon Mechanical Turk, Lucid, or YouGov; participants indicated sharing intentions for true and false headlines about politics and/or COVID-19 after randomization to control or an accuracy prompt.
- Analysis: rating-level linear regressions with robust standard errors clustered on participant and headline, with sharing intentions rescaled to [0,1]; study-level coefficients were combined using random effects meta-analysis. Main specification included headline veracity, treatment condition, and their interaction.
Limitations
- Stated: the internal meta-analysis does not take external studies into account; only one external replication meeting inclusion criteria was included, and future work should examine studies from a wider range of research groups, across cultures, and in more field experiments. The authors also note the effects are modest in size, attention was measured post-treatment in the attentiveness analyses, and power for heterogeneity analyses across studies was comparatively low.
- Stated: MTurk samples are not nationally representative and can produce misleading individual-difference results, particularly related to politics; the authors privilege Lucid/YouGov results for individual-level moderation.
- Evident from the text: all included experiments came from the authors’ own group and used U.S. samples; the meta-analysis itself was not pre-registered and no protocol was prepared; Table 3 notes no adjustments were made for multiple comparisons.
Model-written summary. Check it against the paper before relying on it.
Integrity signals
Registry
Cites
Statistics
Figures
Verification
Claims the paper makes
73 Own result · 27 Not checked yet · 17 Own method · 14 Own interpretation · 3 No basis given · 1 Supported so far · 1 Partly supported · accuracy not yet measured
A result the paper reports from its own data — it cites no other source for it, so there is none to check. The quote shows it is in the paper.
In the paper
“but was significantly larger for older, more reflective, and more attentive participants.”
§ Accuracy prompts are a replicable and generalizable approach for reducing the spread of misinformation > Abstract
plaincorrelational- Asserted: passes — The authors put it forward as true.
- Checkable: passes — It can be checked against evidence.
- Load-bearing: unclear — It is unclear whether the paper’s conclusions depend on it.
- Based: passes — The paper gives a reason why it holds.
A result the paper reports from its own data — it cites no other source for it, so there is none to check. The quote shows it is in the paper.
In the paper
“The effect was not robustly moderated by gender, race, political ideology, education, or value explicitly placed on accuracy”
§ Accuracy prompts are a replicable and generalizable approach for reducing the spread of misinformation > Abstract
plainn = 26,863- Asserted: passes — The authors put it forward as true.
- Checkable: passes — It can be checked against evidence.
- Load-bearing: passes — The paper’s conclusions depend on it.
- Based: passes — The paper gives a reason why it holds.
A result the paper reports from its own data — it cites no other source for it, so there is none to check. The quote shows it is in the paper.
In the paper
“The magnitude of the effect did not significantly differ by content of headlines (politics compared with COVID-19 related news)”
- Also stated in: § Study-level differences · plain
“There were, however, no significant differences in the effect for political relative to COVID-19 headlines, b = −0.017, t = −1.21, p = 0.244.”
§ Accuracy prompts are a replicable and generalizable approach for reducing the spread of misinformation > Abstract
plain- Asserted: passes — The authors put it forward as true.
- Checkable: passes — It can be checked against evidence.
- Load-bearing: passes — The paper’s conclusions depend on it.
- Based: passes — The paper gives a reason why it holds.
- Also stated in: § Study-level differences · plain
A result the paper reports from its own data — it cites no other source for it, so there is none to check. The quote shows it is in the paper.
In the paper
“With respect to gender, we find no significant moderation in either the more representative samples or MTurk.”
§ Accuracy prompts are a replicable and generalizable approach for reducing the spread of misinformation > Results > Individual-level differences
plain- Asserted: passes — The authors put it forward as true.
- Checkable: passes — It can be checked against evidence.
- Load-bearing: unclear — It is unclear whether the paper’s conclusions depend on it.
- Based: passes — The paper gives a reason why it holds.
A result the paper reports from its own data — it cites no other source for it, so there is none to check. The quote shows it is in the paper.
In the paper
“and did not significantly decay over successive trials.”
- Also stated in: § Item-level differences · hedged
“Examining the three-way interaction between headline veracity, treatment dummy, and trial number, the meta-analytic estimate (with a total of N = 10,236 subjects) is not statistically significant, b = −0.001, z = −1.869, p = 0.062.”
§ Accuracy prompts are a replicable and generalizable approach for reducing the spread of misinformation > Abstract
plainn = 10,236- Asserted: passes — The authors put it forward as true.
- Checkable: passes — It can be checked against evidence.
- Load-bearing: passes — The paper’s conclusions depend on it.
- Based: passes — The paper gives a reason why it holds.
- Also stated in: § Item-level differences · hedged
A result the paper reports from its own data — it cites no other source for it, so there is none to check. The quote shows it is in the paper.
In the paper
“We find no significant moderation of the accuracy prompt effect by conservative (relative to liberal) ideology, either in the more representative samples or on MTurk.”
§ Accuracy prompts are a replicable and generalizable approach for reducing the spread of misinformation > Results > Individual-level differences
plain- Asserted: passes — The authors put it forward as true.
- Checkable: passes — It can be checked against evidence.
- Load-bearing: passes — The paper’s conclusions depend on it.
- Based: passes — The paper gives a reason why it holds.
A result the paper reports from its own data — it cites no other source for it, so there is none to check. The quote shows it is in the paper.
In the paper
“but was significantly larger for older, more reflective, and more attentive participants.”
§ Accuracy prompts are a replicable and generalizable approach for reducing the spread of misinformation > Abstract
plaincorrelational- Asserted: passes — The authors put it forward as true.
- Checkable: passes — It can be checked against evidence.
- Load-bearing: unclear — It is unclear whether the paper’s conclusions depend on it.
- Based: passes — The paper gives a reason why it holds.
A result the paper reports from its own data — it cites no other source for it, so there is none to check. The quote shows it is in the paper.
In the paper
“With respect to education, we find in both sets of samples that the accuracy prompts had a larger effect for college educated participants”
§ Accuracy prompts are a replicable and generalizable approach for reducing the spread of misinformation > Results > Individual-level differences
plaindirect- Asserted: passes — The authors put it forward as true.
- Checkable: passes — It can be checked against evidence.
- Load-bearing: unclear — It is unclear whether the paper’s conclusions depend on it.
- Based: passes — The paper gives a reason why it holds.
A result the paper reports from its own data — it cites no other source for it, so there is none to check. The quote shows it is in the paper.
In the paper
“The combination of Evaluation and additional treatments significantly increased sharing discernment (interaction between headline veracity and treatment dummies: b = 0.054, z = 2.765, p = 0.006, which translates into a 100.8% increase over baseline sharing discernment in the control condition of those experiments”
§ Accuracy prompts are a replicable and generalizable approach for reducing the spread of misinformation > Results
plaindirect- Asserted: passes — The authors put it forward as true.
- Checkable: passes — It can be checked against evidence.
- Load-bearing: passes — The paper’s conclusions depend on it.
- Based: passes — The paper gives a reason why it holds.
A result the paper reports from its own data — it cites no other source for it, so there is none to check. The quote shows it is in the paper.
In the paper
“Conversely, there was no significant effect on sharing intentions for true news (treatment dummy from model with true as holdout for headline veracity: b = 0.006, z = 1.44, p = 0.150; Fig. 3).”
§ Accuracy prompts are a replicable and generalizable approach for reducing the spread of misinformation > Results
plain- Asserted: passes — The authors put it forward as true.
- Checkable: passes — It can be checked against evidence.
- Load-bearing: passes — The paper’s conclusions depend on it.
- Based: passes — The paper gives a reason why it holds.
- It may state two separate claims as one. 29
- Probably not a substantial claim. 21
The sources with a verdict support this claim; the rest weren’t checked yet, have no full text we could read, or their verdicts aren’t rated yet.
In the paper
“Evidence for the role of inattention comes from experiments in which prompting participants to think about the concept of accuracy – for example, by asking them to evaluate the accuracy of a random headline at the beginning of the study – reduces the disconnect between accuracy judgments and sharing intentions, and thereby increases the quality of news shared24–26.”
§ Accuracy prompts are a replicable and generalizable approach for reducing the spread of misinformation > Introduction
What the sources say
- Not checked yetcites [24] Pennycook, G. et al. Shifting attention to accuracy can reduce misinformation online. Nature 592, 590–595. https://doi.org/10.1038/s41586-021-03344-2 (2021). source
- Supportedcites [25] Epstein, Z. et al. Developing an accuracy-prompt toolkit to reduce COVID-19 misinformation online. Harvard Kennedy Sch. Misinformation Rev. https://doi.org/10.37016/mr-2020-71 (2021). source
The Implications section says the treatments reduced the disconnect between accuracy judgments and sharing intentions by shifting attention to accuracy. It also reports that asking participants to judge a headline’s accuracy increased sharing discernment—the quality of news shared—by reducing sharing of false, but not true, headlines. (LLM, conf=0.94)
- Supportedcites [26] Pennycook, G., McPhetres, J., Zhang, Y., Lu, J. G. & Rand, D. G. Fighting COVID-19 misinformation on social media: Experimental evidence for a scalable accuracy nudge intervention. Psychol. Sci. 31, 770–780. https://doi.org/10.31234/OSF.IO/UHBK9 (2020). source
The Accuracy versus sharing section reports a gap between participants’ accuracy judgments and sharing intentions. The Materials and Procedure and Discussion sections report that rating one unrelated headline for accuracy before the sharing task more than doubled discernment between true and false headlines in subsequent sharing intentions. The measured outcome was intended, not observed, sharing. (LLM, conf=0.92)
plaindirect- Asserted: passes — The authors put it forward as true.
- Checkable: passes — It can be checked against evidence.
- Load-bearing: passes — The paper’s conclusions depend on it.
- Based: passes — The paper gives a reason why it holds.
It may state two separate claims as one.
The cited sources support only part of this claim — read each source’s verdict below.
In the paper
“MTurk offers convenience samples and makes no attempt to be nationally representative”
§ Accuracy prompts are a replicable and generalizable approach for reducing the spread of misinformation > Discussion
What the sources say
- Partly supportedcites [51] Chandler, J., Rosenzweig, C., Moss, A. J., Robinson, J. & Litman, L. Online panels in social science research: Expanding sampling methods beyond Mechanical Turk. Behav. Res. Methods 51, 2022–2038 (2019). sourceExperimental — accuracy not yet measured
The discussion of MTurk’s limitations (page unavailable) says its workers look very little like the US population and identifies substantial demographic differences. The Method section describes recruiting available MTurk workers, consistent with a convenience sample. The paper does not establish the stronger claim that MTurk makes no attempt to be nationally representative. (LLM, conf=0.83)
- Supportedcites [52] Boas, T. C., Christenson, D. P. & Glick, D. M. Recruiting large online samples in the United States and India: Facebook, Mechanical Turk, and Qualtrics. Polit. Sci. Res. Methods 8, 232–250 (2020). source
The paper describes MTurk as a source of online convenience samples (Abstract and Conclusion). Its Demographics section compares the US MTurk sample with a probability sample and reports substantial demographic differences. This supports the paraphrase that MTurk recruitment does not aim to produce a nationally representative sample. (LLM, conf=0.88)
- Supportedcites [53] Berinsky, A. J., Huber, G. A. & Lenz, G. S. Evaluating online labor markets for experimental research: amazon.com’s mechanical turk. Polit. Anal. 20, 351–368 (2012). source
Section 4.1 describes recruiting the MTurk sample through a posted survey task rather than a nationally representative sampling procedure. The discussion in section 22 explicitly treats MTurk as a means of conducting experiments 'instead of a representative sample.' The authors also note that MTurk samples can be more diverse than other convenience samples; that comparison does not make them nationally representative. (LLM, conf=0.85)
plain- Asserted: passes — The authors put it forward as true.
- Checkable: passes — It can be checked against evidence.
- Load-bearing: passes — The paper’s conclusions depend on it.
- Based: passes — The paper gives a reason why it holds.
It may state two separate claims as one.
- Partly supported
A result the paper reports from its own data — it cites no other source for it, so there is none to check. The quote shows it is in the paper.
In the paper
“With respect to age, we find that the accuracy prompts have a significantly larger effect for older participants in the more representative samples but not MTurk”
§ Accuracy prompts are a replicable and generalizable approach for reducing the spread of misinformation > Results > Individual-level differences
plaindirect- Asserted: passes — The authors put it forward as true.
- Checkable: passes — It can be checked against evidence.
- Load-bearing: unclear — It is unclear whether the paper’s conclusions depend on it.
- Based: passes — The paper gives a reason why it holds.
It may state two separate claims as one.
A result the paper reports from its own data — it cites no other source for it, so there is none to check. The quote shows it is in the paper.
In the paper
“With respect to participants who identified as white versus other ethnicity or racial categories, we also find no significant moderation in either set of subject pools, and no significant differences in baseline discernment.”
§ Accuracy prompts are a replicable and generalizable approach for reducing the spread of misinformation > Results > Individual-level differences
plain- Asserted: passes — The authors put it forward as true.
- Checkable: passes — It can be checked against evidence.
- Load-bearing: passes — The paper’s conclusions depend on it.
- Based: passes — The paper gives a reason why it holds.
It may state two separate claims as one.
A result the paper reports from its own data — it cites no other source for it, so there is none to check. The quote shows it is in the paper.
In the paper
“Overall, accuracy prompts increased the quality of news that people share (sharing discernment) relative to control”
- Also stated in: § Results · plain
“We find that accuracy prompts significantly increase sharing discernment (interaction between headline veracity and treatment dummies: b = 0.038, z = 7.102, p < 0.001; Fig. 1), which translates into a 71.7% increase over the meta-analytic estimate of baseline sharing discernment in the control condition”
§ Accuracy prompts are a replicable and generalizable approach for reducing the spread of misinformation > Abstract
plaindirectn = 26,863 ·- Asserted: passes — The authors put it forward as true.
- Checkable: passes — It can be checked against evidence.
- Load-bearing: passes — The paper’s conclusions depend on it.
- Based: passes — The paper gives a reason why it holds.
It may state two separate claims as one.
- Also stated in: § Results · plain
A result the paper reports from its own data — it cites no other source for it, so there is none to check. The quote shows it is in the paper.
In the paper
“primarily by reducing sharing intentions for false headlines by 10% relative to control in these studies.”
- Also stated in: § Results · plain
“This increase in discernment was driven by accuracy prompts significantly decreasing sharing intentions for false news (treatment dummy: b = −0.034, z = 7.851, p < 0.001; Fig. 2), which translates into a 10% decrease relative to the meta-analytic estimate of baseline sharing intentions for false news in the control condition”
§ Accuracy prompts are a replicable and generalizable approach for reducing the spread of misinformation > Abstract
plaindirectn = 26,863 ·- Asserted: passes — The authors put it forward as true.
- Checkable: passes — It can be checked against evidence.
- Load-bearing: passes — The paper’s conclusions depend on it.
- Based: passes — The paper gives a reason why it holds.
It may state two separate claims as one.
- Also stated in: § Results · plain
A result the paper reports from its own data — it cites no other source for it, so there is none to check. The quote shows it is in the paper.
In the paper
“This increase in discernment was again largely driven by a significant decrease in sharing intentions for false news, b = −0.039, z = −5.161, p < 0.001, which translates into a 11.0% decrease relative to baseline sharing intentions for false news in the control condition of those experiments”
§ Accuracy prompts are a replicable and generalizable approach for reducing the spread of misinformation > Results
plaindirect- Asserted: passes — The authors put it forward as true.
- Checkable: passes — It can be checked against evidence.
- Load-bearing: passes — The paper’s conclusions depend on it.
- Based: passes — The paper gives a reason why it holds.
It may state two separate claims as one.
A result the paper reports from its own data — it cites no other source for it, so there is none to check. The quote shows it is in the paper.
In the paper
“The non-evaluation treatments significantly increased sharing discernment (interaction between headline veracity and treatment dummies: b = 0.039, z = 4.974, p < 0.001), which translates into a 70.9% increase over baseline sharing discernment in the control condition of those experiments”
§ Accuracy prompts are a replicable and generalizable approach for reducing the spread of misinformation > Results
plaindirect- Asserted: passes — The authors put it forward as true.
- Checkable: passes — It can be checked against evidence.
- Load-bearing: passes — The paper’s conclusions depend on it.
- Based: passes — The paper gives a reason why it holds.
It may state two separate claims as one.
A result the paper reports from its own data — it cites no other source for it, so there is none to check. The quote shows it is in the paper.
In the paper
“This increase in discernment was again largely driven by the Evaluation treatment significantly decreasing sharing intentions for false news (treatment dummy: b = −0.027, z = −5.548, p < 0.001), which translates into an 8.2% decrease relative to baseline sharing intentions for false news in the control condition”
§ Accuracy prompts are a replicable and generalizable approach for reducing the spread of misinformation > Results
plaindirect- Asserted: passes — The authors put it forward as true.
- Checkable: passes — It can be checked against evidence.
- Load-bearing: passes — The paper’s conclusions depend on it.
- Based: passes — The paper gives a reason why it holds.
It may state two separate claims as one.
A result the paper reports from its own data — it cites no other source for it, so there is none to check. The quote shows it is in the paper.
In the paper
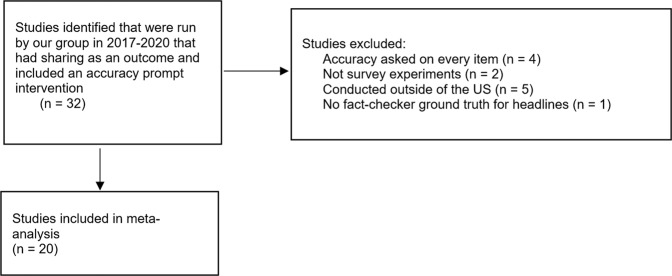
“In total, we meta-analyze k = 20 experiments, with a total of N = 26,863 participants (see Table 2).”
§ Accuracy prompts are a replicable and generalizable approach for reducing the spread of misinformation > Introduction
plainn = 26,863- Asserted: passes — The authors put it forward as true.
- Checkable: passes — It can be checked against evidence.
- Load-bearing: fails — The paper’s conclusions may not depend on it.
- Based: passes — The paper gives a reason why it holds.
Probably not a substantial claim. The paper’s conclusions may not depend on it. It may state two separate claims as one.
A result the paper reports from its own data — it cites no other source for it, so there is none to check. The quote shows it is in the paper.
In the paper
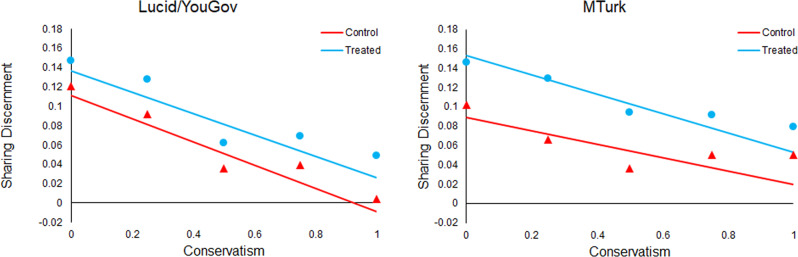
“In the more representative samples, across all three measures we find that people who identify as Republican were significantly less discerning in their baseline sharing (in line with what has been observed previously), but partisanship does not significantly moderate the accuracy prompt effect on discernment.”
§ Accuracy prompts are a replicable and generalizable approach for reducing the spread of misinformation > Results > Individual-level differences
plain- Asserted: passes — The authors put it forward as true.
- Checkable: passes — It can be checked against evidence.
- Load-bearing: passes — The paper’s conclusions depend on it.
- Based: passes — The paper gives a reason why it holds.
It may state two separate claims as one.
A result the paper reports from its own data — it cites no other source for it, so there is none to check. The quote shows it is in the paper.
In the paper
“Interestingly, women are significantly less discerning in the control condition on MTurk, but not in the more representative samples.”
§ Accuracy prompts are a replicable and generalizable approach for reducing the spread of misinformation > Results > Individual-level differences
plaincorrelational- Asserted: passes — The authors put it forward as true.
- Checkable: passes — It can be checked against evidence.
- Load-bearing: unclear — It is unclear whether the paper’s conclusions depend on it.
- Based: passes — The paper gives a reason why it holds.
It may state two separate claims as one.
A result the paper reports from its own data — it cites no other source for it, so there is none to check. The quote shows it is in the paper.
In the paper
“On MTurk, we see the opposite pattern: Republicans were not significantly less discerning in their baseline sharing, yet partisanship does significantly moderate the accuracy prompt on discernment, with the prompts working less well for Republicans”
§ Accuracy prompts are a replicable and generalizable approach for reducing the spread of misinformation > Results > Individual-level differences
plaindirect- Asserted: passes — The authors put it forward as true.
- Checkable: passes — It can be checked against evidence.
- Load-bearing: unclear — It is unclear whether the paper’s conclusions depend on it.
- Based: passes — The paper gives a reason why it holds.
It may state two separate claims as one.
A result the paper reports from its own data — it cites no other source for it, so there is none to check. The quote shows it is in the paper.
In the paper
“Critically, the pattern of results for this Twitter data matches what we report above for the survey experiments: Users who are more conservative shared lower quality information at baseline, but we do not find evidence that ideology moderated the effect of the accuracy prompts.”
§ Accuracy prompts are a replicable and generalizable approach for reducing the spread of misinformation > Results > Individual-level differences
plain- Asserted: passes — The authors put it forward as true.
- Checkable: passes — It can be checked against evidence.
- Load-bearing: passes — The paper’s conclusions depend on it.
- Based: passes — The paper gives a reason why it holds.
It may state two separate claims as one.
A result the paper reports from its own data — it cites no other source for it, so there is none to check. The quote shows it is in the paper.
In the paper
“Importantly, we do find a significant negative relationship between conservatism and baseline sharing discernment (i.e., overall quality of news that is shared) in the control, and this is evident in both sets of subject pools (although the relationship is twice as large in the more representative samples).”
§ Accuracy prompts are a replicable and generalizable approach for reducing the spread of misinformation > Results > Individual-level differences
plaincorrelational- Asserted: passes — The authors put it forward as true.
- Checkable: passes — It can be checked against evidence.
- Load-bearing: unclear — It is unclear whether the paper’s conclusions depend on it.
- Based: passes — The paper gives a reason why it holds.
It may state two separate claims as one.
A result the paper reports from its own data — it cites no other source for it, so there is none to check. The quote shows it is in the paper.
In the paper
“Consistent with our proposed mechanism, the treatment effect is strongly correlated with perceived accuracy in all experiments (Fig. 4): the meta-analytic estimate of the correlation is r = 0.773, z = 19.417, p < 0.001”
§ Accuracy prompts are a replicable and generalizable approach for reducing the spread of misinformation > Results > Item-level differences
boostedcorrelational- Asserted: passes — The authors put it forward as true.
- Checkable: passes — It can be checked against evidence.
- Load-bearing: passes — The paper’s conclusions depend on it.
- Based: passes — The paper gives a reason why it holds.
It may state two separate claims as one.
- Rests on an assumption: Out-of-sample average accuracy ratings of headlines are valid measures of participants’ perceived accuracy.
A result the paper reports from its own data — it cites no other source for it, so there is none to check. The quote shows it is in the paper.
In the paper
“Here, we provide evidence, across 20 experiments with U.S. samples, that a variety of accuracy prompts robustly increased social media users’ sharing discernment by decreasing their intentions to share a wide range of false news headlines about politics and COVID-19.”
§ Accuracy prompts are a replicable and generalizable approach for reducing the spread of misinformation > Discussion
boosteddirect- Asserted: passes — The authors put it forward as true.
- Checkable: passes — It can be checked against evidence.
- Load-bearing: passes — The paper’s conclusions depend on it.
- Based: passes — The paper gives a reason why it holds.
It may state two separate claims as one.
- Rests on an assumption: Participants' self-reported likelihood of sharing headlines is a valid proxy for their actual sharing behavior on social media.
A result the paper reports from its own data — it cites no other source for it, so there is none to check. The quote shows it is in the paper.
In the paper
“including this study in our main analysis does not meaningfully alter the results (see SI Section 4)”
§ Accuracy prompts are a replicable and generalizable approach for reducing the spread of misinformation > Discussion
plain- Asserted: passes — The authors put it forward as true.
- Checkable: passes — It can be checked against evidence.
- Load-bearing: fails — The paper’s conclusions may not depend on it.
- Based: passes — The paper gives a reason why it holds.
Probably not a substantial claim. The paper’s conclusions may not depend on it.
- Rests on an assumption: Participants' self-reported likelihood of sharing headlines is a valid proxy for their actual sharing behavior on social media.
A conclusion the paper draws from its own results — it cites no other source for it, so there is none to check. The quote shows it is in the paper.
In the paper
“Another advantage is that accuracy prompts do not require stakeholders such as technology companies or government regulators to decide what is true versus false.”
§ Accuracy prompts are a replicable and generalizable approach for reducing the spread of misinformation > Introduction
plain- Asserted: passes — The authors put it forward as true.
- Checkable: passes — It can be checked against evidence.
- Load-bearing: passes — The paper’s conclusions depend on it.
- Based: fails — The paper may give no reason why it holds.
Probably not a substantial claim. The paper may give no reason why it holds.
In the paper
“Ironically, this occurs despite the fact that an overwhelming majority of participants say that it is important to only share accurate news24.”
§ Accuracy prompts are a replicable and generalizable approach for reducing the spread of misinformation > Introduction
What the sources say
- Not checked yetcites [24] Pennycook, G. et al. Shifting attention to accuracy can reduce misinformation online. Nature 592, 590–595. https://doi.org/10.1038/s41586-021-03344-2 (2021). source
plain- Asserted: passes — The authors put it forward as true.
- Checkable: passes — It can be checked against evidence.
- Load-bearing: fails — The paper’s conclusions may not depend on it.
- Based: passes — The paper gives a reason why it holds.
Probably not a substantial claim. The paper’s conclusions may not depend on it.
What the paper did — it cites no source for this, so there is none to check. The quote shows it is in the paper.
In the paper
“As a result, study selection was broad and not susceptible to motivated choices about inclusion.”
§ Accuracy prompts are a replicable and generalizable approach for reducing the spread of misinformation > Introduction
plain- Asserted: passes — The authors put it forward as true.
- Checkable: passes — It can be checked against evidence.
- Load-bearing: passes — The paper’s conclusions depend on it.
- Based: passes — The paper gives a reason why it holds.
It may state two separate claims as one.
What the paper did — it cites no source for this, so there is none to check. The quote shows it is in the paper.
In the paper
“Furthermore, we included all interventions that could be construed as accuracy prompts – i.e., interventions that occurred prior to the sharing task, that invoked accuracy in some way (such that the concept of accuracy would be primed), and did not provide any specific information about the veracity of any particular headlines (were “content neutral”).”
§ Accuracy prompts are a replicable and generalizable approach for reducing the spread of misinformation > Introduction
plain- Asserted: passes — The authors put it forward as true.
- Checkable: passes — It can be checked against evidence.
- Load-bearing: passes — The paper’s conclusions depend on it.
- Based: passes — The paper gives a reason why it holds.
Probably not a substantial claim.
In the paper
“Instead, they leverage users’ own abilities to identify misinformation and take advantage of the fact that most people want to share accurate content24.”
§ Accuracy prompts are a replicable and generalizable approach for reducing the spread of misinformation > Introduction
What the sources say
- Not checked yetcites [24] Pennycook, G. et al. Shifting attention to accuracy can reduce misinformation online. Nature 592, 590–595. https://doi.org/10.1038/s41586-021-03344-2 (2021). source
plaindirect- Asserted: passes — The authors put it forward as true.
- Checkable: passes — It can be checked against evidence.
- Load-bearing: passes — The paper’s conclusions depend on it.
- Based: passes — The paper gives a reason why it holds.
It may state two separate claims as one.
In the paper
“This approach is superior to simply focusing on the sharing of false news because an intervention that decreases the sharing of both true and false news equally would not indicate that people are focusing more on accuracy40.”
§ Accuracy prompts are a replicable and generalizable approach for reducing the spread of misinformation > Introduction
What the sources say
- Not checked yetcites [40] Pennycook, G. & Rand, D. G. Lack of partisan bias in the identification of fake (versus real) news. Trends Cogn. Sci. 25, 725–726 (2021). source
plaindirect- Asserted: passes — The authors put it forward as true.
- Checkable: passes — It can be checked against evidence.
- Load-bearing: passes — The paper’s conclusions depend on it.
- Based: passes — The paper gives a reason why it holds.
It may state two separate claims as one.
A conclusion the paper draws from its own results — it cites no other source for it, so there is none to check. The quote shows it is in the paper.
In the paper
“Although not a perfectly controlled comparison, the observation that the combined treatments were roughly twice as effective as Evaluation alone suggests that there are substantial gains from stacking accuracy prompt interventions.”
§ Accuracy prompts are a replicable and generalizable approach for reducing the spread of misinformation > Results
hedgeddirect- Asserted: passes — The authors put it forward as true.
- Checkable: passes — It can be checked against evidence.
- Load-bearing: passes — The paper’s conclusions depend on it.
- Based: passes — The paper gives a reason why it holds.
It may state two separate claims as one.
What the paper did — it cites no source for this, so there is none to check. The quote shows it is in the paper.
In the paper
“Importantly, although our meta-analysis was not itself pre-registered, we made the decision about what to include before conducting the meta-analysis.”
§ Accuracy prompts are a replicable and generalizable approach for reducing the spread of misinformation > Introduction
plain- Asserted: passes — The authors put it forward as true.
- Checkable: passes — It can be checked against evidence.
- Load-bearing: passes — The paper’s conclusions depend on it.
- Based: passes — The paper gives a reason why it holds.
Probably not a substantial claim. It may state two separate claims as one.
None of the sources cited for this claim have been checked yet.
In the paper
“There are two main threats to the validity of meta-analytic results: the systematic omission of studies (e.g., publication bias suppressing studies with null results36,37), and the flexible selection of analysis approaches within each study inflating the rate of false positives (e.g., p-hacking38).”
§ Accuracy prompts are a replicable and generalizable approach for reducing the spread of misinformation > Introduction
What the sources say
- Not checked yetcites [36] Sutton, A. J., Song, F., Gilbody, S. M. & Abrams, K. R. Modelling publication bias in meta-analysis: A review. Stat. Methods Med. Res. 9, 421–445 (2000). source
- Not checked yetcites [37] Stanley, T. D. Limitations of PET-PEESE and other meta-analysis methods. Soc. Psychol. Personal. Sci. 8, 581–591 (2017). source
- Not checked yetcites [38] Simmons, J. P., Nelson, L. D. & Simonsohn, U. False-positive psychology: Undisclosed flexibility in data collection and analysis allows presenting anything as significant. Psychol. Sci. 22, 1359–1366 (2011). source
plaindirect- Asserted: passes — The authors put it forward as true.
- Checkable: passes — It can be checked against evidence.
- Load-bearing: passes — The paper’s conclusions depend on it.
- Based: passes — The paper gives a reason why it holds.
It may state two separate claims as one.
None of the sources cited for this claim have been checked yet.
In the paper
“This worse baseline discernment aligns with real-world sharing data where conservatives were found to share more fake news on Twitter10 and Facebook12.”
§ Accuracy prompts are a replicable and generalizable approach for reducing the spread of misinformation > Results > Individual-level differences
What the sources say
- Not checked yetcites [10] Grinberg, N., Joseph, K., Friedland, L., Swire-Thompson, B. & Lazer, D. Fake news on twitter during the 2016 U.S. Presidential election. Science 363, 374–378 (2019). source
- Not checked yetcites [12] Guess, A. M., Nagler, J. & Tucker, J. Less than you think: Prevalence and predictors of fake news dissemination on Facebook. Sci. Adv. 5, eaau4586 (2019). source
plaincorrelational- Asserted: passes — The authors put it forward as true.
- Checkable: passes — It can be checked against evidence.
- Load-bearing: unclear — It is unclear whether the paper’s conclusions depend on it.
- Based: passes — The paper gives a reason why it holds.
It may state two separate claims as one.
What the paper did — it cites no source for this, so there is none to check. The quote shows it is in the paper.
In the paper
“Although we have comparatively low power for statistically analyzing heterogeneity across studies (16 to 20 studies, depending on the individual difference),”
§ Accuracy prompts are a replicable and generalizable approach for reducing the spread of misinformation > Results > Individual-level differences
plain- Asserted: passes — The authors put it forward as true.
- Checkable: passes — It can be checked against evidence.
- Load-bearing: fails — The paper’s conclusions may not depend on it.
- Based: passes — The paper gives a reason why it holds.
Probably not a substantial claim. The paper’s conclusions may not depend on it.
What the paper did — it cites no source for this, so there is none to check. The quote shows it is in the paper.
In the paper
“we have comparatively low power for statistically analyzing heterogeneity across studies (16 to 20 studies, depending on the individual difference)”
§ Accuracy prompts are a replicable and generalizable approach for reducing the spread of misinformation > Results > Individual-level differences
plain- Asserted: passes — The authors put it forward as true.
- Checkable: passes — It can be checked against evidence.
- Load-bearing: fails — The paper’s conclusions may not depend on it.
- Based: passes — The paper gives a reason why it holds.
Probably not a substantial claim. The paper’s conclusions may not depend on it.
None of the sources cited for this claim have been checked yet.
In the paper
“given the dissociation between accuracy judgments and sharing intentions observed in past work24–26”
§ Accuracy prompts are a replicable and generalizable approach for reducing the spread of misinformation > Discussion
What the sources say
- Not checked yetcites [24] Pennycook, G. et al. Shifting attention to accuracy can reduce misinformation online. Nature 592, 590–595. https://doi.org/10.1038/s41586-021-03344-2 (2021). source
- Not checked yetcites [25] Epstein, Z. et al. Developing an accuracy-prompt toolkit to reduce COVID-19 misinformation online. Harvard Kennedy Sch. Misinformation Rev. https://doi.org/10.37016/mr-2020-71 (2021). source
- Not checked yetcites [26] Pennycook, G., McPhetres, J., Zhang, Y., Lu, J. G. & Rand, D. G. Fighting COVID-19 misinformation on social media: Experimental evidence for a scalable accuracy nudge intervention. Psychol. Sci. 31, 770–780. https://doi.org/10.31234/OSF.IO/UHBK9 (2020). source
plain- Asserted: passes — The authors put it forward as true.
- Checkable: passes — It can be checked against evidence.
- Load-bearing: fails — The paper’s conclusions may not depend on it.
- Based: passes — The paper gives a reason why it holds.
Probably not a substantial claim. The paper’s conclusions may not depend on it.
In the paper
“An important caveat for these analyses is that attention was measured post-treatment, which has the potential to undermine inferences drawn from these data43”
§ Accuracy prompts are a replicable and generalizable approach for reducing the spread of misinformation > Results > Individual-level differences
What the sources say
- Not checked yetcites [43] Montgomery, J. M., Nyhan, B. & Torres, M. How conditioning on posttreatment variables can ruin your experiment and what to do about it. Am. J. Pol. Sci. 62, 760–775 (2018). source
hedged- Asserted: passes — The authors put it forward as true.
- Checkable: passes — It can be checked against evidence.
- Load-bearing: fails — The paper’s conclusions may not depend on it.
- Based: passes — The paper gives a reason why it holds.
Probably not a substantial claim. The paper’s conclusions may not depend on it.
None of the sources cited for this claim have been checked yet.
In the paper
“Prior work indicates that cognitive reflection is positively associated with truth discernment when making accuracy judgments18,45”
§ Accuracy prompts are a replicable and generalizable approach for reducing the spread of misinformation > Discussion
What the sources say
- Not checked yetcites [18] Pennycook, G. & Rand, D. G. The psychology of fake news. Trends Cogn. Sci. 25, 388–402 https://doi.org/10.1016/j.tics.2021.02.007 (2021). source
- Not checked yetcites [45] Pennycook, G. & Rand, D. G. Lazy, not biased: Susceptibility to partisan fake news is better explained by lack of reasoning than by motivated reasoning. Cognition 188, 39–50 (2019). source
hedgedcorrelational- Asserted: passes — The authors put it forward as true.
- Checkable: passes — It can be checked against evidence.
- Load-bearing: fails — The paper’s conclusions may not depend on it.
- Based: passes — The paper gives a reason why it holds.
Probably not a substantial claim. The paper’s conclusions may not depend on it.
A conclusion the paper draws from its own results — it cites no other source for it, so there is none to check. The quote shows it is in the paper.
In the paper
“Thus, if a group of participants is targeted who have a very difficult time distinguishing between true and false content, or if misinformation is identified that the majority of a particular group of people believe to be true, then accuracy prompts will not improve sharing discernment.”
§ Accuracy prompts are a replicable and generalizable approach for reducing the spread of misinformation > Discussion
plain- Asserted: passes — The authors put it forward as true.
- Checkable: passes — It can be checked against evidence.
- Load-bearing: passes — The paper’s conclusions depend on it.
- Based: passes — The paper gives a reason why it holds.
It may state two separate claims as one.
- Rests on an assumption: Participants' self-reported likelihood of sharing headlines is a valid proxy for their actual sharing behavior on social media.
What the paper did — it cites no source for this, so there is none to check. The quote shows it is in the paper.
In the paper
“In most cases, headlines were selected for inclusion based on prior pre-testing; for all experiments using political headlines, the headlines were balanced on partisan lean based on the pre-test results”
§ Accuracy prompts are a replicable and generalizable approach for reducing the spread of misinformation > Methods > Experimental designs
plain- Asserted: passes — The authors put it forward as true.
- Checkable: passes — It can be checked against evidence.
- Load-bearing: fails — The paper’s conclusions may not depend on it.
- Based: passes — The paper gives a reason why it holds.
Probably not a substantial claim. The paper’s conclusions may not depend on it. It may state two separate claims as one.
What the paper did — it cites no source for this, so there is none to check. The quote shows it is in the paper.
In the paper
“Although these inclusion and exclusion criteria were determined prior to running the meta-analysis”
§ Accuracy prompts are a replicable and generalizable approach for reducing the spread of misinformation > Methods > Study selection
plain- Asserted: passes — The authors put it forward as true.
- Checkable: passes — It can be checked against evidence.
- Load-bearing: fails — The paper’s conclusions may not depend on it.
- Based: passes — The paper gives a reason why it holds.
Probably not a substantial claim. The paper’s conclusions may not depend on it.
What the paper did — it cites no source for this, so there is none to check. The quote shows it is in the paper.
In the paper
“the meta-analysis was not pre-registered and no protocol was prepared”
§ Accuracy prompts are a replicable and generalizable approach for reducing the spread of misinformation > Methods > Study selection
plain- Asserted: passes — The authors put it forward as true.
- Checkable: passes — It can be checked against evidence.
- Load-bearing: fails — The paper’s conclusions may not depend on it.
- Based: passes — The paper gives a reason why it holds.
Probably not a substantial claim. The paper’s conclusions may not depend on it. It may state two separate claims as one.
In the paper
“scholars have argued that replicable priming effects are restricted to “perceptual primes” (e.g., as in semantic priming), which involve (for example) perceiving an ambiguous stimuli in a way that is more consistent with a prime58”
§ Accuracy prompts are a replicable and generalizable approach for reducing the spread of misinformation > Discussion
What the sources say
- Not checked yetcites [58] Harris, C., Rohrer, D. & Pashler, H. A train wreck by any other name. Psychological Inq. 32, 17–23 (2021). source
plain- Asserted: fails — The authors may not put it forward as true.
- Checkable: passes — It can be checked against evidence.
- Load-bearing: fails — The paper’s conclusions may not depend on it.
- Based: passes — The paper gives a reason why it holds.
Probably not a substantial claim. The authors may not put it forward as true. The paper’s conclusions may not depend on it.
In the paper
“This form of priming is said to occur when “a stimulus influences subsequent behavior without conscious guidance or intention”55”
§ Accuracy prompts are a replicable and generalizable approach for reducing the spread of misinformation > Discussion
What the sources say
- Not checked yetcites [55] Sherman, J. W. & Rivers, A. M. There’s nothing social about social priming: derailing the “Train Wreck”. Psychol. Inq. 32, 1–11 (2021). source
hedgeddirect- Asserted: passes — The authors put it forward as true.
- Checkable: fails — It may be too vague to check against evidence.
- Load-bearing: fails — The paper’s conclusions may not depend on it.
- Based: passes — The paper gives a reason why it holds.
Probably not a substantial claim. It may be too vague to check against evidence. The paper’s conclusions may not depend on it.
What the paper did — it cites no source for this, so there is none to check. The quote shows it is in the paper.
In the paper
“Although the benefit of internal meta-analyses is that one can be confident that the entire “file-drawer” is included and that p-hacking has been avoided”
§ Accuracy prompts are a replicable and generalizable approach for reducing the spread of misinformation > Discussion
plaindirect- Asserted: passes — The authors put it forward as true.
- Checkable: passes — It can be checked against evidence.
- Load-bearing: fails — The paper’s conclusions may not depend on it.
- Based: fails — The paper may give no reason why it holds.
Probably not a substantial claim. The paper’s conclusions may not depend on it. The paper may give no reason why it holds. It may state two separate claims as one.
What the paper did — it cites no source for this, so there is none to check. The quote shows it is in the paper.
In the paper
“Both authors agreed on the classification of each study as eligible versus ineligible.”
§ Accuracy prompts are a replicable and generalizable approach for reducing the spread of misinformation > Methods > Study selection
plain- Asserted: passes — The authors put it forward as true.
- Checkable: passes — It can be checked against evidence.
- Load-bearing: fails — The paper’s conclusions may not depend on it.
- Based: passes — The paper gives a reason why it holds.
Probably not a substantial claim. The paper’s conclusions may not depend on it.
What the paper did — it cites no source for this, so there is none to check. The quote shows it is in the paper.
In the paper
“Many studies also prevented respondents who failed trivial attention checks at the study outset from participating, but since no data was collected from these participants, we cannot assess the impact of extreme inattention.”
§ Accuracy prompts are a replicable and generalizable approach for reducing the spread of misinformation > Methods > Individual difference measures
plain- Asserted: passes — The authors put it forward as true.
- Checkable: passes — It can be checked against evidence.
- Load-bearing: fails — The paper’s conclusions may not depend on it.
- Based: passes — The paper gives a reason why it holds.
Probably not a substantial claim. The paper’s conclusions may not depend on it. It may state two separate claims as one.
None of the sources cited for this claim have been checked yet.
In the paper
“Several prominent examples of behavioral priming have proven difficult to replicate56,57”
§ Accuracy prompts are a replicable and generalizable approach for reducing the spread of misinformation > Discussion
What the sources say
plain- Asserted: passes — The authors put it forward as true.
- Checkable: passes — It can be checked against evidence.
- Load-bearing: fails — The paper’s conclusions may not depend on it.
- Based: passes — The paper gives a reason why it holds.
Probably not a substantial claim. The paper’s conclusions may not depend on it.
What the paper did — it cites no source for this, so there is none to check. The quote shows it is in the paper.
In the paper
“We use random effects meta-analysis, rather than fixed-effects meta-analysis, because there is reason to expect that the true effect size varies across studies”
§ Accuracy prompts are a replicable and generalizable approach for reducing the spread of misinformation > Methods > Analysis approach
plain- Asserted: passes — The authors put it forward as true.
- Checkable: passes — It can be checked against evidence.
- Load-bearing: passes — The paper’s conclusions depend on it.
- Based: passes — The paper gives a reason why it holds.
Probably not a substantial claim.
The paper relies on this without support.
The massive networked character of social media platforms means that when people choose to share misinformation online, it has the potential to reach and influence a large number of others.
“The massive networked character of social media platforms means that when people choose to share misinformation online, it has the potential to reach (and influence) a large number of others.”
The paper relies on this without support.
Out-of-sample average accuracy ratings of headlines are valid measures of participants’ perceived accuracy.
“for 15 experiments we have out-of-sample ratings of the average accuracy of each headline (e.g., from pre-tests, or from other experiments or conditions where participants made accuracy ratings rather than indicating sharing intentions).”
The paper relies on this without support.
Participants' self-reported likelihood of sharing headlines is a valid proxy for their actual sharing behavior on social media.
“participants were asked to indicate their likelihood of sharing a set of true and false headlines”
“sharing decisions (the dependent variable) are rescaled such that the minimum possible value is 0 (indicating a very low likelihood of sharing) and the maximum possible value is 1 (indicating a very high likelihood of sharing)”
The paper relies on this without support.
The professional fact-checker ratings of headline veracity are accurate.
“the veracity of which were rated by professional fact-checkers”
The paper relies on this without support.
The accuracy prompts used in the experiments are representative of accuracy prompts that could be deployed on social media platforms.
“a variety of accuracy prompts”
Claims other papers make about this one
Each is checked against this paper’s own text: does it say what the citing paper says it does?
The cited source says what the claim attributes to it.
In the citing paper
“For example, making the concept of accuracy salient can reduce the sharing of fake news, without adversely affecting the dissemination of accurate news (34).”
From The impact of generative artificial intelligence on socioeconomic inequalities and policy making (2024) · cites this paper as [34]
Statistics recomputed
Every reported test result, recomputed from its test statistic and degrees of freedom. A result shows as not adding up only once an independent check has confirmed it.
- Consistentz = 7.102reported p < .001 · recomputed p < .001
“z = 7.102, p < .001”
- Consistentz = 6.636reported p < .001 · recomputed p < .001
“z = 6.636, p < .001”
- Consistentz = 7.851reported p < .001 · recomputed p < .001
“z = 7.851, p < .001”
- Consistentz = 15.695reported p < .001 · recomputed p < .001
“z = 15.695, p < .001”
- Consistentz = 1.44reported p = .15 · recomputed p = .150
“z = 1.44, p = .150”
- ConsistentQ(19) = 88.53reported p < .001 · recomputed p < .001
“Q(19) = 88.53, p < .001”
- ConsistentQ(19) = 23.33reported p = .223 · recomputed p = .223
“Q(19) = 23.33, p = .223”
- ConsistentQ(19) = 22.42reported p = .264 · recomputed p = .264
“Q(19) = 22.42, p = .264”
- Consistentz = 7.823reported p < .001 · recomputed p < .001
“z = 7.823, p < .001”
- Consistentz = 7.2reported p < .001 · recomputed p < .001
“z = 7.2, p < .001”
- Consistentz = -5.548reported p < .001 · recomputed p < .001
“z = −5.548, p < .001”
- Consistentz = 14.1reported p < .001 · recomputed p < .001
“z = 14.1, p < .001”
- Consistentz = 1.89reported p = .059 · recomputed p = .059
“z = 1.89, p = .059”
- Consistentz = 2.765reported p = .006 · recomputed p = .006
“z = 2.765, p = .006”
- Consistentz = 2.92reported p = .003 · recomputed p = .004
“z = 2.92, p = .003”
- Consistentz = -2.99reported p = .003 · recomputed p = .003
“z = −2.990, p = .003”
- Consistentz = 8.7reported p < .001 · recomputed p < .001
“z = 8.7, p < .001”
- Consistentz = 0.775reported p = .438 · recomputed p = .438
“z = 0.775, p = .438”
- Consistentz = 4.974reported p < .001 · recomputed p < .001
“z = 4.974, p < .001”
- Consistentz = 7.1reported p < .001 · recomputed p < .001
“z = 7.1, p < .001”
- Consistentz = -5.161reported p < .001 · recomputed p < .001
“z = −5.161, p < .001”
- Consistentz = 16.6reported p < .001 · recomputed p < .001
“z = 16.6, p < .001”
- Consistentz = 0.338reported p = .735 · recomputed p = .735
“z = 0.338, p = .735”
- Consistentz = 19.417reported p < .001 · recomputed p < .001
“z = 19.417, p < .001”
- ConsistentQ(14) = 18.99reported p = .165 · recomputed p = .165
“Q(14) = 18.99, p = .165”
- Consistentr(355) = 0.663reported p < .001 · recomputed p < .001
“r(355) = 0.663, p < .001”
- Consistentz = 3.124reported p = .002 · recomputed p = .002
“z = 3.124, p = .002”
- Consistentz = 11.276reported p < .001 · recomputed p < .001
“z = 11.276, p < .001”
- Consistentz = 1.085reported p = .278 · recomputed p = .278
“z = 1.085, p = .278”
- Consistentz = -1.869reported p = .062 · recomputed p = .062
“z = −1.869, p = .062”
- Consistentz = -0.292reported p = .77 · recomputed p = .770
“z = −0.292, p = .770”
- Consistentz = 4.188reported p < .001 · recomputed p < .001
“z = 4.188, p < .001”
- Consistentz = 4.804reported p < .001 · recomputed p < .001
“z = 4.804, p < .001”
- Consistentz = 5.707reported p < .001 · recomputed p < .001
“z = 5.707, p < .001”
- Consistentz = 4.94reported p < .001 · recomputed p < .001
“z = 4.940, p < .001”
- Consistentz = 3.404reported p = .001 · recomputed p < .001
“z = 3.404, p = .001”
- Consistentz = 2.988reported p = .003 · recomputed p = .003
“z = 2.988, p = .003”
- Consistentz = 2.79reported p = .005 · recomputed p = .005
“z = 2.790, p = .005”
- Consistentz = 2.608reported p = .009 · recomputed p = .009
“z = 2.608, p = .009”
- Consistentz = 2.784reported p = .005 · recomputed p = .005
“z = 2.784, p = .005”
- Consistentz = 2.119reported p = .034 · recomputed p = .034
“z = 2.119, p = .034”
- Consistentz = 3.581reported p < .001 · recomputed p < .001
“z = 3.581, p < .001”
- Consistentz = 0.726reported p = .468 · recomputed p = .468
“z = 0.726, p = .468”
- Consistentz = 4.44reported p < .001 · recomputed p < .001
“z = 4.440, p < .001”
Self-check
Percentages, sums and reported differences re-computed from the paper’s own numbers.
Each contradiction between two passages listed here was confirmed by an independent check.
Rated minor: it would not touch a result — a value no result rests on, a p-value that stays on the same side of the significance level, or a conflict that is clerical, resolved elsewhere in the paper, or outside its own findings.
In the paper
“which was collected in 18 experiments. In 5 experiments, this question was asked as a binary forced choice. In 13 experiments, it was asked as a 6 point Likert scale (no neutral option) and then binarized for analysis. In 2 experiments (Q and R), it was asked using a 7-point Likert scale;”
§ Accuracy prompts are a replicable and generalizable approach for reducing the spread of misinformation > Methods > Individual difference measures
Reported 18 · recomputed 20
Rated minor: it would not touch a result — a value no result rests on, a p-value that stays on the same side of the significance level, or a conflict that is clerical, resolved elsewhere in the paper, or outside its own findings.
In the paper
“b = 0.054, z = 2.765, p = 0.006, which translates into a 100.8% increase over baseline sharing discernment in the control condition of those experiments (headline veracity dummy: b = 0.050, z = 2.92, p = 0.003).”
§ Accuracy prompts are a replicable and generalizable approach for reducing the spread of misinformation > Results
Reported 100.8 · recomputed 108
Rated minor: it would not touch a result — a value no result rests on, a p-value that stays on the same side of the significance level, or a conflict that is clerical, resolved elsewhere in the paper, or outside its own findings.
In the paper
§ Accuracy prompts are a replicable and generalizable approach for reducing the spread of misinformation > Results > Individual-level differences
“With respect to education, we find in both sets of samples that the accuracy prompts had a larger effect for college educated participants, and that college educated participants were more discerning in their baseline sharing.”
§ Accuracy prompts are a replicable and generalizable approach for reducing the spread of misinformation > Results > Individual-level differences
“| College degree | 0.001 | 0.139 | 0.890 | −0.011 | −0.919 | 0.358 | 0.037 | 5.116 | <0.001 | 0.030 | 2.371 | 0.018 |”
Citations
Cites
Simmons, J. P., Nelson, L. D., & Simonsohn, U. (2011) · Psychological Science · doi:10.1177/0956797611417632 · Cited by 6,567
Cognitive Reflection and Decision Making
Frederick, S. (2005) · Journal of Economic Perspectives · doi:10.1257/089533005775196732 · Cited by 5,256
Lazer, D. M. J., Baum, M. A., Benkler, Y., Berinsky, A. J., Greenhill, K. M., Menczer, F., Metzger, M. J., Nyhan, B., Pennycook, G., Rothschild, D., et al. (2018) · Science · doi:10.1126/science.aao2998 · Cited by 4,160
Self-citationEvaluating Online Labor Markets for Experimental Research: Amazon.com's Mechanical Turk
Berinsky, A. J., Huber, G. A., & Lenz, G. S. (2012) · Political Analysis · doi:10.1093/pan/mpr057 · Cited by 4,008
Misinformation and Its Correction: Continued Influence and Successful Debiasing
Lewandowsky, S., Ecker, U. K. H., Seifert, C. M., Schwarz, N., & Cook, J. (2012) · Psychological Science in the Public Interest · doi:10.1177/1529100612451018 · Cited by 2,920
Pennycook, G., & Rand, D. G. (2019) · Cognition · doi:10.1016/j.cognition.2018.06.011 · Cited by 2,022
Self-citationFake news on Twitter during the 2016 U.S. presidential election
Grinberg, N., Joseph, K., Friedland, L., Swire-Thompson, B., & Lazer, D. (2019) · Science · doi:10.1126/science.aau2706 · Cited by 1,803
Measuring the impact of COVID-19 vaccine misinformation on vaccination intent in the UK and USA
Loomba, S., de Figueiredo, A., Piatek, S. J., de Graaf, K., & Larson, H. J. (2021) · Nature Human Behaviour · doi:10.1038/s41562-021-01056-1 · Cited by 1,800 · cited 2×
“…companies, and policy makers. during the Starting with “ fake news ” 2016 U.S. Presidential Election 1 , and redoubling during the COVID-19 pandemic 2 – 4 and the aftermath of the 2020 U.S. Presidential election 5 – 7 , there has been widespread concern about the circulation of false and…”
BackgroundPennycook, G., McPhetres, J., Zhang, Y., Lu, J. G., & Rand, D. G. (2020) · Psychological Science · doi:10.1177/0956797620939054 · Cited by 1,715
Self-citationLess than you think: Prevalence and predictors of fake news dissemination on Facebook
Guess, A., Nagler, J., & Tucker, J. (2019) · Science Advances · doi:10.1126/sciadv.aau4586 · Cited by 1,652
Research works printed but not linked: 1
- Rivers, D. & Bailey, D. Inference from matched samples in the 2008 U.S. national elections. Proc. Jt. Stat. Meet. 627–639 (2009).
Cited by
Sorted by citations
The impact of generative artificial intelligence on socioeconomic inequalities and policy making
Capraro, V., Lentsch, A., Acemoglu, D., Akgun, S., Akhmedova, A., Bilancini, E., Bonnefon, J.-F., Brañas-Garza, P., Butera, L., Douglas, K. M., et al. (2024) · PNAS Nexus · doi:10.1093/pnasnexus/pgae191 · Cited by 371
Toolbox of individual-level interventions against online misinformation
Kozyreva, A., Lorenz-Spreen, P., Herzog, S. M., Ecker, U. K. H., Lewandowsky, S., Hertwig, R., Ali, A., Bak-Coleman, J. B., Barzilai, S., Basol, M., et al. (2024) · Nature Human Behaviour · doi:10.1038/s41562-024-01881-0 · Cited by 302
Self-citationUnderstanding and combatting misinformation across 16 countries on six continents
Arechar, A. A., Allen, J., Berinsky, A. J., Cole, R., Epstein, Z., Garimella, K., Gully, A., Lu, J. G., Ross, R. M., Stagnaro, M. N., et al. (2023) · Nature Human Behaviour · doi:10.1038/s41562-023-01641-6 · Cited by 188
Self-citationQuantifying the impact of misinformation and vaccine-skeptical content on Facebook
Allen, J. N. L., Watts, D. J., & Rand, D. G. (2024) · Science · doi:10.1126/science.adk3451 · Cited by 173
Self-citationShin, D., Koerber, A., & Lim, J. S. (2025) · New Media & Society · doi:10.1177/14614448241234040 · Cited by 137
Metadata
- Authors
- Pennycook, G., & Rand, D. G.
- Affiliations
- University of Regina (CA)
- Massachusetts Institute of Technology (US)
- Corresponding author
- Pennycook, Gordon
- Rand, David G.
- Venue
- Nature Communications
- Published
- 2022-04-28
- Volume
- 13
- Issue
- 1
- Pages
- 2333-2333
- ISSN
- 2041-1723 (ISSN-L)
- PMC
- PMC9051116
- OpenAlex
- W4225127529
- Cited by
- 270
- References
- 74
- Citations by year
- 2026: 66 · 2025: 59 · 2024: 76 · 2023: 41 · 2022: 23
- FWCI
- 8.44
- Type
- journal article
- Language
- en
- Open access
- gold
- doi.org
- Locations
- Nature Communications (publishedVersion, cc-by)
- PubMed Central (publishedVersion, cc-by)
- PubMed (publishedVersion)
- RePEc: Research Papers in Economics (submittedVersion)
- DOAJ (DOAJ: Directory of Open Access Journals) (submittedVersion, cc-by-sa)
- DSpace@MIT (Massachusetts Institute of Technology) (submittedVersion, cc-by-nc)
- PsyArXiv (OSF Preprints) (submittedVersion, cc-by)
- PsyArXiv (OSF Preprints) (submittedVersion)
- Funders
- Gouvernement du Canada | Canadian Institutes of Health Research
- Gouvernement du Canada | Social Sciences and Humanities Research Council of Canada
- William and Flora Hewlett Foundation
- National Science Foundation
- Topics
- Social Sciences › Sociology and Political Science › Misinformation and Its Impacts
- Social Sciences › Library and Information Sciences › Academic Publishing and Open Access
- Social Sciences › Communication › Communication and COVID-19 Impact
- Keywords
- misinformation, news sharing, replicability, generalizability, political ideology, COVID-19 news, political news
- MeSH terms
- COVID-19, Communication, Humans, Politics, Intention
About these checks
Registry, retraction, Cites and statistics results are computed, not judged, with one exception: a printed reference that no index lists is read once by a model before it counts as a citation error. Claims are extracted by a model and kept only when their quote appears verbatim in the text; each cited source is then checked, with a model’s help, for whether it says what the claim relies on. Those verdicts can be wrong — read the claim’s quote and the cited source before relying on one.
A language model drew the claims from the paper on 2026-10-09, under version 3 of the claim definition (model deepseek-v4.1-flash, prompt extract-v3).
A second model labelled each claim on 2026-10-09 (model jev-1.13-20260917, definition revision gold-guideline-v0.2).
Cited sources are checked with a language model’s help (gpt-6-sol).
Statistics and arithmetic are recomputed, not judged.
Confidence bands are shown only for fields calibrated on our annotated test set. None is calibrated yet, so no band is shown.
What counts as a claim ›How we measure confidence ›How we check this ›
Are you an author, or do you see a problem with this page? Request a review
