

The DOI matches its Crossref record; 118 of the 119 references it cites were found in a registry or an index.
Global stocks and capacity of mineral-associated soil organic carbon
Open accessAbstract
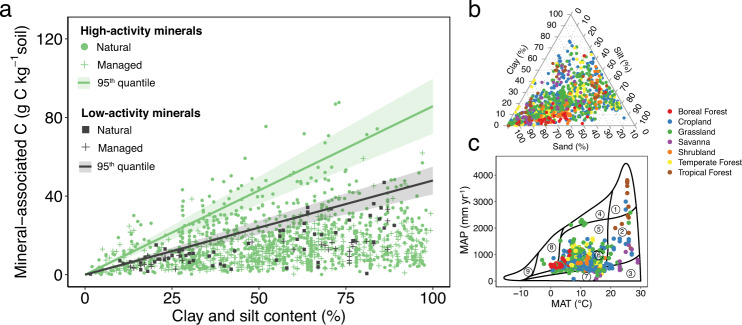
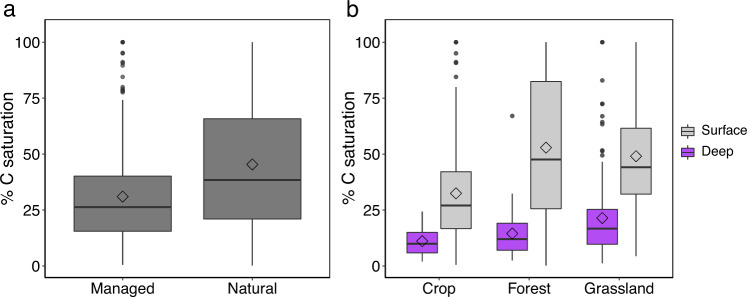
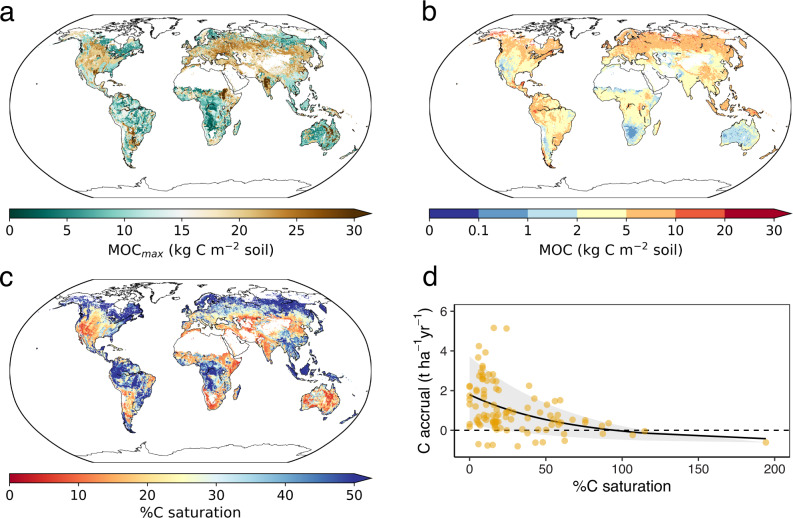
Soil is the largest terrestrial reservoir of organic carbon and is central for climate change mitigation and carbon-climate feedbacks. Chemical and physical associations of soil carbon with minerals play a critical role in carbon storage, but the amount and global capacity for storage in this form remain unquantified. Here, we produce spatially-resolved global estimates of mineral-associated organic carbon stocks and carbon-storage capacity by analyzing 1144 globally-distributed soil profiles. We show that current stocks total 899 Pg C to a depth of 1 m in non-permafrost mineral soils. Although this constitutes 66% and 70% of soil carbon in surface and deeper layers, respectively, it is only 42% and 21% of the mineralogical capacity. Regions under agricultural management and deeper soil layers show the largest undersaturation of mineral-associated carbon. Critically, the degree of undersaturation indicates sequestration efficiency over years to decades. We show that, across 103 carbon-accrual measurements spanning management interventions globally, soils furthest from their mineralogical capacity are more effective at accruing carbon; sequestration rates average 3-times higher in soils at one tenth of their capacity compared to soils at one half of their capacity. Our findings provide insights into the world’s soils, their capacity to store carbon, and priority regions and actions for soil carbon management.
Overview
The claims and statistics of this paper haven’t been checked yet.
Run the check — free, no account needed. It reads the open-access text and checks the sources it cites.
Integrity signals
Registry
Cites
Statistics
Figures
Verification
Claims the paper makes
The claims and statistics of this paper haven’t been checked yet.
Run the check — free, no account needed. It reads the open-access text and checks the sources it cites.
Claims other papers make about this one
Each is checked against this paper’s own text: does it say what the citing paper says it does?
The source backs part of the claim, not all of it — or backs it for a different population, condition or comparison.
In the citing paper
“Although SOC saturation represents a theoretical upper limit, most agricultural soils—particularly those with a history of degradation—remain far below this threshold (Georgiou et al., 2022;Georgiou et al., 2025;Sanderman et al., 2017).”
From Impact of 10 years of adaptive multi-paddock grazing on soil carbon and beef's greenhouse gas footprint in the US Upper Midwest (2026) · cites this paper as Georgiou et al., 2022
Experimental — accuracy not yet measured
Self-check
Percentages, sums and reported differences re-computed from the paper’s own numbers.
The self-check needs the paper’s full text.
Citations
Cites
Breiman, L. (2001) · Machine Learning · doi:10.1023/a:1010933404324 · Cited by 133,538
Greedy function approximation: A gradient boosting machine
Friedman, J. H. (2001) · The Annals of Statistics · doi:10.1214/aos/1013203451 · Cited by 30,731
Solutions for a cultivated planet
Foley, J. A., Ramankutty, N., Brauman, K. A., Cassidy, E. S., Gerber, J. S., Johnston, M., Mueller, N. D., O’Connell, C., Ray, D. K., West, P. C., et al. (2011) · Nature · doi:10.1038/nature10452 · Cited by 8,476
Soil Carbon Sequestration Impacts on Global Climate Change and Food Security
Lal, R. (2004) · Science · doi:10.1126/science.1097396 · Cited by 8,376
Temperature sensitivity of soil carbon decomposition and feedbacks to climate change
Davidson, E. A., & Janssens, I. A. (2006) · Nature · doi:10.1038/nature04514 · Cited by 6,919
Updated high‐resolution grids of monthly climatic observations – the CRU TS3 .10 Dataset
Harris, I. C., Jones, P. D., Osborn, T. J., & Lister, D. (2013) · International Journal of Climatology · doi:10.1002/joc.3711 · Cited by 6,326
THE VERTICAL DISTRIBUTION OF SOIL ORGANIC CARBON AND ITS RELATION TO CLIMATE AND VEGETATION
Jobbagy, E. G., & Jackson, R. B. (2000) · Ecological Applications · doi:10.1890/1051-0761(2000)010[0423:tvdoso]2.0.co;2 · Cited by 5,607
Self-citationSoilGrids250m: Global gridded soil information based on machine learning
Hengl, T., Mendes de Jesus, J., Heuvelink, G. B. M., Ruiperez Gonzalez, M., Kilibarda, M., Blagotić, A., Shangguan, W., Wright, M. N., Geng, X., Bauer-Marschallinger, B., et al. (2017) · PLOS ONE · doi:10.1371/journal.pone.0169748 · Cited by 4,733
Stabilization mechanisms of soil organic matter: Implications for C-saturation of soils
Six, J., Conant, R. T., Paul, E. A., & Paustian, K. (2002) · Plant and Soil · doi:10.1023/a:1016125726789 · Cited by 4,633
Cross‐validation strategies for data with temporal, spatial, hierarchical, or phylogenetic structure
Roberts, D. R., Bahn, V., Ciuti, S., Boyce, M. S., Elith, J., Guillera‐Arroita, G., Hauenstein, S., Lahoz‐Monfort, J. J., Schröder, B., Thuiller, W., et al. (2017) · Ecography · doi:10.1111/ecog.02881 · Cited by 3,689
Research works printed but not linked: 2
- Torn, M. S., Trumbore, S. E., Chadwick, O. A., Vitousek, P. M. & Hendricks, D. M. Mineral control of soil organic carbon storage and turnover. Nature 3603, 3601–3603 (1997).
- Liaw, A. & Wiener, M. Classification and Regression by randomForest. R. N. 2(3), 18–22 (2002).
Cited by
Sorted by citations
Items 201–300 of 978
Huang, N., He, H. Y., Fan, R., Li, X. Y., Zhao, C. M., & Li, J. H. (2025) · Geoderma · doi:10.1016/j.geoderma.2025.117282 · Cited by 17
Agricultural management strategies to actively promote subsoil carbon storage
Jones, D. L., Cooledge, E. C., Alston, D., & Chadwick, D. R. (2025) · Soil and Tillage Research · doi:10.1016/j.still.2025.106846 · Cited by 19
Hu, B., Geng, Y., Ni, H., Shi, Z., Wang, Z., Wang, N., Luo, J., Xie, M., Zou, Q., Optiz, T., et al. (2025) · Geoderma · doi:10.1016/j.geoderma.2025.117446 · Cited by 17
The Future of Soils in the Midwestern United States
Kwang, J., Thaler, E. A., & Larsen, I. J. (2023) · Earth s Future · doi:10.1029/2022ef003104 · Cited by 20
Fernández-Catinot, F. N., Pestoni, S., Gallardo, N., Vaieretti, M. V., & Harguindeguy, N. P. (2023) · Geoderma Regional · doi:10.1016/j.geodrs.2023.e00722 · Cited by 17
SAMM version 1.0: a numerical model for microbial- mediated soil aggregate formation
Laub, M., Blagodatsky, S., de Broek, M. V., Schlichenmaier, S., Kunlanit, B., Six, J., Vityakon, P., & Cadisch, G. (2024) · Geoscientific model development · doi:10.5194/gmd-17-931-2024 · Cited by 17
Rempfert, K. R., Bell, S. L., Kasanke, C. P., Zhao, Q., Zhao, X., Lipton, A. S., & Hofmockel, K. (2024) · The Science of The Total Environment · doi:10.1016/j.scitotenv.2024.172916 · Cited by 18
Yang, Y., Yang, J., Dong, Q., Li, D., Tan, B., Wu, Q., Xu, Z., & Xu, H. (2024) · Forests · doi:10.3390/f15091585 · Cited by 17
No saturation of soil carbon under long-term extreme manure additions
Heinemann, H., Don, A., Poeplau, C., Merbach, I., Reinsch, T., Welp, G., & Vos, C. (2024) · Plant and Soil · doi:10.1007/s11104-024-07146-z · Cited by 18
Ren, T., Smreczak, B., Ukalska‐Jaruga, A., Hassan, W., & Cai, A. (2025) · CATENA · doi:10.1016/j.catena.2025.108871 · Cited by 14
Ge, S., Chen, Y., Wang, Z., Li, Z., Shen, C., Zhang, T., & Wang, J. (2025) · Agriculture Ecosystems & Environment · doi:10.1016/j.agee.2025.109537 · Cited by 16
Eduah, J. O., Arthur, A., Amoako‐Attah, I., Manso, E. F., Quaye, A. K., Dogbatse, J. A., & Padi, F. K. (2025) · Soil & Environmental Health · doi:10.1016/j.seh.2025.100147 · Cited by 16
Su, W., Ma, Y., Hua, M., Chen, H., Liu, Z., Wang, S., & Wang, Y. (2025) · Applied Soil Ecology · doi:10.1016/j.apsoil.2025.106160 · Cited by 17
Patterns and controlling factors of soil microbial necromass carbon in global ecosystems
Yu, J., Li, J., Wu, J., Shangguan, Z., & Deng, L. (2025) · Journal of Environmental Management · doi:10.1016/j.jenvman.2025.125632 · Cited by 16
Wang, Z., Wang, Y., & Feng, W. (2023) · Chemosphere · doi:10.1016/j.chemosphere.2023.138319 · Cited by 16
Self-citationIs macroporosity controlled by complexed clay and soil organic carbon?
Koop, A. N., Hirmas, D. R., Billings, S., Li, L., Cueva, A., Zhang, X., Wen, H., Nemes, A., de Souza, L. F. T., Ajami, H., et al. (2023) · Geoderma · doi:10.1016/j.geoderma.2023.116565 · Cited by 16
Zhongsheng, Z., Shan, J., Zhao, W., Qiang, G., & Wu, H. (2023) · CATENA · doi:10.1016/j.catena.2023.107395 · Cited by 16
Wu, J., Bao, X., Zhang, J., Lu, B., Callaway, R. M., Fornara, D. A., & Li, L. (2023) · Soil and Tillage Research · doi:10.1016/j.still.2023.105913 · Cited by 17
Surface soil sampling underestimates soil carbon and nitrogen storage of long-term cover cropping
Peng, Y., & Eerd, L. L. V. (2024) · Geoderma Regional · doi:10.1016/j.geodrs.2024.e00885 · Cited by 17
Xi, M., Zhang, X., Chen, G., Zhang, L., Jiang, Z., & Zheng, H. R. (2024) · Journal of environmental chemical engineering · doi:10.1016/j.jece.2024.114781 · Cited by 16
Wang, K., Ma, Z., Qin, W., Li, X., Shi, H., Hasi, B., & Liu, X. (2025) · Ecological Engineering · doi:10.1016/j.ecoleng.2025.107522 · Cited by 19
Shen, Y., Fang, Y., Vancov, T., Sun, X., Du, H., Li, Y., Yu, B., Chang, S. X., & Cai, Y. (2025) · Plant and Soil · doi:10.1007/s11104-025-07207-x · Cited by 16
Warmer Climate Reduces the Carbon Storage, Stability and Saturation Levels in Forest Soils
Wu, Y., Peng, Z., Wang, X., Huang, J., Yang, L., & Liu, L. (2025) · Earth s Future · doi:10.1029/2024ef004988 · Cited by 16
Khan, M. H. R., Liu, J., Huang, Y., Wan, S., Chen, Z., & Rahman, A. (2025) · Global and Planetary Change · doi:10.1016/j.gloplacha.2025.104773 · Cited by 16
Microplastics in China’s surface water systems: Distribution, driving forces and ecological risk
Liu, X., Zhang, L., Du, Y., Yang, X., He, X., Zhang, J., & Jia, B. (2024) · Journal of Hazardous Materials · doi:10.1016/j.jhazmat.2024.136864 · Cited by 15
Yao, R., Fu, H., Liu, X., Liu, F., Wanek, W., Liang, G., Chadwick, D. R., Jones, D. L., Wu, L., & Ma, Q. (2025) · Soil and Tillage Research · doi:10.1016/j.still.2025.106770 · Cited by 15
Does day length matter for nutrient responsiveness?
Siqueira, J. A., Zsögön, A., Fernie, A. R., Nunes‐Nesi, A., & Araújo, W. L. (2023) · Trends in Plant Science · doi:10.1016/j.tplants.2023.04.012 · Cited by 15
Liao, X., Yang, X., He, Q., Yao, Y., Xiao, J., & Shi, W. (2023) · Agriculture Ecosystems & Environment · doi:10.1016/j.agee.2023.108670 · Cited by 15
Past changes in and present status of the coastal carbon cycle
Rixen, T. (2023) · Cambridge Prisms Coastal Futures · doi:10.1017/cft.2023.20 · Cited by 15
Chen, Z., Du, Z., Zhang, Z., Wang, G., & Ji, L. (2023) · The Science of The Total Environment · doi:10.1016/j.scitotenv.2023.169407 · Cited by 15
Characterization and environmental applications of soil biofilms: a review
Wang, G., Tian, L., Zhou, Q., Zhang, X., Li, R., & Wang, J. (2024) · Environmental Chemistry Letters · doi:10.1007/s10311-024-01735-1 · Cited by 15
Laurence, L., Heung, B., Zhang, J., Pennell, T., Nyiraneza, J., Strom, H., Stiles, K., & Burton, D. L. (2024) · Geoderma · doi:10.1016/j.geoderma.2024.116944 · Cited by 15
Huang, M., Hu, T., Wang, J., Ding, Y., Köster, K., & Sun, L. (2024) · The Science of The Total Environment · doi:10.1016/j.scitotenv.2024.175725 · Cited by 15
Li, X., Guo, Q., Jia, R., & Gao, Y. (2025) · Geoderma · doi:10.1016/j.geoderma.2025.117437 · Cited by 14
Huang, X., Li, W., Qin, G., Guan, F., Cui, Y., Shi, J., Lu, Z., Zhang, L., Zhang, J., Zhou, J., et al. (2025) · Functional Ecology · doi:10.1111/1365-2435.70121 · Cited by 15
Deep soil as an input-constrained output-controlled reactor for climate-smart agriculture
Wen, Y., Luo, Y., Zang, H., & Lehmann, J. C. (2025) · Nature Food · doi:10.1038/s43016-025-01233-9 · Cited by 14
Hansen, P. M., Zhang, Y., Guseva, K., Kaiser, C., & Cotrufo, M. F. (2025) · Soil Biology and Biochemistry · doi:10.1016/j.soilbio.2025.110056 · Cited by 16
Hu, J., Hartemink, A. E., Desai, A. R., Townsend, P. A., Abramoff, R., Zhu, Z., Sihi, D., & Huang, J. (2023) · Journal of Geophysical Research Biogeosciences · doi:10.1029/2022jg006981 · Cited by 14
Self-citationZhang, H., Wang, J., Zhang, Y., Qian, H., Xie, Z., Hu, Y., Huang, Y., Zhao, C., Cheng, W., Feng, X., et al. (2023) · Land · doi:10.3390/land12101923 · Cited by 14
Spatial evaluation of the soils capacity and condition to store carbon across Australia
Wadoux, A. M. J. ‐., Dobarco, M. R., Ng, W., & McBratney, A. B. (2024) · Geoderma · doi:10.1016/j.geoderma.2024.116805 · Cited by 15
Upper limit of mineral-associated organic carbon in temperate and sub-tropical soils: How far is it?
Matus, F. J., Pellat, F. P., Covaleda, S., Etchevers, J. D., Hidalgo, C., & Báez‐Pérez, A. (2024) · Geoderma Regional · doi:10.1016/j.geodrs.2024.e00811 · Cited by 14
Liao, Q., Gu, H., Qi, C., Chao, J., Zuo, W., Liu, J., Tian, C., & Lin, Z. (2024) · The Science of The Total Environment · doi:10.1016/j.scitotenv.2024.174776 · Cited by 14
Qi, M., Chen, S., Wei, Y., Zhou, H., Zhang, S., Wang, M., Zheng, J., Rossel, R. A. V., Chang, J., Shi, Z., et al. (2024) · Soil & Environmental Health · doi:10.1016/j.seh.2024.100100 · Cited by 14
Ma, S., Li, Y., Zhang, B., Zhai, L., Liu, X., & Zhang, J. (2024) · CATENA · doi:10.1016/j.catena.2024.108454 · Cited by 16
Lago-Olveira, S., Moreira, M. T., & González‐García, S. (2024) · Ecosystem Services · doi:10.1016/j.ecoser.2024.101686 · Cited by 14
Tenelli, S., Nascimento, A. F., Gabetto, F. P., Pimentel, M. L., Strauss, M., Bordonal, R. D. O., Cerri, C. E. P., Cherubin, M. R., & Carvalho, J. L. N. (2024) · Journal of Environmental Management · doi:10.1016/j.jenvman.2024.123742 · Cited by 14
Demands and possibilities for field-scale estimation of agricultural greenhouse gas balances
Palosuo, T., Heikkinen, J., Hilasvuori, E., Kulmala, L., Launiainen, S., Lehtilä, A., Leinonen, I., Liimatainen, M., Salminen, M., Shurpali, N., et al. (2024) · CATENA · doi:10.1016/j.catena.2024.108649 · Cited by 16
Galluzzi, G., Plaza, C., Giannetta, B., Priori, S., & Zaccone, C. (2025) · The Science of The Total Environment · doi:10.1016/j.scitotenv.2025.178511 · Cited by 14
Shi, L., Daly, K., & O'Rourke, S. M. (2025) · Geoderma · doi:10.1016/j.geoderma.2025.117181 · Cited by 13
Carbon saturation level regulates the stability of mineral-associated organic carbon in forest soils
Liu, Y., Huang, Y., Ndzelu, B. S., & Hou, R. (2025) · CATENA · doi:10.1016/j.catena.2025.109391 · Cited by 13
Yuan, Z., Fang, C., Ma, T., Pei, J.-Y., Song, X. S., Yao, G., Sardans, J., Peñuelas, J., Fang, X., & Li, F. (2025) · Soil Biology and Biochemistry · doi:10.1016/j.soilbio.2025.109978 · Cited by 14
Acosta, R. A. S., Cruz, J., Chuchon-Remon, R., Romero-Chávez, L. E., Lozano, A., Gaona-Jiménez, N., & Vallejos-Torres, G. (2025) · Frontiers in Soil Science · doi:10.3389/fsoil.2025.1662180 · Cited by 13
How biased is size fractionation derived mineral-associated organic carbon?
Poeplau, C., Andersen, M. S., & Vos, C. (2025) · Geoderma · doi:10.1016/j.geoderma.2025.117584 · Cited by 14
Li, L., Hosseiniaghdam, E., Drijber, R. A., Jeske, E. S., Awada, T. N., Hiller, J., & Kaiser, M. (2023) · Plant and Soil · doi:10.1007/s11104-023-06138-9 · Cited by 13
Ball, K. R., Burke, I. C., Collins, D. P., Kruger, C. E., & Yorgey, G. G. (2023) · Journal of Cleaner Production · doi:10.1016/j.jclepro.2023.139448 · Cited by 13
Patra, R., Saha, D., Neupane, A., & Jagadamma, S. (2024) · Applied Soil Ecology · doi:10.1016/j.apsoil.2024.105413 · Cited by 13
Wang, P., Zhou, Z., Yu, W., Liu, F., Cao, Y., Liu, J., & Wang, N. (2024) · Soil and Tillage Research · doi:10.1016/j.still.2024.106171 · Cited by 13
The limited effect of deforestation on stabilized subsoil organic carbon in a subtropical catchment
Müller, C. R., Six, J., Brosens, L., Baumann, P., Minella, J. P. G., Govers, G., & de Broek, M. V. (2024) · SOIL · doi:10.5194/soil-10-349-2024 · Cited by 13
Accessing and modelling soil organic carbon stocks in Prairies, Savannas, and forests
Gonçalves, D. R. P., Inagaki, T. M., Barioni, L. G., Scala, N. L., Cherubin, M. R., Sá, J. C. D. M., Cerri, C. E. P., & Anselmi, A. (2024) · CATENA · doi:10.1016/j.catena.2024.108219 · Cited by 13
Flooding increases plant-derived carbon accumulation in soils of aquatic-terrestrial ecotone
Ran, Y., Mao, Z., Jia, H., He, X., Xia, S., Ye, F., Vithana, C. L., Li, S., Wu, S., & Huang, P. (2024) · Journal of Environmental Management · doi:10.1016/j.jenvman.2024.123464 · Cited by 13
dos Santos, W. P., Vaz, C. M. P., Martin‐Neto, L., Anselmi, A., Tomasella, J., Costa, F. D. S., Albuquerque, J. A., van Lier, Q. D. J., Galbieri, R., & Perina, F. J. (2025) · Discover Soil. · doi:10.1007/s44378-025-00035-6 · Cited by 13
Zhang, M., Shen, Z., Walden, L., Sepanta, F., Luo, Z., Gao, L., Serrano, Ó., & Rossel, R. A. V. (2025) · Geoderma · doi:10.1016/j.geoderma.2025.117207 · Cited by 14
Kong, S., Cao, J., Qin, X., Wang, T., Xiang, X., Wu, J., Qi, S., Yan, Y., Yin, Y., Liu, W., et al. (2025) · npj Climate and Atmospheric Science · doi:10.1038/s41612-025-01110-z · Cited by 12
Storage Potential of Soil Functional Carbon Fractions in the World's Largest Plantations
Ren, S., Wang, H., Zhou, T., Wang, C., Zhou, Z., & Liu, S. (2025) · Advanced Science · doi:10.1002/advs.202504995 · Cited by 13
Shi, J. L., Duan, Z., Sun, Y., Yan, Y., Peng, Y., Yu, M., Wang, J., & Wang, X. (2025) · Environmental Science & Technology · doi:10.1021/acs.est.5c12104 · Cited by 12
Hunter, B. D., Roering, J. J., Almond, P. C., Chadwick, O. A., Polizzotto, M. L., & Silva, L. C. R. (2023) · Geoderma · doi:10.1016/j.geoderma.2023.116531 · Cited by 12
Dai, W., Xiao, R., Li, Z., Deng, Y., Fen, Y., & Wei, C. (2024) · Plant and Soil · doi:10.1007/s11104-024-06803-7 · Cited by 12
Tang, Z., Zhang, W., Chen, J.-H., Wang, L., & Zhang, Y. (2024) · The Science of The Total Environment · doi:10.1016/j.scitotenv.2024.174125 · Cited by 12
Ai, S., Wang, X., Zhu, J., Meng, X., Liu, Z., Yang, F., & Cheng, K. (2024) · The Science of The Total Environment · doi:10.1016/j.scitotenv.2024.174838 · Cited by 12
Ran, Y., Wang, P., Ye, F., Qu, J., Ning, Y., Zhang, Y., Wen, Z., Wu, S., & Huang, P. (2024) · CATENA · doi:10.1016/j.catena.2024.108266 · Cited by 12
Hosseinpour-Zarnaq, M., Moshiri, F., Jamshidi, M., Taghizadeh‐Mehrjardi, R., Tehrani, M. M., & Meymand, F. E. (2024) · Environmental Earth Sciences · doi:10.1007/s12665-024-11876-9 · Cited by 12
Enriched Molecular-Level View of Saline Wetland Soil Carbon by Sensitivity-Enhanced Solid-State NMR
Zhao, W., Thomas, E., Debnath, D., Scott, F., Mentink-Vigier, F., White, J. R., Cook, R. L., & Wang, T. (2024) · Journal of the American Chemical Society · doi:10.1021/jacs.4c11830 · Cited by 13
Zhang, L., Chen, M., Zong, Y., Sun, Z., Li, Y., Ding, X., & Zhang, S. (2025) · Plant and Soil · doi:10.1007/s11104-024-07163-y · Cited by 12
Chen, X., Gsell, T. C., Yunger, J. A., Randa, L. A., Peng, Y., & Carrington, M. E. (2025) · Forests · doi:10.3390/f16020219 · Cited by 13
Destabilization of Soil Carbon After Saltwater Intrusion in Coastal Agricultural Soils
Kalu, S., Ricker, M. C., Janson, J., Nordlund, D. L., & Li, H. (2025) · Environmental Science & Technology · doi:10.1021/acs.est.4c12966 · Cited by 12
Global prediction of agricultural soil antibiotic susceptibility and safe boundary for biota
Zhao, F., Yang, L., Huang, Y., Yen, H., Huang, Y., Feng, Q., Sun, L., Li, M., & Chen, L. (2025) · iScience · doi:10.1016/j.isci.2025.112066 · Cited by 13
Fan, X., Wang, Y., Qu, Y., & Bai, E. (2025) · Geoderma · doi:10.1016/j.geoderma.2025.117260 · Cited by 12
Cheng, H., Yan, S., Huang, Z., Lin, S., Yan, J., Wu, G., & Huang, G. (2025) · PeerJ · doi:10.7717/peerj.19189 · Cited by 13
Liu, X., Zhang, Y., Jiang, D., Wu, C., Wang, S., Tian, M., Yao, Z., Jiang, N., Chen, L., & Chen, L. (2025) · European Journal of Agronomy · doi:10.1016/j.eja.2025.127643 · Cited by 13
Characterising and quantifying soil clay-sized minerals using mid-infrared spectroscopy
Huang, Y., Ng, W., Minasny, B., & McBratney, A. B. (2025) · Soil and Tillage Research · doi:10.1016/j.still.2025.106590 · Cited by 12
Zhao, J., Minasny, B., Setia, R. K., Zhou, Z., Ren, C., Biswas, A., Luo, Z., Zhou, L., Shi, Z., & Chen, S. (2025) · Earth Critical Zone · doi:10.1016/j.ecz.2025.100035 · Cited by 13
Kim, K., Kaestner, A. P., Lucas, M., & Kravchenko, A. (2023) · Geoderma · doi:10.1016/j.geoderma.2023.116625 · Cited by 13
Poeplau, C., Begill, N., & Don, A. (2023) · Global Change Biology · doi:10.1111/gcb.16920 · Cited by 12
Koptsik, G. N., Koptsik, S. V., Kupriyanova, I. V., Кадулин, М. С., & Smirnova, I. E. (2023) · Eurasian Soil Science · doi:10.1134/s1064229323602196 · Cited by 12
Contribution of Integrated Crop Livestock Systems to Climate Smart Agriculture in Argentina
Colazo, J. C., Herrero, J. M. D. D., Sager, R., Guzmán, M. L., & Zaman, M. (2022) · Land · doi:10.3390/land11112060 · Cited by 13
Carrascosa, A., Moreno, G., Cotrufo, M. F., Frade, C., Rodrigo, S. M., & Rolo, V. (2025) · SOIL · doi:10.5194/soil-11-911-2025 · Cited by 13
Glyphosate use in agricultural production: it’s contribution to global carbon dioxide emissions
Brookes, G. R. (2025) · GM crops & food · doi:10.1080/21645698.2025.2594217 · Cited by 13
Schlüter, S., Lucas, M., Phalempin, M., Knecht, L., Langehenke, F., Deubel, A., Reddersen, B., Rusch, C., & Rücknagel, J. (2023) · Geoderma · doi:10.1016/j.geoderma.2023.116619 · Cited by 11
Chebet, S., Munkholm, L. J., & Jensen, J. L. (2023) · Geoderma · doi:10.1016/j.geoderma.2023.116646 · Cited by 11
Xanthopoulos, G., Radoglou, K., Derrien, D., Spyroglou, G., Angeli, N., Tsioni, G., & Fotelli, M. N. (2023) · Frontiers in Forests and Global Change · doi:10.3389/ffgc.2023.1190026 · Cited by 11
Tang, H., Li, Q., Bao, Q., Tang, B., Li, K., Ding, Y., Luo, X., Zeng, Q., Liu, S., Shu, X., et al. (2024) · Frontiers in Microbiology · doi:10.3389/fmicb.2024.1376418 · Cited by 11
River restoration can increase carbon storage but is not yet a suitable basis for carbon credits
Lininger, K. B., & Lave, R. (2024) · BioScience · doi:10.1093/biosci/biae083 · Cited by 12
Opportunities for carbon sequestration from removing or intensifying pasture-based beef production
Hayek, M., Piipponen, J., Kummu, M., Sahlin, K. R., McClelland, S. C., & Carlson, K. M. (2024) · Proceedings of the National Academy of Sciences · doi:10.1073/pnas.2405758121 · Cited by 13
Biomass Refined: 99% of Organic Carbon in Soils
Blakemore, R. J. (2024) · Biomass · doi:10.3390/biomass4040070 · Cited by 11
Wu, S., Dalal, R. C., Fu, W. D., Wu, Y., Wu, H. J., Chen, B., Xiao, K., Sun, T., & Huang, L. (2025) · ACS Earth and Space Chemistry · doi:10.1021/acsearthspacechem.4c00413 · Cited by 11
Koorneef, G. J., Pulleman, M., de Goede, R. G. M., Barré, P., Baudin, F., van Rijssel, S. Q., & Comans, R. N. J. (2025) · Geoderma · doi:10.1016/j.geoderma.2025.117371 · Cited by 11
Ji, Y., Li, M., Zhao, Q., Geng, J., Liu, J., & Yu, K. (2025) · Ecological Indicators · doi:10.1016/j.ecolind.2025.113668 · Cited by 11
Expanding the scope of biogeochemical research to accelerate atmospheric carbon capture
Silva, L. C. R. (2022) · Biogeochemistry · doi:10.1007/s10533-022-00957-1 · Cited by 11
Elucidation of aniline adsorption–desorption mechanism on various organo–mineral complexes
Ma, Y., Wu, X., Wang, T., Zhou, S., Cui, B., Sha, H., & Lv, B. (2023) · Environmental Science and Pollution Research · doi:10.1007/s11356-022-25096-w · Cited by 11
Chen, X., Hu, M., Zheng, G., & Chen, H. Y. H. (2023) · Global Ecology and Conservation · doi:10.1016/j.gecco.2023.e02530 · Cited by 11
Metadata
- Authors
- Georgiou, K., Jackson, R. B., Vindušková, O., Abramoff, R. Z., Ahlström, A., Feng, W., Harden, J. W., Pellegrini, A. F. A., Polley, H. W., Soong, J. L., Riley, W. J., & Torn, M. S.
- Affiliations
- Lawrence Livermore National Laboratory (US)
- Stanford University (US)
- University of Antwerp (BE)
- Oak Ridge National Laboratory (US)
- Lund University (SE)
- Chinese Academy of Agricultural Sciences (CN)
- United States Geological Survey (US)
- University of Cambridge (GB)
- Agricultural Research Service (US)
- Colorado State University (US)
- Lawrence Berkeley National Laboratory (US)
- Corresponding author
- Georgiou, Katerina
- ORCID
- Venue
- Nature Communications
- Published
- 2022-07-01
- Volume
- 13
- Issue
- 1
- Pages
- 3797-3797
- ISSN
- 2041-1723 (ISSN-L)
- PMC
- PMC9249731
- OpenAlex
- W4283743401
- Cited by
- 979
- References
- 119
- Citations by year
- 2026: 322 · 2025: 299 · 2024: 213 · 2023: 125 · 2022: 20
- FWCI
- 88.54
- Type
- journal article
- Language
- en
- Open access
- gold
- doi.org
- Locations
- Nature Communications (publishedVersion, cc-by)
- PubMed Central (publishedVersion, cc-by)
- PubMed (publishedVersion)
- HAL (submittedVersion, cc-by)
- eScholarship (California Digital Library) (submittedVersion, cc-by)
- RePEc: Research Papers in Economics (submittedVersion)
- DOAJ (DOAJ: Directory of Open Access Journals) (submittedVersion)
- Lund University Publications (Lund University) (submittedVersion)
- OSTI OAI (U.S. Department of Energy Office of Scientific and Technical Information) (submittedVersion)
- Apollo (University of Cambridge) (submittedVersion, cc-by)
- Apollo
- Apollo (cc-by)
- Greater South Information System
- Funders
- DOE | LDRD | Lawrence Livermore National Laboratory (21-ERD-045)
- Topics
- Life Sciences › Agricultural and Biological Sciences › Soil Science › Soil Carbon and Nitrogen Dynamics
- Life Sciences › Agricultural and Biological Sciences › Soil Science › Soil Geostatistics and Mapping
- Life Sciences › Agricultural and Biological Sciences › Soil Science › Soil erosion and sediment transport
- Keywords
- mineral-associated organic carbon, soil organic carbon stocks, carbon storage capacity, carbon sequestration, soil carbon management, agricultural soils, soil depth, carbon-climate feedback
- MeSH terms
- Agriculture, Carbon, Minerals, Soil, Carbon Sequestration
About these checks
Registry, retraction, Cites and statistics results are computed, not judged, with one exception: a printed reference that no index lists is read once by a model before it counts as a citation error. Claims are extracted by a model and kept only when their quote appears verbatim in the text; each cited source is then checked, with a model’s help, for whether it says what the claim relies on. Those verdicts can be wrong — read the claim’s quote and the cited source before relying on one.
Statistics and arithmetic are recomputed, not judged.
Confidence bands are shown only for fields calibrated on our annotated test set. None is calibrated yet, so no band is shown.
What counts as a claim ›How we measure confidence ›How we check this ›
Are you an author, or do you see a problem with this page? Request a review
