

The DOI matches its Crossref record; 9 of the 9 references it cites were found in a registry or an index.
Synaptic basis of a sub-second representation of time in a neural circuit model
Abstract
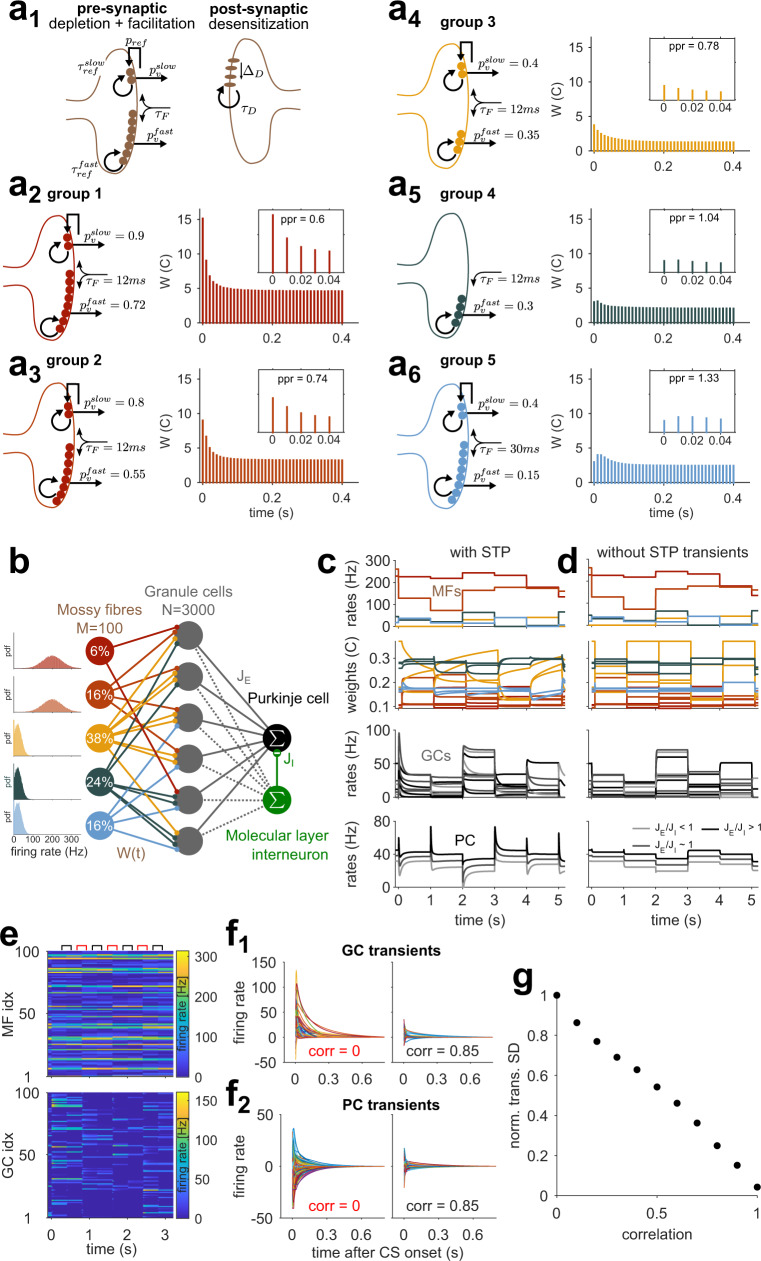
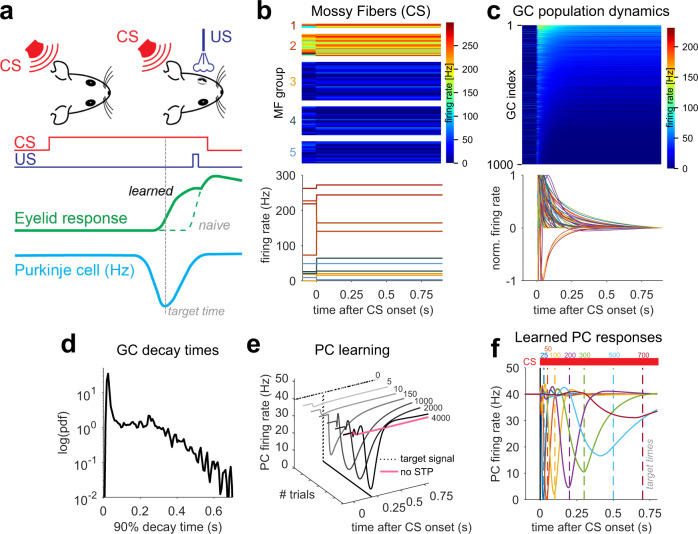
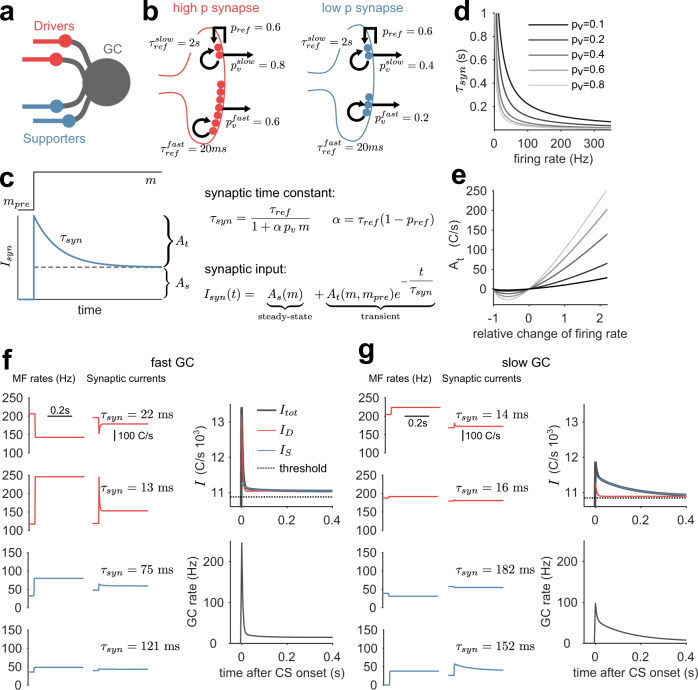
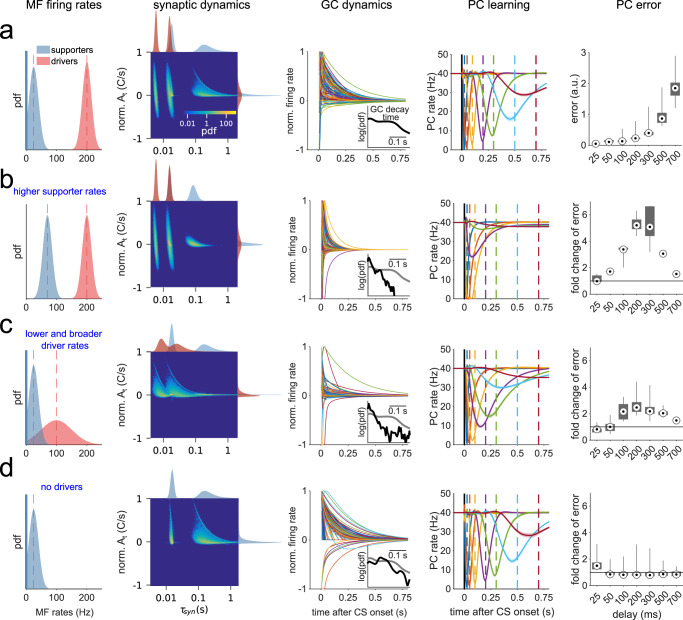
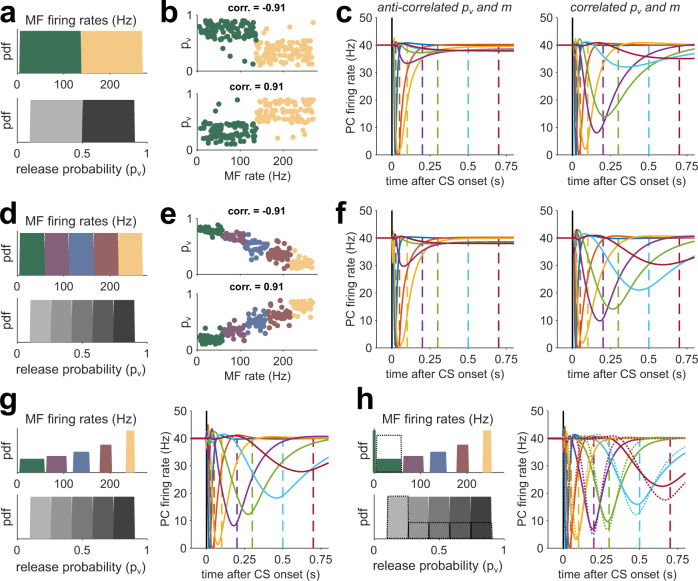
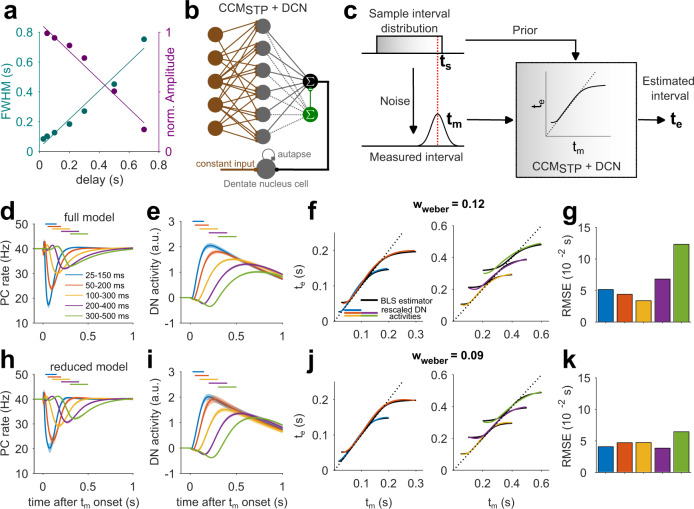
Temporal sequences of neural activity are essential for driving well-timed behaviors, but the underlying cellular and circuit mechanisms remain elusive. We leveraged the well-defined architecture of the cerebellum, a brain region known to support temporally precise actions, to explore theoretically whether the experimentally observed diversity of short-term synaptic plasticity (STP) at the input layer could generate neural dynamics sufficient for sub-second temporal learning. A cerebellar circuit model equipped with dynamic synapses produced a diverse set of transient granule cell firing patterns that provided a temporal basis set for learning precisely timed pauses in Purkinje cell activity during simulated delay eyelid conditioning and Bayesian interval estimation. The learning performance across time intervals was influenced by the temporal bandwidth of the temporal basis, which was determined by the input layer synaptic properties. The ubiquity of STP throughout the brain positions it as a general, tunable cellular mechanism for sculpting neural dynamics and fine-tuning behavior.
Overview
The claims and statistics of this paper haven’t been checked yet.
Run the check — free, no account needed. It reads the open-access text and checks the sources it cites.
Integrity signals
Registry
Cites
Statistics
Figures
Verification
Claims the paper makes
The claims and statistics of this paper haven’t been checked yet.
Run the check — free, no account needed. It reads the open-access text and checks the sources it cites.
Claims other papers make about this one
Each is checked against this paper’s own text: does it say what the citing paper says it does?
In the citing paper
“For example, diversity of synaptic short‐term dynamics at the cerebellar input layer could serve as a mechanism for temporal learning (Barri et al., 2022).”
From MicroRNA‐138‐5p suppresses excitatory synaptic strength at the cerebellar input layer (2025) · cites this paper as Barri et al., 2022
Self-check
Percentages, sums and reported differences re-computed from the paper’s own numbers.
The self-check needs the paper’s full text.
Citations
Cites
A theory of cerebellar function
Albus, J. S. (1971) · Mathematical Biosciences · doi:10.1016/0025-5564(71)90051-4 · Cited by 2,539
Kernel density estimation via diffusion
Botev, Z. I., Grotowski, J. F., & Kroese, D. P. (2010) · The Annals of Statistics · doi:10.1214/10-aos799 · Cited by 1,689
Abbott, L. F., & Regehr, W. G. (2004) · Nature · doi:10.1038/nature03010 · Cited by 1,684
Differential signaling via the same axon of neocortical pyramidal neurons
Markram, H., Wang, Y., & Tsodyks, M. (1998) · Proceedings of the National Academy of Sciences · doi:10.1073/pnas.95.9.5323 · Cited by 1,102
Heterogeneity in the pyramidal network of the medial prefrontal cortex
Wang, Y., Markram, H., Goodman, P. H., Berger, T. K., Ma, J., & Goldman-Rakic, P. S. (2006) · Nature Neuroscience · doi:10.1038/nn1670 · Cited by 503
Distributed synergistic plasticity and cerebellar learning
Gao, Z., van Beugen, B. J., & De Zeeuw, C. I. (2012) · Nature Reviews Neuroscience · doi:10.1038/nrn3312 · Cited by 479
Climbing fibers encode a temporal-difference prediction error during cerebellar learning in mice
Ohmae, S., & Medina, J. F. (2015) · Nature Neuroscience · doi:10.1038/nn.4167 · Cited by 243
Bassoon speeds vesicle reloading at a central excitatory synapse
Hallermann, S., Fejtova, A., Schmidt, H., Weyhersmüller, A., Silver, R. A., Gundelfinger, E. D., & Eilers, J. (2010) · Neuron · doi:10.1016/j.neuron.2010.10.026 · Cited by 223
Popa, L. S., Hewitt, A. L., & Ebner, T. J. (2012) · The Journal of Neuroscience · doi:10.1523/jneurosci.2151-12.2012 · Cited by 95 · cited 1×
“The cerebellar cortex is a prototypical microcircuit known to be important for generating temporally precise motor 22 and cognitive behaviors 23 – 26 on the sub-second timescale.”
Research works printed but not linked: 80
- Broome, B. M., Jayaraman, V. & Laurent, G. Encoding and decoding of overlapping odor sequences. Neuron 51, 467–482 (2006). · DOI
- Crowe, D. A., Averbeck, B. B., Chafee, M. V. & Georgopoulos, A. P. Dynamics of parietal neural activity during spatial cognitive processing. Neuron 47, 885–891 (2005). · DOI
- Harvey, C. D., Coen, P. & Tank, D. W. Choice-specific sequences in parietal cortex during a virtual-navigation decision task. Nature 484, 62–68 (2012). · DOI
- Sauerbrei, B. A. et al. Cortical pattern generation during dexterous movement is input-driven. Nature 577, 386–391 (2020). · DOI
- Zhou, S., Masmanidis, S. C. & Buonomano, D. V. Neural sequences as an optimal dynamical regime for the readout of time. Neuron 108, 651–658.e5 (2020). · DOI
- Bright, I. M. et al. A temporal record of the past with a spectrum of time constants in the monkey entorhinal cortex. Proc. Natl Acad. Sci. 117, 20274–20283 (2020). · DOI
- MacDonald, C. J., Lepage, K. Q., Eden, U. T. & Eichenbaum, H. Hippocampal “time cells” bridge the gap in memory for discontiguous events. Neuron 71, 737–749 (2011). · DOI · Paper page
- Pastalkova, E., Itskov, V., Amarasingham, A. & Buzsaki, G. Internally generated cell assembly sequences in the rat hippocampus. Science 321, 1322–1327 (2008). · DOI · Paper page
- Long, M. A., Jin, D. Z. & Fee, M. S. Support for a synaptic chain model of neuronal sequence generation. Nature 468, 394–399 (2010). · DOI
- Kennedy, A. et al. A temporal basis for predicting the sensory consequences of motor commands in an electric fish. Nat. Neurosci. 17, 416–422 (2014). · DOI
- Laje, R. & Buonomano, D. V. Robust timing and motor patterns by taming chaos in recurrent neural networks. Nat. Neurosci. 16, 925–933 (2013). · DOI · Paper page
- Yamazaki, T. & Tanaka, S. The cerebellum as a liquid state machine. Neural Netw. 20, 290–297 (2007). · DOI
- Toyoizumi, T. & Abbott, L. F. Beyond the edge of chaos: amplification and temporal integration by recurrent networks in the chaotic regime. Phys. Rev. E: Stat. Nonlin. Soft Matter Phys. 84, 051908 (2011). · DOI
- Dittman, J. S., Kreitzer, A. C. & Regehr, W. G. Interplay between facilitation, depression, and residual calcium at three presynaptic terminals. J. Neurosci. 20, 1374–1385 (2000). · DOI
- Abbott, L. F., Varela, J. A., Sen, K. & Nelson, S. B. Synaptic depression and cortical gain control. Science 275, 220–224 (1997). · DOI · Paper page
- Rothman, J. S., Cathala, L., Steuber, V. & Silver, R. A. Synaptic depression enables neuronal gain control. Nature 457, 1015–1018 (2009). · DOI
- Buonomano, D. V. & Merzenich, M. M. Temporal information transformed into a spatial code by a neural network with realistic properties. Science 267, 1028–1030 (1995). · DOI
- Mongillo, G., Barak, O. & Tsodyks, M. Synaptic theory of working memory. Science 319, 1543–1546 (2008). · DOI · Paper page
- Buonomano, D. V. & Maass, W. State-dependent computations: spatiotemporal processing in cortical networks. Nat. Rev. Neurosci. 10, 113–125 (2009). · DOI
- Chadderton, P., Schaefer, A. T., Williams, S. R. & Margrie, T. W. Sensory-evoked synaptic integration in cerebellar and cerebral cortical neurons. Nat. Rev. Neurosci. 15, 71–83 (2014). · DOI
- Burguière, E. et al. Spatial navigation impairment in mice lacking cerebellar LTD: a motor adaptation deficit? Nat. Neurosci. 8, 1292–1294 (2005). · DOI
- Moberget, T., Gullesen, E. H., Andersson, S., Ivry, R. B. & Endestad, T. Generalized role for the cerebellum in encoding internal models: evidence from semantic processing. J. Neurosci. 34, 2871–2878 (2014). · DOI
- Gao, Z. et al. A cortico-cerebellar loop for motor planning. Nature 563, 113–116 (2018). · DOI · Paper page
- Chabrol, F. P., Blot, A. & Mrsic-Flogel, T. D. Cerebellar contribution to preparatory activity in motor neocortex. Neuron 103, 506–519.e4 (2019). · DOI · Paper page
- Marr, D. A theory of cerebellar cortex. J. Physiol. 202, 437–470 (1968). · DOI · Paper page
- Medina, J. F. & Mauk, M. D. Computer simulation of cerebellar information processing. Nat. Neurosci. 3, 1205–1211 (2000). · DOI
- Chabrol, F. P., Arenz, A., Wiechert, M. T., Margrie, T. W. & DiGregorio, D. A. Synaptic diversity enables temporal coding of coincident multisensory inputs in single neurons. Nat. Neurosci. 18, 718–727 (2015). · DOI · Paper page
- Halverson, H. E., Khilkevich, A. & Mauk, M. D. Relating cerebellar Purkinje cell activity to the timing and amplitude of conditioned eyelid responses. J. Neurosci. 35, 7813–7832 (2015). · DOI
- White, N. E., Kehoe, E. J., Choi, J. S. & Moore, J. W. Coefficients of variation in timing of the classically conditioned eyeblink in rabbits. Psychobiology 28, 520–524 (2000). · DOI
- Narain, D., Remington, E. D., Zeeuw, C. I. D. & Jazayeri, M. A cerebellar mechanism for learning prior distributions of time intervals. Nat. Commun. 9, 469 (2018). · DOI
- Litwin-Kumar, A., Harris, K. D., Axel, R., Sompolinsky, H. & Abbott, L. F. Optimal degrees of synaptic connectivity. Neuron 93, 153–1164.e7 (2017). · DOI
- Cayco-Gajic, N. A., Clopath, C. & Silver, R. A. Sparse synaptic connectivity is required for decorrelation and pattern separation in feedforward networks. Nat. Commun. 8, 1116 (2017). · DOI
- Fujita, M. Adaptive filter model of the cerebellum. Biol. Cybern. 45, 195–206 (1982). · DOI
- Dean, P., Porrill, J., Ekerot, C.-F. & Jörntell, H. The cerebellar microcircuit as an adaptive filter: experimental and computational evidence. Nat. Rev. Neurosci. 11, 30–43 (2010). · DOI
- Saviane, C. & Silver, R. A. Fast vesicle reloading and a large pool sustain high bandwidth transmission at a central synapse. Nature 439, 983–987 (2006). · DOI · Paper page
- Park, H. J., Lasker, D. M. & Minor, L. B. Static and dynamic discharge properties of vestibular-nerve afferents in the mouse are affected by core body temperature. Exp. Brain Res. 200, 269–275 (2010). · DOI
- Arenz, A., Silver, R. A., Schaefer, A. T. & Margrie, T. W. The contribution of single synapses to sensory representation in vivo. Science 321, 977–980 (2008). · DOI
- Bosman, L. W. J. et al. Encoding of whisker input by cerebellar Purkinje cells: Whisker encoding by Purkinje cells. J. Physiol. 588, 3757–3783 (2010). · DOI
- Steinmetz, J. E., Lavond, D. G. & Thompson, R. F. Classical conditioning of the rabbit eyelid response with mossy fiber stimulation as the conditioned stimulus. Bull. Psychon. Soc. 23, 245–248 (1985). · DOI
- Khilkevich, A., Zambrano, J., Richards, M.-M. & Mauk, M. D. Cerebellar implementation of movement sequences through feedback. eLife 7, e06262 (2018). · DOI
- Bouvier, G. et al. Cerebellar learning using perturbations. eLife 45, (2018). · DOI
- Gibbon, J. Scalar expectancy theory and Weber’s law in animal timing. Psychol. Rev. 84, 47 (1977). · DOI
- Jazayeri, M. & Shadlen, M. N. Temporal context calibrates interval timing. Nat. Neurosci. 13, 1020–1026 (2010). · DOI
- Miyazaki, M., Nozaki, D. & Nakajima, Y. Testing Bayesian models of human coincidence timing. J. Neurophysiol. 94, 395–399 (2005). · DOI
- Egger, S. W., Remington, E. D., Chang, C.-J. & Jazayeri, M. Internal models of sensorimotor integration regulate cortical dynamics. Nat. Neurosci. 22, 1871–1882 (2019). · DOI
- Marr, D. Vision: A Computational Investigation Into the Human Representation and Processing of Visual Information (MIT Press, 1982).
- Shankar, K. H. & Howard, M. W. A scale-invariant internal representation of time. Neural Comput 24, 134–193 (2012). · DOI
- Albergaria, C., Silva, N. T., Pritchett, D. L. & Carey, M. R. Locomotor activity modulates associative learning in mouse cerebellum. Nat. Neurosci. 21, 725–735 (2018). · DOI
- Guo, J.-Z. et al. Disrupting cortico-cerebellar communication impairs dexterity. eLife 10, e65906 (2021). · DOI
- Puccini, G. D., Sanchez-Vives, M. V. & Compte, A. Integrated mechanisms of anticipation and rate-of-change computations in cortical circuits. PLoS Comput. Biol. 3, e82 (2007). · DOI
- Diaz-Quesada, M., Martini, F. J., Ferrati, G., Bureau, I. & Maravall, M. Diverse thalamocortical short-term plasticity elicited by ongoing stimulation. J. Neurosci. 34, 515–526 (2014). · DOI
- Buzsáki, G. & Mizuseki, K. The log-dynamic brain: how skewed distributions affect network operations. Nat. Rev. Neurosci. 15, 264–278 (2014). · DOI
- Gilmer, J. I., Farries, M. A., Kilpatrick, Z., Delis, I. & Person, A. L. An Emergent Temporal Basis Set Robustly Supports Cerebellar Time-series Learning. https://doi.org/10.1101/2022.01.06.475265 (2022). · DOI
- Zampini, V. et al. Mechanisms and functional roles of glutamatergic synapse diversity in a cerebellar circuit. eLife 5, e15872 (2016). · DOI
- Guo, C., Huson, V., Macosko, E. Z. & Regehr, W. G. Graded heterogeneity of metabotropic signaling underlies a continuum of cell-intrinsic temporal responses in unipolar brush cells. Nat. Commun. 12, 5491 (2021). · DOI
- Dorgans, K. et al. Short-term plasticity at cerebellar granule cell to molecular layer interneuron synapses expands information processing. eLife 8, e41586 (2019). · DOI
- Gurnani, H. & Silver, R. A. Multidimensional population activity in an electrically coupled inhibitory circuit in the cerebellar cortex. Neuron 109, 1739–1753.e8 (2021). · DOI
- Kita, K. et al. GluA4 enables associative memory formation by facilitating cerebellar expansion coding. bioRxiv https://doi.org/10.1101/2020.12.04.412023 (2020). · DOI
- DiGregorio, D. A., Nusser, Z. & Silver, R. A. Spillover of glutamate onto synaptic AMPA receptors enhances fast transmission at a cerebellar synapse. Neuron 35, 521–533 (2002). · DOI
- Yamazaki, T. & Tanaka, S. A spiking network model for passage-of-time representation in the cerebellum: Cerebellar passage-of-time representation. Eur. J. Neurosci. 26, 2279–2292 (2007). · DOI
- Straub, I. et al. Gradients in the mammalian cerebellar cortex enable Fourier-like transformation and improve storing capacity. eLife 9, e51771 (2020). · DOI
- Johansson, F., Jirenhed, D.-A., Rasmussen, A., Zucca, R. & Hesslow, G. Memory trace and timing mechanism localized to cerebellar Purkinje cells. Proc. Natl Acad. Sci. 111, 14930–14934 (2014). · DOI
- Van Dijck, G. et al. Probabilistic identification of cerebellar cortical neurones across species. PLoS ONE 8, e57669 (2013). · DOI
- Liu, Z. et al. Sustained deep-tissue voltage recording using a fast indicator evolved for two-photon microscopy. Cell 185, 48 (2022). · DOI
- Sadeghi, S. G., Chacron, M. J., Taylor, M. C. & Cullen, K. E. Neural variability, detection thresholds, and information transmission in the vestibular system. J. Neurosci. 27, 771–781 (2007). · DOI
- Medrea, I. & Cullen, K. E. Multisensory integration in early vestibular processing in mice: the encoding of passive vs. active motion. J. Neurophysiol. 110, 2704–2717 (2013). · DOI
- Bengtsson, F. & Jorntell, H. Sensory transmission in cerebellar granule cells relies on similarly coded mossy fiber inputs. Proc. Natl Acad. Sci. 106, 2389–2394 (2009). · DOI
- Clopath, C., Badura, A., De Zeeuw, C. I. & Brunel, N. A Cerebellar learning model of vestibulo-ocular reflex adaptation in wild-type and mutant mice. J. Neurosci. 34, 7203–7215 (2014). · DOI
- Najafi, F. & Medina, J. F. Beyond “all-or-nothing” climbing fibers: graded representation of teaching signals in Purkinje cells. Front. Neural Circuits 7, 115 (2013). · DOI
- Remington, E. D., Narain, D., Hosseini, E. A. & Jazayeri, M. Flexible sensorimotor computations through rapid reconfiguration of cortical dynamics. Neuron 98, 1005–1019.e5 (2018). · DOI
- Suvrathan, A., Payne, H. L. & Raymond, J. L. Timing rules for synaptic plasticity matched to behavioral function. Neuron 92, 959–967 (2016). · DOI
- Van Kan, P. L., Gibson, A. R. & Houk, J. C. Movement-related inputs to intermediate cerebellum of the monkey. J. Neurophysiol. 69, 74–94 (1993). · DOI
- Beraneck, M. & Cullen, K. E. Activity of vestibular nuclei neurons during vestibular and optokinetic stimulation in the alert mouse. J. Neurophysiol. 98, 1549–1565 (2007). · DOI
- Dale, A. & Cullen, K. E. The nucleus prepositus predominantly outputs eye movement-related information during passive and active self-motion. J. Neurophysiol. 109, 1900–1911 (2013). · DOI
- Muzzu, T., Mitolo, S., Gava, G. P. & Schultz, S. R. Encoding of locomotion kinematics in the mouse cerebellum. PLoS ONE 13, e0203900 (2018). · DOI
- Chen, S., Augustine, G. J. & Chadderton, P. Serial processing of kinematic signals by cerebellar circuitry during voluntary whisking. Nat. Commun. 8, 232 (2017). · DOI
- Giovannucci, A. et al. Cerebellar granule cells acquire a widespread predictive feedback signal during motor learning. Nat. Neurosci. 20, 727–734 (2017). · DOI
- O’Donoghue, B. & Candes, E. Adaptive restart for accelerated gradient schemes. Found. Comput. Math. 15, 715–732 (2015). · DOI
- Goldman, M. S., Maldonado, P. & Abbott, L. F. Redundancy reduction and sustained firing with stochastic depressing synapses. J. Neurosci. 22, 584–591 (2002). · DOI
- Sanderson, C. & Curtin, R. Armadillo: a template-based C++ library for linear algebra. J. Open Source Softw. 1, 26 (2016). · DOI
Cited by
Sorted by citations
MicroRNA‐138‐5p suppresses excitatory synaptic strength at the cerebellar input layer
Delvendahl, I., Daswani, R., Winterer, J., Germain, P., Uhr, N. M., Schratt, G., & Müller, M. (2025) · The Journal of Physiology · doi:10.1113/jp288019 · Cited by 3
Metadata
- Authors
- Barri, A., Wiechert, M. T., Jazayeri, M., & DiGregorio, D. A.
- Venue
- Nature Communications
- Published
- 2022-12-22
- Volume
- 13
- Issue
- 1
- ISSN
- 2041-1723
- PMC
- PMC9780315
- Cited by
- 43
- References
- 9
- Language
- en
- Funders
- Agence Nationale de la Recherche (ANR-19-CE16-0019, ANR-21 -CE16 0036 01)
- Fondation pour la Recherche Médicale (Team Award)
About these checks
Registry, retraction, Cites and statistics results are computed, not judged, with one exception: a printed reference that no index lists is read once by a model before it counts as a citation error. Claims are extracted by a model and kept only when their quote appears verbatim in the text; each cited source is then checked, with a model’s help, for whether it says what the claim relies on. Those verdicts can be wrong — read the claim’s quote and the cited source before relying on one.
Statistics and arithmetic are recomputed, not judged.
Confidence bands are shown only for fields calibrated on our annotated test set. None is calibrated yet, so no band is shown.
What counts as a claim ›How we measure confidence ›How we check this ›
Are you an author, or do you see a problem with this page? Request a review
