

The DOI matches its Crossref record; 63 of the 63 references it cites were found in a registry or an index; 4 of the 30 sources its claims cite were checked for support.
Transformer for one stop interpretable cell type annotation
Open accessAbstract
Consistent annotation transfer from reference dataset to query dataset is fundamental to the development and reproducibility of single-cell research. Compared with traditional annotation methods, deep learning based methods are faster and more automated. A series of useful single cell analysis tools based on autoencoder architecture have been developed but these struggle to strike a balance between depth and interpretability. Here, we present TOSICA, a multi-head self-attention deep learning model based on Transformer that enables interpretable cell type annotation using biologically understandable entities, such as pathways or regulons. We show that TOSICA achieves fast and accurate one-stop annotation and batch-insensitive integration while providing biologically interpretable insights for understanding cellular behavior during development and disease progressions. We demonstrate TOSICA’s advantages by applying it to scRNA-seq data of tumor-infiltrating immune cells, and CD14+ monocytes in COVID-19 to reveal rare cell types, heterogeneity and dynamic trajectories associated with disease progression and severity.
Verifying this paper
8 of 9 steps done · this page updates itself — you can leave and come back
- Registry recordVerified
- Full textRead the full text
- Reference list59 references found
- Reference checkChecking each cited work — 63 of 63
- StatisticsRecomputed
- Claims129 claims anchored to a quote
- Cited sourcesChecked
- Self-checkChecked
- VerificationFindings verified
Overview
AI snapshot
Written from the paper’s full text.
TL;DR
TOSICA is a Transformer-based, multi-head self-attention model for interpretable cell type annotation that uses biologically meaningful tokens such as pathways or regulons. It transfers labels from reference to query scRNA-seq datasets with high accuracy, batch-insensitive integration, and attention-based interpretability across development, cancer, COVID-19, and SLE case studies.
Key findings
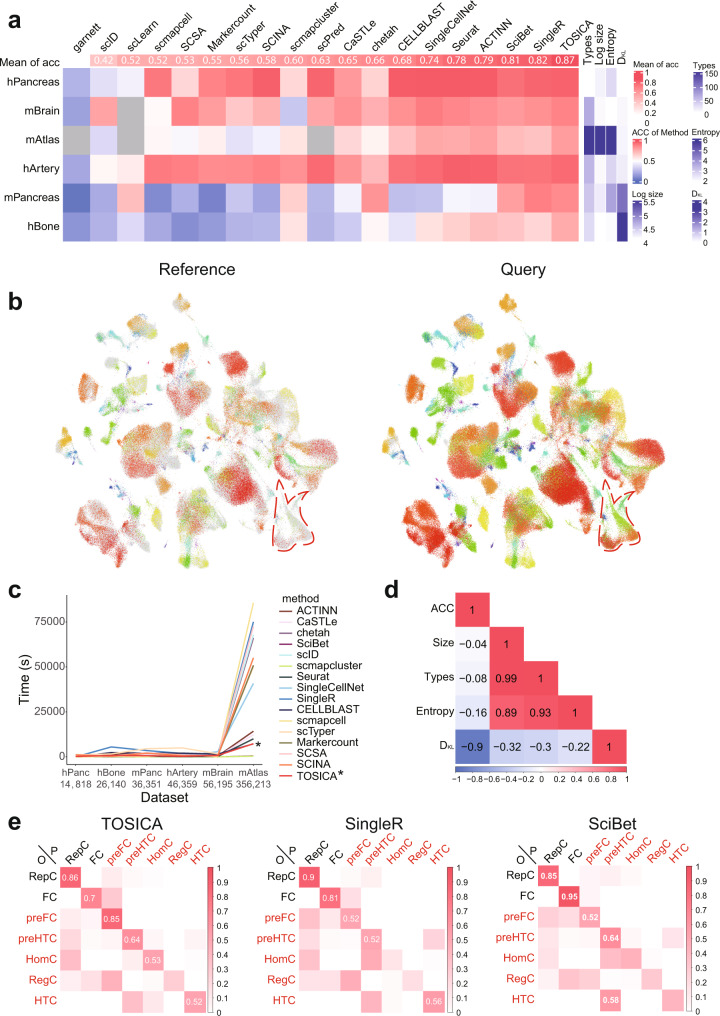
- Across six benchmark datasets and 19 methods, TOSICA had the highest mean accuracy at 86.69%, ranked top 6 on every dataset, and reached 81.06% on the largest dataset mAtlas versus 79.57% for the second-best method ACTINN.
- On datasets with uneven cell-type distributions between reference and query, TOSICA achieved 76.47% mean accuracy on five unbalanced cell types, compared with 63.23% for SingleR and 68.18% for SciBet; Kullback–Leibler divergence had the strongest negative correlation with accuracy (PCC = −0.9).
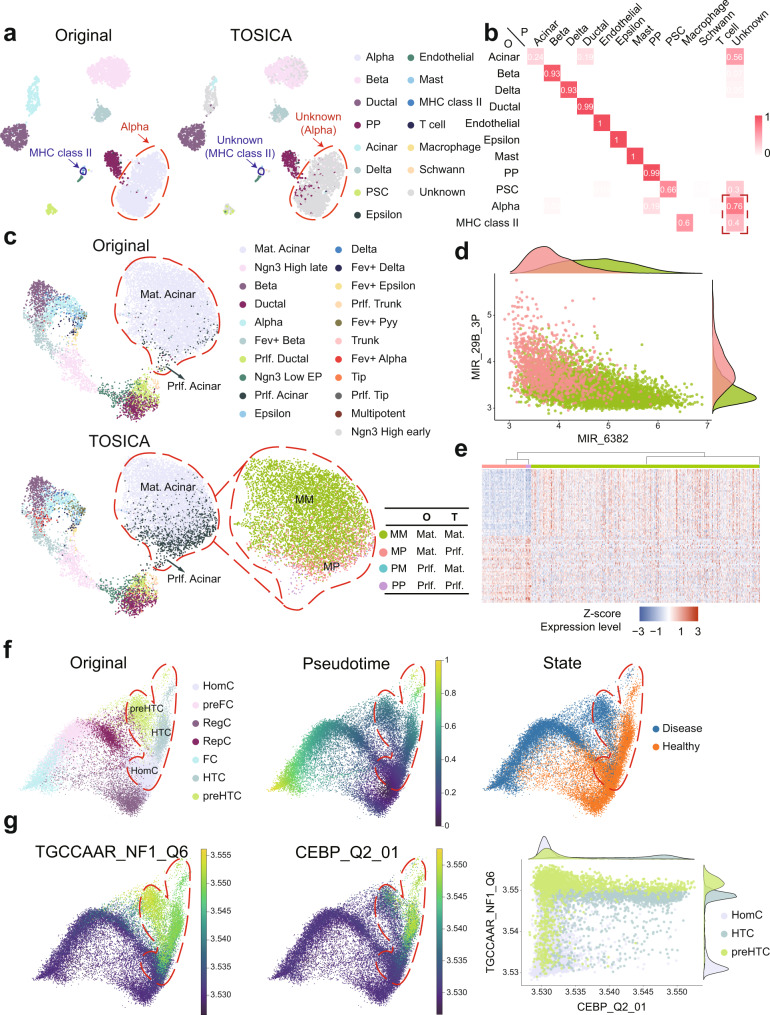
- TOSICA discovered unseen or rare cell types: after deleting alpha cells from the hPancreas reference, 76% of query alpha cells were labeled “Unknown,” while other methods mislabeled them as PP, delta, or beta.
- In integration benchmarks, scIB ranked TOSICA second of 11 applicable methods on pan-cancer myeloid cells and first of 13 methods on a COVID-19 dataset; on the T cell dataset, TOSICA’s runtime was shortest, while scGen took nearly five days.
Methods
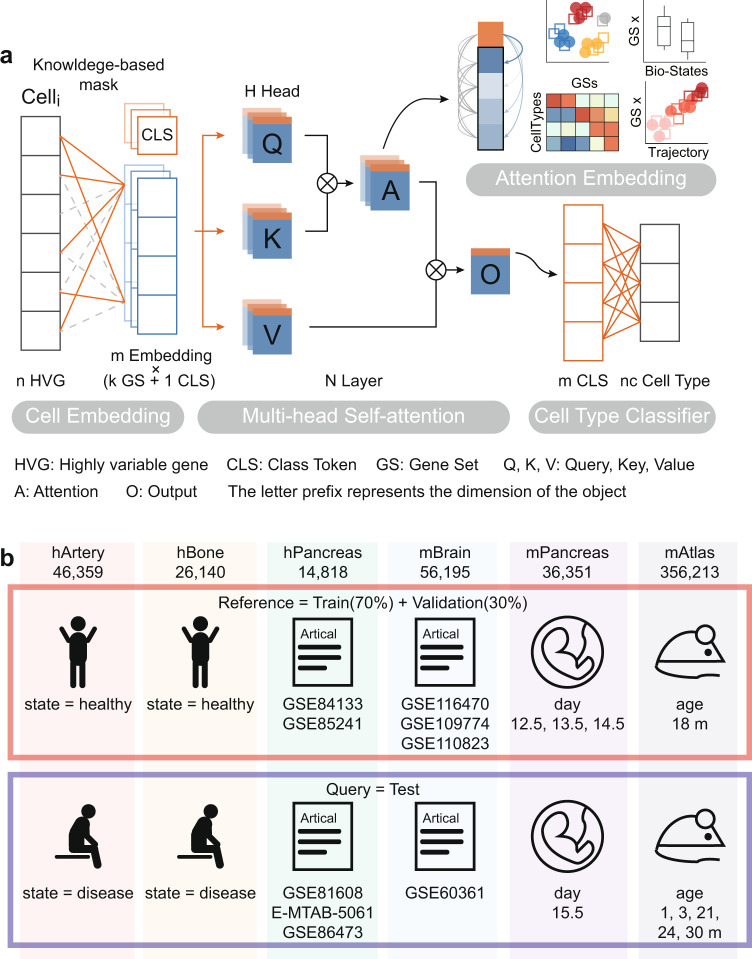
- TOSICA uses a multi-head self-attention Transformer with a Cell Embedding layer, Multi-head Self-attention layer, and Cell-Type Classifier. Gene expression is transformed into tokens using a mask matrix based on prior knowledge, such as GSEA Reactome or C3 gene sets, so tokens represent pathways or regulons; a CLS token is used for cell-type prediction.
- The model is trained supervised on reference scRNA-seq data with cell-type labels, with 30% of the training set used as validation, cross-entropy loss, SGD, cosine learning rate decay, and convergence typically within 20 epochs. Attention scores between CLS and pathway tokens serve as interpretable cell embeddings for downstream UMAP, clustering, and trajectory analyses.
- Benchmarks used six datasets—hArtery, hBone, hPancreas, mBrain, mPancreas, and mAtlas—compared against 18 other annotators, with accuracy defined as the fraction of correctly predicted cells. Integration was assessed with scIB metrics including batch ASW, NMI, ARI, graph connectivity, kBET, and isolated label F1.
Limitations
- The paper states that no statistical method was used to predetermine sample size, experiments were not randomized, and investigators were not blinded to allocation during experiments and outcome assessment.
- Evident from the text: benchmark accuracy depends on “ground truth” labels from original publications, and some comparison methods were not applicable to large or highly batched datasets, which may affect relative rankings.
- Evident from the text: random masks sometimes converged to lower accuracy and required more epochs than knowledge-based masks, though TOSICA was generally robust to mask choice.
Model-written summary. Check it against the paper before relying on it.
Integrity signals
Registry
Cites
Statistics
Figures
Verification
Claims the paper makes
71 Own result · 28 Own interpretation · 18 Not checked yet · 7 No basis given · 4 Own method · 1 Partly supported · accuracy not yet measured
The cited sources support only part of this claim — read each source’s verdict below.
In the paper
“Many unsupervised scRNA-seq clustering methods have been proposed2–4, which are followed by time-consuming and labor-costly annotations5.”
§ Transformer for one stop interpretable cell type annotation > Introduction
What the sources say
- Supportedcites [2] Butler, A., Hoffman, P., Smibert, P., Papalexi, E. & Satija, R. Integrating single-cell transcriptomic data across different conditions, technologies, and species. Nat. Biotechnol. 36, 411–420 (2018). source
The citation is attached to the first clause, about scRNA-seq clustering methods; the annotation-cost claim has a separate citation. The Introduction describes multiple clustering approaches, and Online Methods describes clustering cells using Seurat’s FindClusters function. The source therefore supports the clustering-method claim, without needing to support the annotation claim. (LLM, conf=0.88)
- Partly supportedcites [3] Stuart, T. et al. Comprehensive integration of single-cell data. Cell 177, 1888–1902 e1821 (2019). sourceExperimental — accuracy not yet measured
The STAR Methods (Quantification and statistical analysis; page not provided) describe clustering scRNA-seq cells and then annotating the clusters as cell types using marker genes. That supports the annotation step attributed to this paper by citation 5, but the cited passages do not say that annotation is time-consuming or labor-costly. Citations 2–4, not this paper, are attached to the claim that many clustering methods have been proposed. (LLM, conf=0.82)
- Supportedcites [4] Xu, C. & Su, Z. C. Identification of cell types from single-cell transcriptomes using a novel clustering method. Bioinformatics 31, 1974–1980 (2015). source
The citation to this paper is attached to the first clause, about unsupervised scRNA-seq clustering methods, not to the claim about annotation costs, which has a separate citation. The Introduction describes SNN-Cliq as a clustering method for single-cell gene-expression datasets that automatically determines the number of clusters. (LLM, conf=0.93)
- Supportedcites [5] Xie, B. B., Jiang, Q., Mora, A. & Li, X. R. Automatic cell type identification methods for single-cell RNA sequencing. Comput. Struct. Biotec. 19, 5874–5887 (2021). source
Citation 5 is attached to the claim about annotations. The Introduction says that unsupervised clustering is followed by cluster annotation and that this annotation can be very time-consuming because it requires manual searches of literature and databases. (LLM, conf=0.93)
plaindirect- Asserted: passes — The authors put it forward as true.
- Checkable: passes — It can be checked against evidence.
- Load-bearing: passes — The paper’s conclusions depend on it.
- Based: passes — The paper gives a reason why it holds.
- Supported
A result the paper reports from its own data — it cites no other source for it, so there is none to check. The quote shows it is in the paper.
In the paper
“Three other annotators with high average accuracy, SingleR, SciBet, and ACTINN (Fig. 2a), do not automatically identify ‘alpha’ cells as a new cell type, instead incorrectly label them as ‘PP’, ‘delta’ or ‘beta’ (Supplementary Fig. 9a–c).”
§ Transformer for one stop interpretable cell type annotation > Results > TOSICA enables discovery of new cell types
plaindirect- Asserted: passes — The authors put it forward as true.
- Checkable: passes — It can be checked against evidence.
- Load-bearing: passes — The paper’s conclusions depend on it.
- Based: passes — The paper gives a reason why it holds.
A result the paper reports from its own data — it cites no other source for it, so there is none to check. The quote shows it is in the paper.
In the paper
“On the five cell types, prefibrochondrocytes (preFC), prehypertrophic chondrocytes (preHTC), homeostatic chondrocytes (HomC), regulatory chondrocytes (RegC) and hypertrophic chondrocytes (HTC) that are more unevenly distributed in test or reference set, TOSICA (76.47%) beats the second (SingleR, 63.23%) or third (SciBet, 68.18%) highest mean accuracy methods (Fig. 2e).”
§ Transformer for one stop interpretable cell type annotation > Results > TOSICA is a universal, accurate and efficient cell type annotator
plain- Asserted: passes — The authors put it forward as true.
- Checkable: passes — It can be checked against evidence.
- Load-bearing: passes — The paper’s conclusions depend on it.
- Based: passes — The paper gives a reason why it holds.
A result the paper reports from its own data — it cites no other source for it, so there is none to check. The quote shows it is in the paper.
In the paper
“CaSTLe even simply recognizes most of the cells of all cell types as ‘Unknown’, including the cell types that are well-represented in the training sets (Supplementary Fig. 9f).”
§ Transformer for one stop interpretable cell type annotation > Results > TOSICA enables discovery of new cell types
plain- Asserted: passes — The authors put it forward as true.
- Checkable: passes — It can be checked against evidence.
- Load-bearing: passes — The paper’s conclusions depend on it.
- Based: passes — The paper gives a reason why it holds.
A result the paper reports from its own data — it cites no other source for it, so there is none to check. The quote shows it is in the paper.
In the paper
“Not surprisingly, the cell type distribution of hBone dataset is the most unbalanced between training and test set (Fig. 2a).”
§ Transformer for one stop interpretable cell type annotation > Results > TOSICA is a universal, accurate and efficient cell type annotator
plain- Asserted: passes — The authors put it forward as true.
- Checkable: passes — It can be checked against evidence.
- Load-bearing: unclear — It is unclear whether the paper’s conclusions depend on it.
- Based: passes — The paper gives a reason why it holds.
A result the paper reports from its own data — it cites no other source for it, so there is none to check. The quote shows it is in the paper.
In the paper
“Other methods also predict MHC II as ‘macrophage’ or ‘Unknown’ like TOSICA (Supplementary Fig. 9).”
§ Transformer for one stop interpretable cell type annotation > Results > TOSICA enables discovery of new cell types
plaincorrelational- Asserted: passes — The authors put it forward as true.
- Checkable: passes — It can be checked against evidence.
- Load-bearing: unclear — It is unclear whether the paper’s conclusions depend on it.
- Based: passes — The paper gives a reason why it holds.
A result the paper reports from its own data — it cites no other source for it, so there is none to check. The quote shows it is in the paper.
In the paper
“Benchmarks and case studies confirm the strength of TOSICA in accuracy and robustness for heterogeneous single-cell data, even in the difficult task of uneven abundance of cell types between reference and query.”
§ Transformer for one stop interpretable cell type annotation > Introduction
boostedcorrelational- Asserted: passes — The authors put it forward as true.
- Checkable: passes — It can be checked against evidence.
- Load-bearing: passes — The paper’s conclusions depend on it.
- Based: passes — The paper gives a reason why it holds.
The paper states this without a source or data behind it here, so there is nothing to check it against. The quote shows it is in the paper.
In the paper
“We show that TOSICA achieves fast and accurate one-stop annotation and batch-insensitive integration while providing biologically interpretable insights for understanding cellular behavior during development and disease progressions.”
§ Transformer for one stop interpretable cell type annotation > Abstract
plaindirect- Asserted: passes — The authors put it forward as true.
- Checkable: passes — It can be checked against evidence.
- Load-bearing: passes — The paper’s conclusions depend on it.
- Based: passes — The paper gives a reason why it holds.
A result the paper reports from its own data — it cites no other source for it, so there is none to check. The quote shows it is in the paper.
In the paper
“Most importantly, models with random masks need more epochs to converge (Supplementary Fig. 8c).”
§ Transformer for one stop interpretable cell type annotation > Results > TOSICA is a universal, accurate and efficient cell type annotator
plaindirect- Asserted: passes — The authors put it forward as true.
- Checkable: passes — It can be checked against evidence.
- Load-bearing: unclear — It is unclear whether the paper’s conclusions depend on it.
- Based: passes — The paper gives a reason why it holds.
A result the paper reports from its own data — it cites no other source for it, so there is none to check. The quote shows it is in the paper.
In the paper
“We demonstrate TOSICA’s advantages by applying it to scRNA-seq data of tumor-infiltrating immune cells, and CD14+ monocytes in COVID-19 to reveal rare cell types, heterogeneity and dynamic trajectories associated with disease progression and severity.”
§ Transformer for one stop interpretable cell type annotation > Abstract
boostedcorrelational- Asserted: passes — The authors put it forward as true.
- Checkable: passes — It can be checked against evidence.
- Load-bearing: passes — The paper’s conclusions depend on it.
- Based: passes — The paper gives a reason why it holds.
- It may state two separate claims as one. 44
- Probably not a substantial claim. 10
- The quote only partly states this claim. 1
A result the paper reports from its own data — it cites no other source for it, so there is none to check. The quote shows it is in the paper.
In the paper
“Some cell types are at low abundance in the reference of mAtlas, may be insufficient for training a good predictor, but TOSICA still identifies them well and clusters them together, also separates them from other cell types as much as possible in the query set (Fig. 2b).”
§ Transformer for one stop interpretable cell type annotation > Results > TOSICA enables discovery of new cell types
hedgeddirect- Asserted: passes — The authors put it forward as true.
- Checkable: passes — It can be checked against evidence.
- Load-bearing: passes — The paper’s conclusions depend on it.
- Based: passes — The paper gives a reason why it holds.
It may state two separate claims as one.
The paper states this without a source or data behind it here, so there is nothing to check it against. The quote shows it is in the paper.
In the paper
“By connecting attention to prior biological knowledge and without any batch information, TOSICA interpretably integrates and annotates single-cell data in a batch-insensitive manner while retaining biological variation.”
§ Transformer for one stop interpretable cell type annotation > Introduction
plaindirect- Asserted: passes — The authors put it forward as true.
- Checkable: passes — It can be checked against evidence.
- Load-bearing: passes — The paper’s conclusions depend on it.
- Based: passes — The paper gives a reason why it holds.
It may state two separate claims as one.
A result the paper reports from its own data — it cites no other source for it, so there is none to check. The quote shows it is in the paper.
In the paper
“Notably, on the biggest dataset mAtlas, which also has the most cell types, TOSICA annotated the cells in query with a high accuracy of 81.06%, while the second best tool ACTINN has an accuracy of 79.57%.”
§ Transformer for one stop interpretable cell type annotation > Results > TOSICA is a universal, accurate and efficient cell type annotator
plain- Asserted: passes — The authors put it forward as true.
- Checkable: passes — It can be checked against evidence.
- Load-bearing: passes — The paper’s conclusions depend on it.
- Based: passes — The paper gives a reason why it holds.
It may state two separate claims as one.
A result the paper reports from its own data — it cites no other source for it, so there is none to check. The quote shows it is in the paper.
In the paper
“The accuracy of TOSICA on every dataset ranks at top 6 (Supplementary Dataset 3), and its mean accuracy of 86.69% is the highest among all 19 methods (Fig. 2a).”
§ Transformer for one stop interpretable cell type annotation > Results > TOSICA is a universal, accurate and efficient cell type annotator
plain- Asserted: passes — The authors put it forward as true.
- Checkable: passes — It can be checked against evidence.
- Load-bearing: passes — The paper’s conclusions depend on it.
- Based: passes — The paper gives a reason why it holds.
It may state two separate claims as one.
The paper states this without a source or data behind it here, so there is nothing to check it against. The quote shows it is in the paper.
In the paper
“We show that TOSICA achieves fast and accurate one-stop annotation and batch-insensitive integration while providing biologically interpretable insights for understanding cellular behavior during development and disease progressions.”
§ Transformer for one stop interpretable cell type annotation > Abstract
plaindirect- Asserted: passes — The authors put it forward as true.
- Checkable: passes — It can be checked against evidence.
- Load-bearing: passes — The paper’s conclusions depend on it.
- Based: passes — The paper gives a reason why it holds.
It may state two separate claims as one.
A result the paper reports from its own data — it cites no other source for it, so there is none to check. The quote shows it is in the paper.
In the paper
“Random masks usually can result in the similar accuracy as knowledge-based masks, but in the case of mPancreas dataset, the accuracy converges lower with the random mask (Supplementary Fig. 8c).”
§ Transformer for one stop interpretable cell type annotation > Results > TOSICA is a universal, accurate and efficient cell type annotator
plaindirect- Asserted: passes — The authors put it forward as true.
- Checkable: passes — It can be checked against evidence.
- Load-bearing: unclear — It is unclear whether the paper’s conclusions depend on it.
- Based: passes — The paper gives a reason why it holds.
It may state two separate claims as one.
A result the paper reports from its own data — it cites no other source for it, so there is none to check. The quote shows it is in the paper.
In the paper
“TOSICA not only met the needs for accurate cell type annotation across different datasets, exceeding existing methods in accuracy, but also often do so with reduced time cost.”
§ Transformer for one stop interpretable cell type annotation > Introduction
plaindirect- Asserted: passes — The authors put it forward as true.
- Checkable: passes — It can be checked against evidence.
- Load-bearing: passes — The paper’s conclusions depend on it.
- Based: passes — The paper gives a reason why it holds.
It may state two separate claims as one.
A result the paper reports from its own data — it cites no other source for it, so there is none to check. The quote shows it is in the paper.
In the paper
“As expected, ‘alpha cells’ in the query set of hPancreas are clustered together (Fig. 3a) and 76% of them are labeled as ‘Unknown’ by TOSICA (Fig. 3b), while the rest are labeled as ‘pancreatic polypeptide cell’ (PP), which is also an endocrine cell (Fig. 3b).”
§ Transformer for one stop interpretable cell type annotation > Results > TOSICA enables discovery of new cell types
plaindirect- Asserted: passes — The authors put it forward as true.
- Checkable: passes — It can be checked against evidence.
- Load-bearing: passes — The paper’s conclusions depend on it.
- Based: passes — The paper gives a reason why it holds.
It may state two separate claims as one.
The paper states this without a source or data behind it here, so there is nothing to check it against. The quote shows it is in the paper.
In the paper
“When tested on many datasets, TOSICA provides the advantage to interpret the attention feature genes and pathways, and surprisingly also automatically filtering out batch effect, potentially as a consequence of direct mapping of cell types to genes (or pathways when using a pathway mask).”
§ Transformer for one stop interpretable cell type annotation > Introduction
hedgedconditional- Asserted: passes — The authors put it forward as true.
- Checkable: passes — It can be checked against evidence.
- Load-bearing: passes — The paper’s conclusions depend on it.
- Based: passes — The paper gives a reason why it holds.
It may state two separate claims as one.
A result the paper reports from its own data — it cites no other source for it, so there is none to check. The quote shows it is in the paper.
In the paper
“On contrary, CELLBLAST and chetah, two annotators that actively identify new cell types, label ‘alpha’ cells with 99% and 62% as ‘PP’, with 0 and 37% as a new cell type, respectively (Supplementary Fig. 9d, e).”
§ Transformer for one stop interpretable cell type annotation > Results > TOSICA enables discovery of new cell types
plain- Asserted: passes — The authors put it forward as true.
- Checkable: passes — It can be checked against evidence.
- Load-bearing: passes — The paper’s conclusions depend on it.
- Based: passes — The paper gives a reason why it holds.
It may state two separate claims as one.
A result the paper reports from its own data — it cites no other source for it, so there is none to check. The quote shows it is in the paper.
In the paper
“Meanwhile, with the increase of the dataset size, time cost of TOSICA on mAtlas is the fourth shortest and does not explode exponentially like most of the other methods (Fig. 2c).”
§ Transformer for one stop interpretable cell type annotation > Results > TOSICA is a universal, accurate and efficient cell type annotator
plaincorrelational- Asserted: passes — The authors put it forward as true.
- Checkable: passes — It can be checked against evidence.
- Load-bearing: passes — The paper’s conclusions depend on it.
- Based: passes — The paper gives a reason why it holds.
It may state two separate claims as one.
A result the paper reports from its own data — it cites no other source for it, so there is none to check. The quote shows it is in the paper.
In the paper
“There is also another rare cell type only appeared in query, ‘MHC class II’ cell, and is annotated as ‘macrophage’ or ‘Unknown’ and clustered separately by TOSICA (Fig. 3a, b).”
§ Transformer for one stop interpretable cell type annotation > Results > TOSICA enables discovery of new cell types
plaincorrelationalSingle case- Asserted: passes — The authors put it forward as true.
- Checkable: passes — It can be checked against evidence.
- Load-bearing: passes — The paper’s conclusions depend on it.
- Based: passes — The paper gives a reason why it holds.
It may state two separate claims as one.
A result the paper reports from its own data — it cites no other source for it, so there is none to check. The quote shows it is in the paper.
In the paper
“Although TOSICA ranks fifth and sixth on two easy-to-classify datasets (hArtery and hPancreas), where all top six methods have above 90% accuracy, its accuracy of 93.75% and 95.76% is close to the top-ranked methods (Seurat 96.37% for hArtery and SingleCellNet 97.53% for hPancreas).”
§ Transformer for one stop interpretable cell type annotation > Results > TOSICA is a universal, accurate and efficient cell type annotator
plain- Asserted: passes — The authors put it forward as true.
- Checkable: passes — It can be checked against evidence.
- Load-bearing: unclear — It is unclear whether the paper’s conclusions depend on it.
- Based: passes — The paper gives a reason why it holds.
It may state two separate claims as one.
A result the paper reports from its own data — it cites no other source for it, so there is none to check. The quote shows it is in the paper.
In the paper
“Conspicuously, while scGen and Seurat show excellent ability on datasets with fewer batches and cells, neither of them works on mouse atlas dataset, on which TOSICA ranks at the top in both batch effect removal and biological conservation (Supplementary Fig. 11b).”
§ Transformer for one stop interpretable cell type annotation > Results > TOSICA is immune to batch effect
plaincorrelationalSingle case- Asserted: passes — The authors put it forward as true.
- Checkable: passes — It can be checked against evidence.
- Load-bearing: passes — The paper’s conclusions depend on it.
- Based: passes — The paper gives a reason why it holds.
It may state two separate claims as one.
The paper states this without a source or data behind it here, so there is nothing to check it against. The quote shows it is in the paper.
In the paper
“Note that Seurat-based methods, including Seurat v3 CCA and Seurat v3 RPCA, are unable to integrate datasets from more than 85 batches, these methods are thus not applicable for comparison.”
§ Transformer for one stop interpretable cell type annotation > Results > TOSICA parses tumor infiltrating myeloid cells heterogeneity with high resolution
plaindirect- Asserted: passes — The authors put it forward as true.
- Checkable: passes — It can be checked against evidence.
- Load-bearing: passes — The paper’s conclusions depend on it.
- Based: fails — The paper may give no reason why it holds.
Probably not a substantial claim. The paper may give no reason why it holds. It may state two separate claims as one.
A result the paper reports from its own data — it cites no other source for it, so there is none to check. The quote shows it is in the paper.
In the paper
“On 2 of the 5 test datasets, which have more cells, the batch ASW of TOSICA ranks in the top 2 and is only slightly lower (0.02–0.06 or 2.1–5.6%) than the top 1 method’s batch ASW (Supplementary Fig. 11b).”
§ Transformer for one stop interpretable cell type annotation > Results > TOSICA is immune to batch effect
plaincorrelational- Asserted: passes — The authors put it forward as true.
- Checkable: passes — It can be checked against evidence.
- Load-bearing: passes — The paper’s conclusions depend on it.
- Based: passes — The paper gives a reason why it holds.
It may state two separate claims as one.
A result the paper reports from its own data — it cites no other source for it, so there is none to check. The quote shows it is in the paper.
In the paper
“We find that MM and MP are distinguished by MIR-6382 and MIR-29B-3P regulons (Fig. 3d), with attention score of MIR-29B-3P higher in MP.”
§ Transformer for one stop interpretable cell type annotation > Results > TOSICA provides high resolution and interpretable cell type annotation
plaincorrelational- Asserted: passes — The authors put it forward as true.
- Checkable: passes — It can be checked against evidence.
- Load-bearing: passes — The paper’s conclusions depend on it.
- Based: passes — The paper gives a reason why it holds.
It may state two separate claims as one.
A result the paper reports from its own data — it cites no other source for it, so there is none to check. The quote shows it is in the paper.
In the paper
“Principal component analysis of the original expression matrix also shows that MP shares similar PCs with PP (reference Prlf. Acinar, TOSICA Prlf. Acinar) compared with other MM, where the transition ordering is visible on PC1 (Supplementary Fig. 11a).”
§ Transformer for one stop interpretable cell type annotation > Results > TOSICA provides high resolution and interpretable cell type annotation
plaincorrelational- Asserted: passes — The authors put it forward as true.
- Checkable: passes — It can be checked against evidence.
- Load-bearing: passes — The paper’s conclusions depend on it.
- Based: passes — The paper gives a reason why it holds.
It may state two separate claims as one.
A result the paper reports from its own data — it cites no other source for it, so there is none to check. The quote shows it is in the paper.
In the paper
“Also, TOSICA is robust against the choice of masks in its of batch effect removal ability, except batch effects removal ability is unexpectedly slightly stronger when using random masks, and it is expected that some knowledge-based masks are better than others for a specific dataset, for example for hBone (Supplementary Fig. 11b).”
§ Transformer for one stop interpretable cell type annotation > Results > TOSICA is immune to batch effect
plain- Asserted: passes — The authors put it forward as true.
- Checkable: passes — It can be checked against evidence.
- Load-bearing: unclear — It is unclear whether the paper’s conclusions depend on it.
- Based: passes — The paper gives a reason why it holds.
It may state two separate claims as one.
A result the paper reports from its own data — it cites no other source for it, so there is none to check. The quote shows it is in the paper.
In the paper
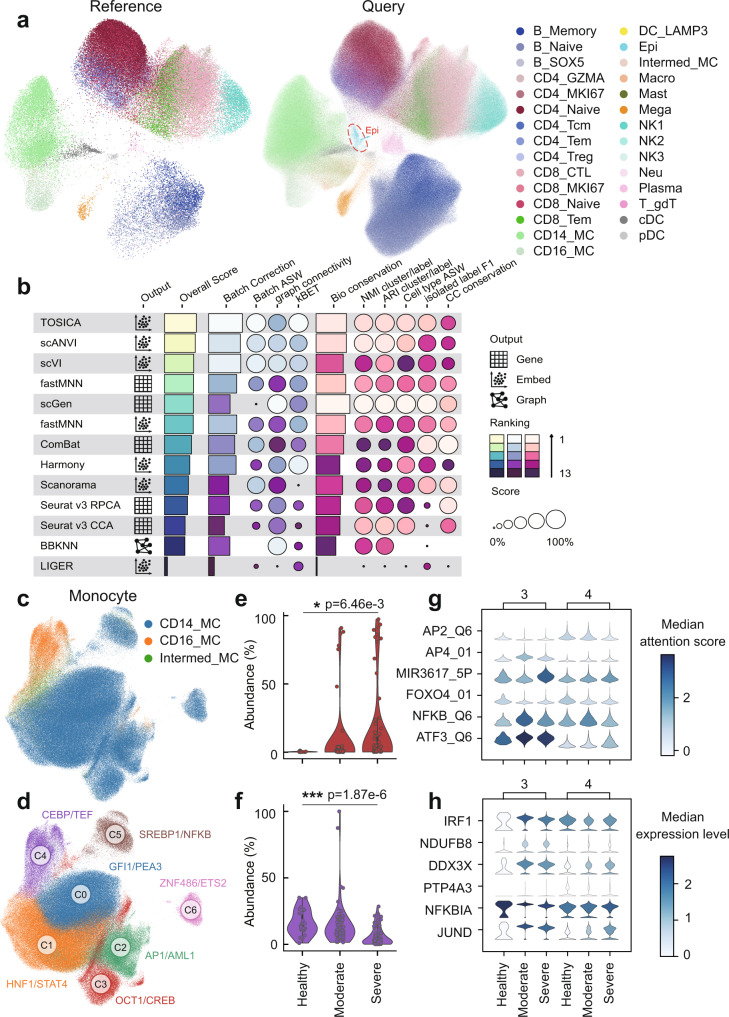
“Among all cell types, DC_LAMP3, Epi and Mast are unknown cell types for reference but TOSICA can still identify them de novo as an isolated cluster on UMAP (Fig. 5a and Supplementary Fig. 15a) with little batch effect (Supplementary Fig. 15b).”
§ Transformer for one stop interpretable cell type annotation > Results > TOSICA hierarchically interprets the immune response of patients with COVID-19 and SLE
plaindirect- Asserted: passes — The authors put it forward as true.
- Checkable: passes — It can be checked against evidence.
- Load-bearing: passes — The paper’s conclusions depend on it.
- Based: passes — The paper gives a reason why it holds.
It may state two separate claims as one.
A result the paper reports from its own data — it cites no other source for it, so there is none to check. The quote shows it is in the paper.
In the paper
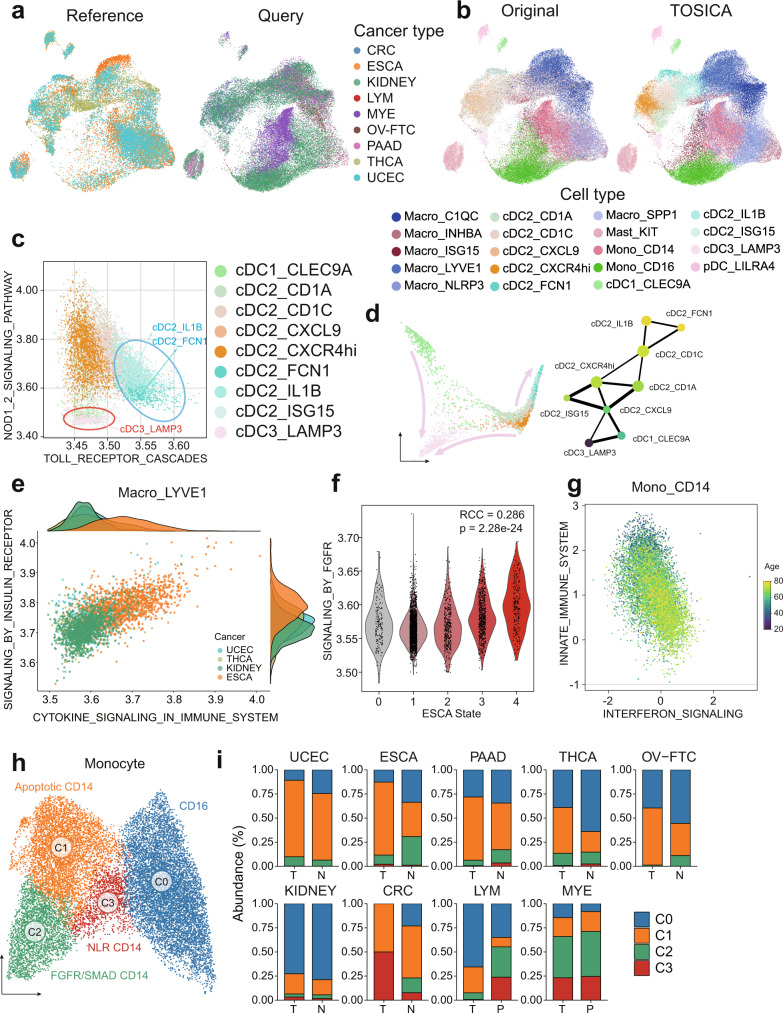
“INNATE_IMMUNE_SYSTEM is downregulated and INTERFERON_SIGNALING is upregulated during aging in Mono_CD14.”
§ Transformer for one stop interpretable cell type annotation > Results > TOSICA parses tumor infiltrating myeloid cells heterogeneity with high resolution
plaindirect- Asserted: passes — The authors put it forward as true.
- Checkable: passes — It can be checked against evidence.
- Load-bearing: unclear — It is unclear whether the paper’s conclusions depend on it.
- Based: passes — The paper gives a reason why it holds.
It may state two separate claims as one.
A result the paper reports from its own data — it cites no other source for it, so there is none to check. The quote shows it is in the paper.
In the paper
“In addition, the runtime of TOSICA is the shortest (minutes), while it takes scGen nearly five days to finish (Supplementary Fig. 13c).”
§ Transformer for one stop interpretable cell type annotation > Results > TOSICA reveals tumor infiltrating T cells dynamics
plain- Asserted: passes — The authors put it forward as true.
- Checkable: passes — It can be checked against evidence.
- Load-bearing: unclear — It is unclear whether the paper’s conclusions depend on it.
- Based: passes — The paper gives a reason why it holds.
It may state two separate claims as one.
The paper states this without a source or data behind it here, so there is nothing to check it against. The quote shows it is in the paper.
In the paper
“In contrast, despite no batch information is included in either the training set or test set when they both comes from different batches, different studies or subjects (Supplementary Dataset 1), TOSICA can consistently predict cell types with great accuracy (Fig. 2a) and generate batch insensitive embedding, perhaps due to direct mapping of cell types to genes (or pathways when using a pathway”
§ Transformer for one stop interpretable cell type annotation > Results > TOSICA is immune to batch effect
hedged- Asserted: passes — The authors put it forward as true.
- Checkable: passes — It can be checked against evidence.
- Load-bearing: passes — The paper’s conclusions depend on it.
- Based: passes — The paper gives a reason why it holds.
It may state two separate claims as one.
A result the paper reports from its own data — it cites no other source for it, so there is none to check. The quote shows it is in the paper.
In the paper
“TOSICA’s TF regulon attentions in C3 and C4 show that AP2_Q6 and FOXO4_01 have low activities and AP4_01, MIR3617_5P, NFKB_Q6, and ATF3_Q6 have upregulated activities during COVID-19 disease progression (Fig. 5g).”
§ Transformer for one stop interpretable cell type annotation > Results > TOSICA hierarchically interprets the immune response of patients with COVID-19 and SLE
plaincorrelational- Asserted: passes — The authors put it forward as true.
- Checkable: passes — It can be checked against evidence.
- Load-bearing: passes — The paper’s conclusions depend on it.
- Based: passes — The paper gives a reason why it holds.
It may state two separate claims as one.
The paper states this without a source or data behind it here, so there is nothing to check it against. The quote shows it is in the paper.
In the paper
“Typically, TOSCIA converges within 20 epochs.”
§ Transformer for one stop interpretable cell type annotation > Methods > Model training
hedged- Asserted: passes — The authors put it forward as true.
- Checkable: passes — It can be checked against evidence.
- Load-bearing: fails — The paper’s conclusions may not depend on it.
- Based: fails — The paper may give no reason why it holds.
Probably not a substantial claim. The paper’s conclusions may not depend on it. The paper may give no reason why it holds. The quote only partly states this claim.
In the paper
“Transformer is successful in interpretability benefited by self-attention mechanism, which calculates the relationship (referred to as “attention”) between tokens of object representation12.”
§ Transformer for one stop interpretable cell type annotation > Results > The structure of TOSICA
What the sources say
- Not checked yetcites [12] Vaswani, A. et al. Attention is all you need. In Advances in Neural Information Processing Systems Vol. 32 (NeurIPS 2017); https://papers.nips.cc/paper/2017/hash/3f5ee243547dee91fbd053c1c4a845aa-Abstract.html.
plaindirect- Asserted: passes — The authors put it forward as true.
- Checkable: passes — It can be checked against evidence.
- Load-bearing: passes — The paper’s conclusions depend on it.
- Based: passes — The paper gives a reason why it holds.
Probably not a substantial claim.
A conclusion the paper draws from its own results — it cites no other source for it, so there is none to check. The quote shows it is in the paper.
In the paper
“Through supervised training, our model learns the projection function from gene expression to cell type, meanwhile transfers high-dimensional and sparse expression space to low-dimensional and dense feature space.”
§ Transformer for one stop interpretable cell type annotation > Results > The structure of TOSICA
plaindirect- Asserted: passes — The authors put it forward as true.
- Checkable: passes — It can be checked against evidence.
- Load-bearing: passes — The paper’s conclusions depend on it.
- Based: passes — The paper gives a reason why it holds.
Probably not a substantial claim. It may state two separate claims as one.
A conclusion the paper draws from its own results — it cites no other source for it, so there is none to check. The quote shows it is in the paper.
In the paper
“So TOSICA is not limited by expert knowledge and robust to mask choice, and one can choose mask depending on biological context or research interests, but expert knowledge helps to converge to the best model faster.”
§ Transformer for one stop interpretable cell type annotation > Results > TOSICA is a universal, accurate and efficient cell type annotator
plain- Asserted: passes — The authors put it forward as true.
- Checkable: passes — It can be checked against evidence.
- Load-bearing: passes — The paper’s conclusions depend on it.
- Based: passes — The paper gives a reason why it holds.
It may state two separate claims as one.
None of the sources cited for this claim have been checked yet.
In the paper
“However, the Transformer framework does not involve dimensionality reduction10,12, thus keeping all attention layer traceable to the original input features13, thus making the models interpretable.”
§ Transformer for one stop interpretable cell type annotation > Introduction
What the sources say
- Not checked yetcites [10] Ranftl, R., Bochkovskiy, A. & Koltun, V. J. a. e.-p. Vision transformers for dense prediction. In Proceedings of the IEEE/CVF International Conference on Computer Vision, 12179–12188 (ICCV, 2021). source
- Not checked yetcites [12] Vaswani, A. et al. Attention is all you need. In Advances in Neural Information Processing Systems Vol. 32 (NeurIPS 2017); https://papers.nips.cc/paper/2017/hash/3f5ee243547dee91fbd053c1c4a845aa-Abstract.html.
- Not checked yetcites [13] Abnar, S. & Zuidema, W. J. a. e.-p. Quantifying attention flow in transformers. Preprint at https://arxiv.org/abs/2005.00928 (2020). source
plaindirect- Asserted: passes — The authors put it forward as true.
- Checkable: passes — It can be checked against evidence.
- Load-bearing: passes — The paper’s conclusions depend on it.
- Based: passes — The paper gives a reason why it holds.
It may state two separate claims as one.
None of the sources cited for this claim have been checked yet.
In the paper
“For example, the change of dimensions and non-linear aggregation of features throughout the autoencoder’s deep processing stages leads to untraceable and uninterpretable latent space and loss of information and feature resolution9,10.”
§ Transformer for one stop interpretable cell type annotation > Introduction
What the sources say
- Not checked yetcites [9] Gong, C., Wang, D., Li, M., Chandra, V. & Liu, Q. J. a. e.-p. Vision transformers with patch diversification. Preprint at https://arxiv.org/abs/2104.12753 (2021).
- Not checked yetcites [10] Ranftl, R., Bochkovskiy, A. & Koltun, V. J. a. e.-p. Vision transformers for dense prediction. In Proceedings of the IEEE/CVF International Conference on Computer Vision, 12179–12188 (ICCV, 2021). source
plaindirect- Asserted: passes — The authors put it forward as true.
- Checkable: passes — It can be checked against evidence.
- Load-bearing: passes — The paper’s conclusions depend on it.
- Based: passes — The paper gives a reason why it holds.
It may state two separate claims as one.
In the paper
“An important step in scRNA-seq analysis is to identify cell populations or types by clustering1.”
§ Transformer for one stop interpretable cell type annotation > Introduction
What the sources say
- Not checked yetcites [1] Sandberg, R. Entering the era of single-cell transcriptomics in biology and medicine. Nat. Methods 11, 22–24 (2014). source
plain- Asserted: passes — The authors put it forward as true.
- Checkable: passes — It can be checked against evidence.
- Load-bearing: fails — The paper’s conclusions may not depend on it.
- Based: passes — The paper gives a reason why it holds.
Probably not a substantial claim. The paper’s conclusions may not depend on it.
In the paper
“In addition, with the increase of non-linear aggregation layers to achieve more powerful learning capability, the model gets deeper meanwhile the contribution from input gets harder to trace, which leads to the loss of interpretability11.”
§ Transformer for one stop interpretable cell type annotation > Introduction
What the sources say
- Not checked yetcites [11] Li, X. et al. Interpretable deep learning: interpretation, interpretability, trustworthiness, and beyond. Knowl Inf Syst 64, 3197–3234 (2022). source
plaindirect- Asserted: passes — The authors put it forward as true.
- Checkable: passes — It can be checked against evidence.
- Load-bearing: passes — The paper’s conclusions depend on it.
- Based: passes — The paper gives a reason why it holds.
It may state two separate claims as one.
A conclusion the paper draws from its own results — it cites no other source for it, so there is none to check. The quote shows it is in the paper.
In the paper
“Altogether, TOSICA has an acceptable time cost on large datasets, while performs better than any other methods on tough tasks, making it a universal cell type annotator.”
§ Transformer for one stop interpretable cell type annotation > Results > TOSICA is a universal, accurate and efficient cell type annotator
plain- Asserted: passes — The authors put it forward as true.
- Checkable: passes — It can be checked against evidence.
- Load-bearing: passes — The paper’s conclusions depend on it.
- Based: passes — The paper gives a reason why it holds.
It may state two separate claims as one.
A conclusion the paper draws from its own results — it cites no other source for it, so there is none to check. The quote shows it is in the paper.
In the paper
“Thus, across different datasets, the same cell may have different marker gene sets, thus annotated differently.”
§ Transformer for one stop interpretable cell type annotation > Results > TOSICA provides high resolution and interpretable cell type annotation
hedgedconditional- Asserted: passes — The authors put it forward as true.
- Checkable: passes — It can be checked against evidence.
- Load-bearing: passes — The paper’s conclusions depend on it.
- Based: passes — The paper gives a reason why it holds.
It may state two separate claims as one.
- Rests on an assumption: Specificity of marker genes is determined by comparing with the other cell types in the same dataset.
None of the sources cited for this claim have been checked yet.
In the paper
“Indeed, the homolog of CEBP has been reported to inhibit proliferation of mouse chondrocytes in vitro45, and Nf1 ablation in Fgfr1Col2cKO mice reverses their hypertrophic zone phenotype46.”
§ Transformer for one stop interpretable cell type annotation > Results > TOSICA enables interpretable dynamic trajectory analysis
What the sources say
- Not checked yetcites [45] Okuma, T. et al. Regulation of mouse chondrocyte differentiation by CCAAT/enhancer-binding proteins. Biomed. Res. 36, 21–29 (2015). source
- Not checked yetcites [46] Karolak, M. R., Yang, X. & Elefteriou, F. FGFR1 signaling in hypertrophic chondrocytes is attenuated by the Ras-GAP neurofibromin during endochondral bone formation. Hum. Mol. Genet. 24, 2552–2564 (2015). source
plaindirect- Asserted: passes — The authors put it forward as true.
- Checkable: passes — It can be checked against evidence.
- Load-bearing: passes — The paper’s conclusions depend on it.
- Based: passes — The paper gives a reason why it holds.
It may state two separate claims as one.
A conclusion the paper draws from its own results — it cites no other source for it, so there is none to check. The quote shows it is in the paper.
In the paper
“Due to the good interpretability of attention score, it can well reconstruct the trajectory and reveal the key pathways in the biological process.”
§ Transformer for one stop interpretable cell type annotation > Results > TOSICA enables interpretable dynamic trajectory analysis
boosteddirect- Asserted: passes — The authors put it forward as true.
- Checkable: passes — It can be checked against evidence.
- Load-bearing: passes — The paper’s conclusions depend on it.
- Based: passes — The paper gives a reason why it holds.
It may state two separate claims as one.
A conclusion the paper draws from its own results — it cites no other source for it, so there is none to check. The quote shows it is in the paper.
In the paper
“Furthermore, as shown by the discovery of MIR-29B-3P regulon (Fig. 3d) and its important target gene Sparc in the development of acinar cell (Supplementary Fig. 10a), the interpretability does not stop at the high-level structures, the important low-level entities, genes, that significantly contribute to these high-level annotations are also available from the networks within TOSICA (Supplementary”
§ Transformer for one stop interpretable cell type annotation > Results > Interpretability of TOSICA is hierarchical
plaincorrelational- Asserted: passes — The authors put it forward as true.
- Checkable: passes — It can be checked against evidence.
- Load-bearing: passes — The paper’s conclusions depend on it.
- Based: passes — The paper gives a reason why it holds.
It may state two separate claims as one.
A conclusion the paper draws from its own results — it cites no other source for it, so there is none to check. The quote shows it is in the paper.
In the paper
“Instead, by embedding genes to higher level of biological processes tokens, TOSICA directly learns the biological processes and signaling pathways giving rise to the cell types, thus separating cell types, including new cell types (Fig. 2d) with accurate high-resolution annotation (Fig. 3d) and allowing direct trajectory regulation discovery (Fig. 3g), while immune to batch effect (Supplementary”
§ Transformer for one stop interpretable cell type annotation > Results > Interpretability of TOSICA is hierarchical
plaindirect- Asserted: passes — The authors put it forward as true.
- Checkable: passes — It can be checked against evidence.
- Load-bearing: passes — The paper’s conclusions depend on it.
- Based: passes — The paper gives a reason why it holds.
It may state two separate claims as one.
A conclusion the paper draws from its own results — it cites no other source for it, so there is none to check. The quote shows it is in the paper.
In the paper
“This high-level attention framework not only allows interpretability but is essential for the high accuracy of TOSICA (Fig. 2a).”
§ Transformer for one stop interpretable cell type annotation > Results > Interpretability of TOSICA is hierarchical
plaindirect- Asserted: passes — The authors put it forward as true.
- Checkable: passes — It can be checked against evidence.
- Load-bearing: passes — The paper’s conclusions depend on it.
- Based: passes — The paper gives a reason why it holds.
It may state two separate claims as one.
None of the sources cited for this claim have been checked yet.
In the paper
“This is in agreement with previous observations showing low expression of Toll-like receptor (TLR) signaling genes and low innate immune activity of cDC3_LAMP348 and the “pro-inflammatory” properties of cDC2_FCN1 and cDC2_IL1B in blood51.”
§ Transformer for one stop interpretable cell type annotation > Results > TOSICA parses tumor infiltrating myeloid cells heterogeneity with high resolution
What the sources say
- Not checked yetcites [48] Cheng, S. et al. A pan-cancer single-cell transcriptional atlas of tumor infiltrating myeloid cells. Cell 184, 792–809 e723 (2021). source
- Not checked yetcites [51] Dutertre, C. A. et al. Single-cell analysis of human mononuclear phagocytes reveals subset-defining markers and identifies circulating inflammatory dendritic cells. Immunity 51, 573–589 e578 (2019). source
plain- Asserted: passes — The authors put it forward as true.
- Checkable: passes — It can be checked against evidence.
- Load-bearing: fails — The paper’s conclusions may not depend on it.
- Based: passes — The paper gives a reason why it holds.
Probably not a substantial claim. The paper’s conclusions may not depend on it. It may state two separate claims as one.
A conclusion the paper draws from its own results — it cites no other source for it, so there is none to check. The quote shows it is in the paper.
In the paper
“Thus, TOSICA’s gene set attentions automatically distinguish cells originally labeled as Mat. Acinar and Prlf. Acinar, and further identified an intermediate state between the two, which is closer to Prlf. Acinar and incorrectly labeled as Mat. Acinar in the annotation database.”
§ Transformer for one stop interpretable cell type annotation > Results > TOSICA provides high resolution and interpretable cell type annotation
plaindirect- Asserted: passes — The authors put it forward as true.
- Checkable: passes — It can be checked against evidence.
- Load-bearing: passes — The paper’s conclusions depend on it.
- Based: passes — The paper gives a reason why it holds.
It may state two separate claims as one.
A conclusion the paper draws from its own results — it cites no other source for it, so there is none to check. The quote shows it is in the paper.
In the paper
“With high biological resolution and batch insensitivity of attention (Supplementary Fig. 12a), TOSICA reveals many novel dynamic and functional status of single cells, with their key contributors hierarchically annotated at both pathway and gene levels to guide further experimental explorations.”
§ Transformer for one stop interpretable cell type annotation > Results > TOSICA parses tumor infiltrating myeloid cells heterogeneity with high resolution
plaindirect- Asserted: passes — The authors put it forward as true.
- Checkable: passes — It can be checked against evidence.
- Load-bearing: passes — The paper’s conclusions depend on it.
- Based: passes — The paper gives a reason why it holds.
It may state two separate claims as one.
A conclusion the paper draws from its own results — it cites no other source for it, so there is none to check. The quote shows it is in the paper.
In the paper
“These results indicate that TOSICA is insensitive to batch effect and good at biological conservation, and excels on large datasets with many batches, especially considering that we never provide batch information to it.”
§ Transformer for one stop interpretable cell type annotation > Results > TOSICA is immune to batch effect
hedged- Asserted: passes — The authors put it forward as true.
- Checkable: passes — It can be checked against evidence.
- Load-bearing: passes — The paper’s conclusions depend on it.
- Based: passes — The paper gives a reason why it holds.
It may state two separate claims as one.
A conclusion the paper draws from its own results — it cites no other source for it, so there is none to check. The quote shows it is in the paper.
In the paper
“Furthermore, benefiting from its high resolution, TOSICA identifies several subtypes of monocytes that have not been discovered in the original publication48 (Fig. 4h), all having their own biological signatures and potentially different functions (Supplementary Fig. 12e).”
§ Transformer for one stop interpretable cell type annotation > Results > TOSICA parses tumor infiltrating myeloid cells heterogeneity with high resolution
hedgedcorrelational- Asserted: passes — The authors put it forward as true.
- Checkable: passes — It can be checked against evidence.
- Load-bearing: passes — The paper’s conclusions depend on it.
- Based: passes — The paper gives a reason why it holds.
It may state two separate claims as one.
A conclusion the paper draws from its own results — it cites no other source for it, so there is none to check. The quote shows it is in the paper.
In the paper
“The various systems level comparisons with existing methods and case-by-case close examination of different datasets and tasks demonstrate the accuracy, robustness, flexibility, and generalizability of TOSICA as an indispensable new tool for advancing the single-cell studies.”
§ Transformer for one stop interpretable cell type annotation > Discussion
boosteddirect- Asserted: passes — The authors put it forward as true.
- Checkable: passes — It can be checked against evidence.
- Load-bearing: passes — The paper’s conclusions depend on it.
- Based: unclear — It is unclear why the paper says it holds.
It may state two separate claims as one.
A conclusion the paper draws from its own results — it cites no other source for it, so there is none to check. The quote shows it is in the paper.
In the paper
“In this study, we develop and establish TOSICA, a Transformer-based cell type annotation and integration tool that offers accurate, transferrable, high-resolution, batch insensitive, biologically interpretable cell type annotations under many scenarios, including but not limited to new cell type discovery, dynamic trajectory analysis, cross platform, and population dataset integration.”
§ Transformer for one stop interpretable cell type annotation > Discussion
plaindirect- Asserted: passes — The authors put it forward as true.
- Checkable: passes — It can be checked against evidence.
- Load-bearing: passes — The paper’s conclusions depend on it.
- Based: passes — The paper gives a reason why it holds.
It may state two separate claims as one.
What the paper did — it cites no source for this, so there is none to check. The quote shows it is in the paper.
In the paper
“Only data with poor labels were excluded from the analyses.”
§ Transformer for one stop interpretable cell type annotation > Methods > Statistics and reproducibility
plain- Asserted: passes — The authors put it forward as true.
- Checkable: passes — It can be checked against evidence.
- Load-bearing: fails — The paper’s conclusions may not depend on it.
- Based: passes — The paper gives a reason why it holds.
Probably not a substantial claim. The paper’s conclusions may not depend on it.
What the paper did — it cites no source for this, so there is none to check. The quote shows it is in the paper.
In the paper
“The experiments were not randomized.”
§ Transformer for one stop interpretable cell type annotation > Methods > Statistics and reproducibility
plain- Asserted: passes — The authors put it forward as true.
- Checkable: passes — It can be checked against evidence.
- Load-bearing: fails — The paper’s conclusions may not depend on it.
- Based: passes — The paper gives a reason why it holds.
Probably not a substantial claim. The paper’s conclusions may not depend on it.
What the paper did — it cites no source for this, so there is none to check. The quote shows it is in the paper.
In the paper
“No statistical method was used to predetermine sample size.”
§ Transformer for one stop interpretable cell type annotation > Methods > Statistics and reproducibility
plain- Asserted: passes — The authors put it forward as true.
- Checkable: passes — It can be checked against evidence.
- Load-bearing: fails — The paper’s conclusions may not depend on it.
- Based: passes — The paper gives a reason why it holds.
Probably not a substantial claim. The paper’s conclusions may not depend on it.
What the paper did — it cites no source for this, so there is none to check. The quote shows it is in the paper.
In the paper
“The investigators were not blinded to allocation during experiments and outcome assessment.”
§ Transformer for one stop interpretable cell type annotation > Methods > Statistics and reproducibility
plain- Asserted: passes — The authors put it forward as true.
- Checkable: passes — It can be checked against evidence.
- Load-bearing: fails — The paper’s conclusions may not depend on it.
- Based: passes — The paper gives a reason why it holds.
Probably not a substantial claim. The paper’s conclusions may not depend on it.
A conclusion the paper draws from its own results — it cites no other source for it, so there is none to check. The quote shows it is in the paper.
In the paper
“The intelligible and interpretable high-resolution annotation transfer between completely independent studies on different biological processes is demonstrated, thus allowing interdisciplinary data integration of single-cell studies.”
§ Transformer for one stop interpretable cell type annotation > Results > TOSICA hierarchically interprets the immune response of patients with COVID-19 and SLE
boosteddirect- Asserted: passes — The authors put it forward as true.
- Checkable: passes — It can be checked against evidence.
- Load-bearing: passes — The paper’s conclusions depend on it.
- Based: passes — The paper gives a reason why it holds.
It may state two separate claims as one.
The paper relies on this without support.
Consistent annotation transfer from reference dataset to query dataset is fundamental to the development and reproducibility of single-cell research.
“Consistent annotation transfer from reference dataset to query dataset is fundamental to the development and reproducibility of single-cell research.”
The paper relies on this without support.
Deep learning based methods are faster and more automated than traditional annotation methods.
“Compared with traditional annotation methods, deep learning based methods are faster and more automated.”
The paper relies on this without support.
Traditional annotation methods often consist of preprocessing, dimensionality reduction, clustering, differential analysis, and manual annotation based on prior knowledge.
“These traditional methods often consist of preprocessing, dimensionality reduction, clustering, differential analysis, and manual annotation based on prior knowledge.”
The paper relies on this without support.
When subtypes are annotated manually based on a small set of marker genes, the same subtype can sometimes be given a new name in another research due to a slight difference.
“When subtypes are annotated manually based on a small set of marker genes, the same subtype can sometimes be given a new name in another research due to a slight difference.”
The paper relies on this without support.
Transferring cell type annotation from a reference dataset to newly generated query datasets with consistency and reproducibility is increasingly important and necessary.
“Thus, transferring cell type annotation from a reference dataset to newly generated query datasets with consistency and reproducibility is increasingly important and necessary.”
The paper relies on this without support.
Specificity of marker genes is determined by comparing with the other cell types in the same dataset.
“However, specificity of marker genes is determined by comparing with the other cell types in the same dataset.”
The paper relies on this without support.
All previous cell type annotators are gene-based, thus reveal little on the biological insight behind the cell type marker genes, many more subsequent analyses are needed to infer the potential enriched pathways and regulators behind the marker genes.
“All previous cell type annotators are gene-based, thus reveal little on the biological insight behind the cell type marker genes, many more subsequent analyses are needed to infer the potential enriched pathways and regulators behind the marker genes.”
The paper relies on this without support.
One of the most common demands in single-cell analysis is the transfer of identified cell population from an original reference to newly generated data, which may come from different batch and biological state.
“One of the most common demands in single-cell analysis is the transfer of identified cell population from an original reference to newly generated data, which may come from different batch and biological state (e.g., disease).”
The paper relies on this without support.
Query and reference datasets are generated in different laboratories with different experimental protocols and thus contain batch effects.
“Generally, query and reference datasets are generated in different laboratories with different experimental protocols and thus contain batch effects.”
The paper relies on this without support.
Batch information is necessary for conventional data-integration method to try to overcome these batch effects.
“Batch information is necessary for conventional data-integration method to try to overcome these batch effects, which are difficult to completely remove and mixed up with biological differences.”
Claims other papers make about this one
Each is checked against this paper’s own text: does it say what the citing paper says it does?
In the citing paper
“The pancreas dataset contained human pancreas cells from five different scRNA-seq studies, which were reprocessed by Chen at al. [20].”
From A Deep Dive into Single-Cell RNA Sequencing Foundation Models (2023) · cites this paper as [20]
Self-check
Percentages, sums and reported differences re-computed from the paper’s own numbers.
Each contradiction between two passages listed here was confirmed by an independent check.
Rated major: it would touch a result — a value a result rests on, reported and recomputed p-values on opposite sides of the significance level, two passages that conflict with no sign which is right, or a cited work retracted before this paper was published.
In the paper
§ Transformer for one stop interpretable cell type annotation > Results > TOSICA hierarchically interprets the immune response of patients with COVID-19 and SLE
“e, f Subtype 3 monocytes increases (e) and subtype 4 decreases (f) in abundance from healthy (N = 25), to moderate (N = 79), and to severe (N = 91) COVID-19.”
§ Transformer for one stop interpretable cell type annotation > Results > TOSICA hierarchically interprets the immune response of patients with COVID-19 and SLE
“Among them, C3 population (high activity of OCT1 and CREB) decreases and C4 population (high activity of CEBP and TEF) increases during COVID-19 progression from healthy to moderate to severe (Fig. 5e, f).”
Rated minor: it would not touch a result — a value no result rests on, a p-value that stays on the same side of the significance level, or a conflict that is clerical, resolved elsewhere in the paper, or outside its own findings.
In the paper
§ Transformer for one stop interpretable cell type annotation > Results > TOSICA parses tumor infiltrating myeloid cells heterogeneity with high resolution
“Then, 8 evaluation metrics”
§ Transformer for one stop interpretable cell type annotation > Results > TOSICA parses tumor infiltrating myeloid cells heterogeneity with high resolution
“(ASW, graph connectivity and k-nearest-neighbor batch effect test (kBET) for batch effect removal and NMI, Adjusted Rand Index (ARI), ASW and isolated label F1 score for biological variation retention)”
Citations
Cites
Vaswani, A., Shazeer, N., Parmar, N., Uszkoreit, J., Jones, L., Gomez, A. N., Kaiser, L., & Polosukhin, I. (2017) · arXiv · doi:10.48550/arxiv.1706.03762 · Cited by 120,404
An Image is Worth 16x16 Words: Transformers for Image Recognition at Scale
Dosovitskiy, A., Beyer, L., Kolesnikov, A., Weissenborn, D., Zhai, X., Unterthiner, T., Dehghani, M., Minderer, M., Heigold, G., Gelly, S., et al. (2020) · arXiv · doi:10.48550/arxiv.2010.11929 · Cited by 47,472
Comprehensive Integration of Single-Cell Data
Stuart, T., Butler, A., Hoffman, P., Hafemeister, C., Papalexi, E., Mauck, W. M., Hao, Y., Stoeckius, M., Smibert, P., & Satija, R. (2019) · Cell · doi:10.1016/j.cell.2019.05.031 · Cited by 15,453
Integrating single-cell transcriptomic data across different conditions, technologies, and species
Butler, A., Hoffman, P., Smibert, P., Papalexi, E., & Satija, R. (2018) · Nature Biotechnology · doi:10.1038/nbt.4096 · Cited by 13,174
SCANPY: large-scale single-cell gene expression data analysis
Wolf, F. A., Angerer, P., & Theis, F. J. (2018) · Genome Biology · doi:10.1186/s13059-017-1382-0 · Cited by 8,881
Aran, D., Looney, A. P., Liu, L., Wu, E., Fong, V., Hsu, A., Chak, S., Naikawadi, R. P., Wolters, P. J., Abate, A. R., et al. (2019) · Nature Immunology · doi:10.1038/s41590-018-0276-y · Cited by 4,984
Cell types in the mouse cortex and hippocampus revealed by single-cell RNA-seq
Zeisel, A., Muñoz-Manchado, A. B., Codeluppi, S., Lönnerberg, P., La Manno, G., Juréus, A., Marques, S., Munguba, H., He, L., Betsholtz, C., et al. (2015) · Science · doi:10.1126/science.aaa1934 · Cited by 3,124
Single-cell transcriptomics of 20 mouse organs creates a Tabula Muris
The Tabula Muris Consortium, coordination, O., coordination, L., processing, O. C. A., sequencing, L. P. A., analysis, C. D., annotation, C. T., Writing group, Supplemental text writing group, & Principal investigators (2018) · Nature · doi:10.1038/s41586-018-0590-4 · Cited by 2,842
Vision Transformers for Dense Prediction
Ranftl, R., Bochkovskiy, A., & Koltun, V. (2021) · 2021 IEEE/CVF International Conference on Computer Vision (ICCV) · doi:10.1109/iccv48922.2021.01196 · Cited by 2,373
A pan-cancer single-cell transcriptional atlas of tumor infiltrating myeloid cells
Cheng, S., Li, Z., Gao, R., Xing, B., Gao, Y., Yang, Y., Qin, S., Zhang, L., Ouyang, H., Du, P., et al. (2021) · Cell · doi:10.1016/j.cell.2021.01.010 · Cited by 1,601
Cited by
Sorted by citations
scGPT: Towards Building a Foundation Model for Single-Cell Multi-omics Using Generative AI
Cui, H., Wang, C., Maan, H., Pang, K., Luo, F., & Wang, B. (2023) · doi:10.1101/2023.04.30.538439 · Cited by 1,694
“scRNA-seq cell type annotation We benchmarked scGPT against two recent transformer861 based cell type annotation methods, scBert [35] and TOSICA [34] on the Mye.”
MethodInfluentialLarge-scale foundation model on single-cell transcriptomics
Hao, M., Gong, J., Zeng, X., Liu, C., Guo, Y., Cheng, X., Wang, T., Ma, J., Zhang, X., & Song, L. (2024) · Nature Methods · doi:10.1038/s41592-024-02305-7 · Cited by 628
“The embedding module converted continuous gene expression scalars into learnable high-dimensional vectors ensuring full retention of raw expression values, which was a notable improvement over the discretized values used in previous models 13,19 .”
Assessing GPT-4 for cell type annotation in single-cell RNA-seq analysis
Hou, W., & Ji, Z. (2024) · Nature Methods · doi:10.1038/s41592-024-02235-4 · Cited by 277
A Review of Single-Cell RNA-Seq Annotation, Integration, and Cell–Cell Communication
Cheng, C., Chen, W., Jin, H., & Chen, X. '. (2023) · Cells · doi:10.3390/cells12151970 · Cited by 253
Transformers in single-cell omics: a review and new perspectives
Szałata, A., Hrovatin, K., Becker, S., Tejada-Lapuerta, A., Cui, H., Wang, B., & Theis, F. J. (2024) · Nature Methods · doi:10.1038/s41592-024-02353-z · Cited by 189
Metadata
- Authors
- Chen, J., Xu, H., Tao, W., Chen, Z., Zhao, Y., & Han, J.-D. J.
- Affiliations
- Peking University (CN)
- Corresponding author
- Han, Jing-Dong J.
- Venue
- Nature Communications
- Published
- 2023-01-14
- Volume
- 14
- Issue
- 1
- Pages
- 223-223
- ISSN
- 2041-1723 (ISSN-L)
- PMC
- PMC9840170
- OpenAlex
- W4316096017
- Cited by
- 189
- References
- 59
- Citations by year
- 2026: 36 · 2025: 69 · 2024: 70 · 2023: 12
- FWCI
- 16.66
- Type
- journal article
- Language
- en
- Open access
- gold
- doi.org
- Locations
- Nature Communications (publishedVersion, cc-by)
- PubMed Central (publishedVersion, cc-by)
- PubMed (publishedVersion)
- RePEc: Research Papers in Economics (submittedVersion)
- DOAJ (DOAJ: Directory of Open Access Journals) (submittedVersion, cc-by-sa)
- Funders
- National Natural Science Foundation of China (92049302, 32088101)
- Ministry of Science and Technology of the People’s Republic of China (2020YFA0804000)
- Science and Technology Commission of Shanghai Municipality (2017SHZDZX01)
- Topics
- Life Sciences › Biochemistry, Genetics and Molecular Biology › Molecular Biology › Single-cell and spatial transcriptomics
- Life Sciences › Biochemistry, Genetics and Molecular Biology › Molecular Biology › Gene expression and cancer classification
- Life Sciences › Biochemistry, Genetics and Molecular Biology › Molecular Biology › Bioinformatics and Genomic Networks
- Keywords
- cell type annotation, single-cell transcriptomics, transformer models, self-attention, interpretability, annotation transfer, multi-head attention, regulon, tumor-infiltrating immune cells, CD14+ monocytes, COVID-19 pandemic, rare cell types, cellular heterogeneity, disease progression
- MeSH terms
- Exome Sequencing, COVID-19, Humans, Reproducibility of Results, Sequence Analysis, RNA, Disease Progression, Single-Cell Analysis
About these checks
Registry, retraction, Cites and statistics results are computed, not judged, with one exception: a printed reference that no index lists is read once by a model before it counts as a citation error. Claims are extracted by a model and kept only when their quote appears verbatim in the text; each cited source is then checked, with a model’s help, for whether it says what the claim relies on. Those verdicts can be wrong — read the claim’s quote and the cited source before relying on one.
A language model drew the claims from the paper on 2026-10-06, under version 3 of the claim definition (model deepseek-v4.1-flash, prompt extract-v3).
A second model labelled each claim on 2026-10-06 (model jev-1.13-20260917, definition revision gold-guideline-v0.2).
Cited sources are checked with a language model’s help (gpt-6-sol).
Statistics and arithmetic are recomputed, not judged.
Confidence bands are shown only for fields calibrated on our annotated test set. None is calibrated yet, so no band is shown.
What counts as a claim ›How we measure confidence ›How we check this ›
Are you an author, or do you see a problem with this page? Request a review
