Cited by 709Single-cell and spatial transcriptomicsGene expression and cancer classificationCell Image Analysis Techniques

The DOI matches its Crossref record; 57 of the 57 references it cites were found in a registry or an index.

Spatially informed clustering, integration, and deconvolution of spatial transcriptomics with GraphST

Open access

Published version of a preprint

Abstract

Spatial transcriptomics technologies generate gene expression profiles with spatial context, requiring spatially informed analysis tools for three key tasks, spatial clustering, multisample integration, and cell-type deconvolution. We present GraphST, a graph self-supervised contrastive learning method that fully exploits spatial transcriptomics data to outperform existing methods. It combines graph neural networks with self-supervised contrastive learning to learn informative and discriminative spot representations by minimizing the embedding distance between spatially adjacent spots and vice versa. We demonstrated GraphST on multiple tissue types and technology platforms. GraphST achieved 10% higher clustering accuracy and better delineated fine-grained tissue structures in brain and embryo tissues. GraphST is also the only method that can jointly analyze multiple tissue slices in vertical or horizontal integration while correcting batch effects. Lastly, GraphST demonstrated superior cell-type deconvolution to capture spatial niches like lymph node germinal centers and exhausted tumor infiltrating T cells in breast tumor tissue.

Overview

The claims and statistics of this paper haven’t been checked yet.

Run the check — free, no account needed. It reads the open-access text and checks the sources it cites.

A few free checks a day · papers already verified open instantly · results are public

Integrity signals

Registry

Crossref · 10.1038/s41467-023-36796-3

Cites

57 of 57 references verified0 citation errors · 0 not checkable

Statistics

Figures

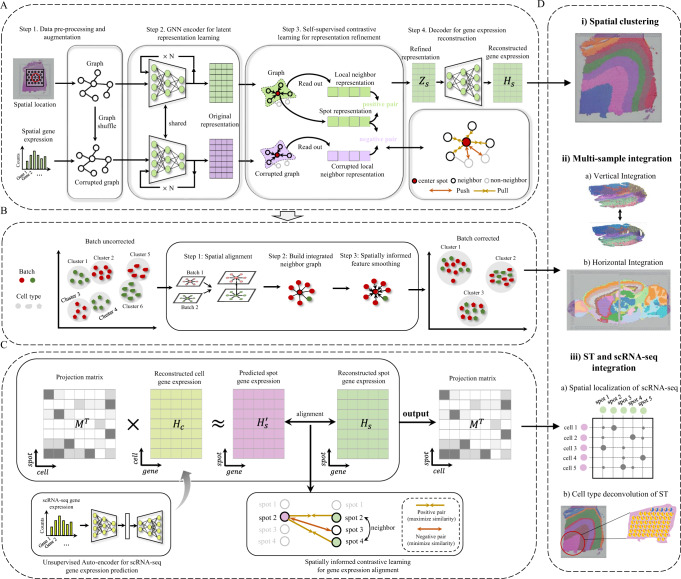
Fig. 1 Overview of GraphST. A GraphST takes as inputs the preprocessed spatial gene expressions and neighborhood graph constructed using spot coordinates (x,y). Latent representation Zs is first learned using our graph self-supervised contrastive learning to preserve the informative features from the gene expression profiles, spatial location information, and local context information. This is then reversed back into the original feature space to reconstruct the gene expression matrix Hs. B The analysis workflow for spatial batch effect correction by GraphST. The first step is to align the H&E images of two or more samples, followed by shared neighborhood graph construction, where both intra- and inter-sample neighbors are considered. This provides the possibility for feature smoothing. Finally, sample batch effects are implicitly corrected by smoothing features across samples with GraphST. C With the reconstructed spatial gene expression Hs and the refined scRNA-seq feature matrix Hc derived from an unsupervised auto-encoder, a cell-to-spot mapping matrix M is trained via a spatially informed contrastive learning mechanism where the similarities of positive pairs (i.e., spatially adjacent spot pairs) are maximized, and those of negative pairs (i.e., spatially nonadjacent spot pairs) are minimized. D The outputs Hs and M of GraphST can be utilized for spatial clustering, multiple ST data integration, and ST and scRNA-seq data integration.
Fig. 1 Overview of GraphST. A GraphST takes as inputs the preprocessed spatial gene expressions and neighborhood graph constructed using spot coordinates (x,y). Latent representation Zs is first learned using our graph self-supervised contrastive learning to preserve the informative features from the gene expression profiles, spatial location information, and local context information. This is then reversed back into the original feature space to reconstruct the gene expression matrix Hs. B The analysis workflow for spatial batch effect correction by GraphST. The first step is to align the H&E images of two or more samples, followed by shared neighborhood graph construction, where both intra- and inter-sample neighbors are considered. This provides the possibility for feature smoothing. Finally, sample batch effects are implicitly corrected by smoothing features across samples with GraphST. C With the reconstructed spatial gene expression Hs and the refined scRNA-seq feature matrix Hc derived from an unsupervised auto-encoder, a cell-to-spot mapping matrix M is trained via a spatially informed contrastive learning mechanism where the similarities of positive pairs (i.e., spatially adjacent spot pairs) are maximized, and those of negative pairs (i.e., spatially nonadjacent spot pairs) are minimized. D The outputs Hs and M of GraphST can be utilized for spatial clustering, multiple ST data integration, and ST and scRNA-seq data integration.CC BY · PubMed Central
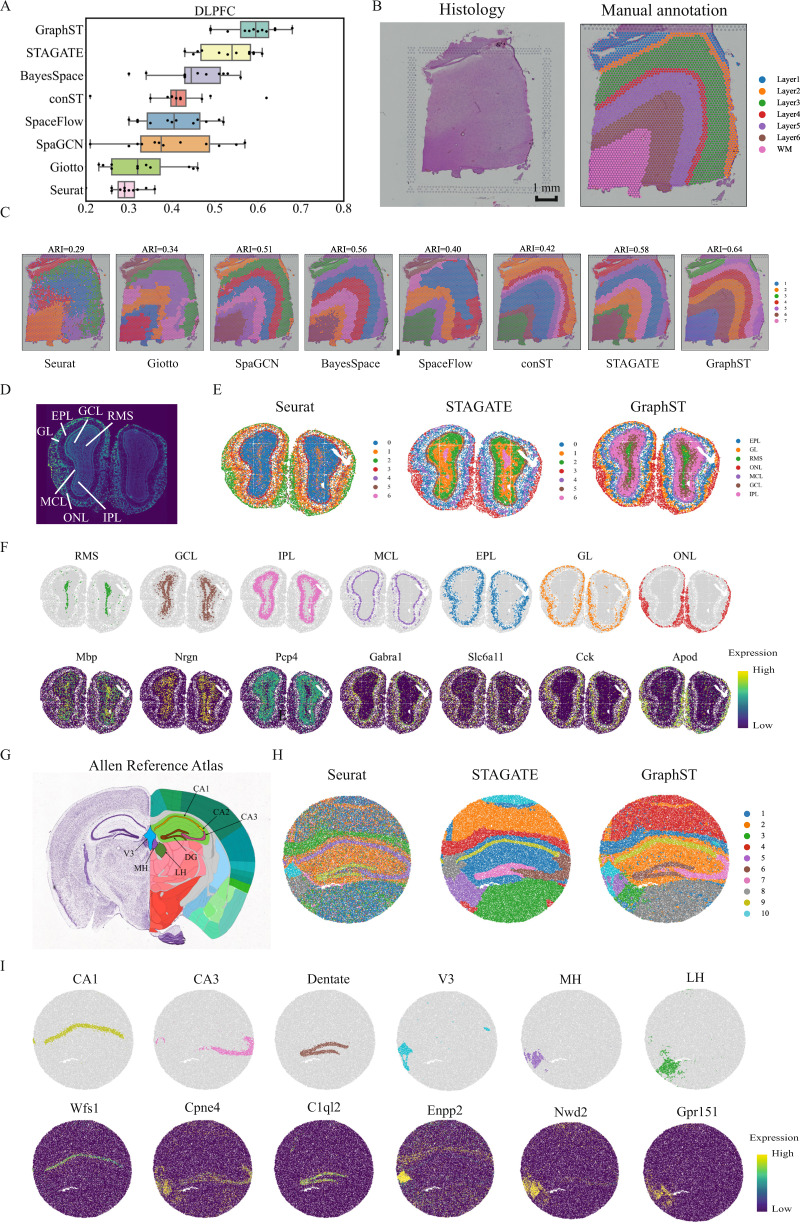
Fig. 2 GraphST clustering improves the identification of tissue structures in the human dorsolateral prefrontal cortex (DLPFC), mouse olfactory bulb, and mouse hippocampus tissue. A Boxplots of adjusted rand index (ARI) scores of the eight methods applied to the 12 DLPFC slices. In the boxplot, the center line denotes the median, box limits denote the upper and lower quartiles, and whiskers denote the 1.5× interquartile range. B H&E image and manual annotation from the original study. C Clustering results by nonspatial and spatial methods, Seurat, Giotto, SpaGCN, BayesSpace, SpaceFlow, conST, STAGATE, and GraphST on slice 151673 of the DLPFC dataset. Manual annotations and clustering results of the other DLPFC slices are shown in Supplementary Fig. S1. D Laminar organization of the mouse olfactory bulb annotated using the DAPI-stained image. E Spatial domains identified by Seurat, STAGATE, and GraphST in the mouse olfactory bulb Stereo-seq data. F Visualization of the spatial domains identified by GraphST and the corresponding marker gene expressions. The identified domains are aligned with the annotated laminar organization of the mouse olfactory bulb. G Allen Mouse Brain Atlas with the hippocampus region annotated. H Spatial domains identified by Seurat, STAGATE, and GraphST in mouse hippocampus tissue acquired with Slide-seqV2. I Visualization of the spatial domains identified by GraphST and the corresponding marker gene expressions. The identified domains are aligned with the annotated hippocampus region of the Allen Mouse Brain Atlas.
Fig. 2 GraphST clustering improves the identification of tissue structures in the human dorsolateral prefrontal cortex (DLPFC), mouse olfactory bulb, and mouse hippocampus tissue. A Boxplots of adjusted rand index (ARI) scores of the eight methods applied to the 12 DLPFC slices. In the boxplot, the center line denotes the median, box limits denote the upper and lower quartiles, and whiskers denote the 1.5× interquartile range. B H&E image and manual annotation from the original study. C Clustering results by nonspatial and spatial methods, Seurat, Giotto, SpaGCN, BayesSpace, SpaceFlow, conST, STAGATE, and GraphST on slice 151673 of the DLPFC dataset. Manual annotations and clustering results of the other DLPFC slices are shown in Supplementary Fig. S1. D Laminar organization of the mouse olfactory bulb annotated using the DAPI-stained image. E Spatial domains identified by Seurat, STAGATE, and GraphST in the mouse olfactory bulb Stereo-seq data. F Visualization of the spatial domains identified by GraphST and the corresponding marker gene expressions. The identified domains are aligned with the annotated laminar organization of the mouse olfactory bulb. G Allen Mouse Brain Atlas with the hippocampus region annotated. H Spatial domains identified by Seurat, STAGATE, and GraphST in mouse hippocampus tissue acquired with Slide-seqV2. I Visualization of the spatial domains identified by GraphST and the corresponding marker gene expressions. The identified domains are aligned with the annotated hippocampus region of the Allen Mouse Brain Atlas.CC BY · PubMed Central
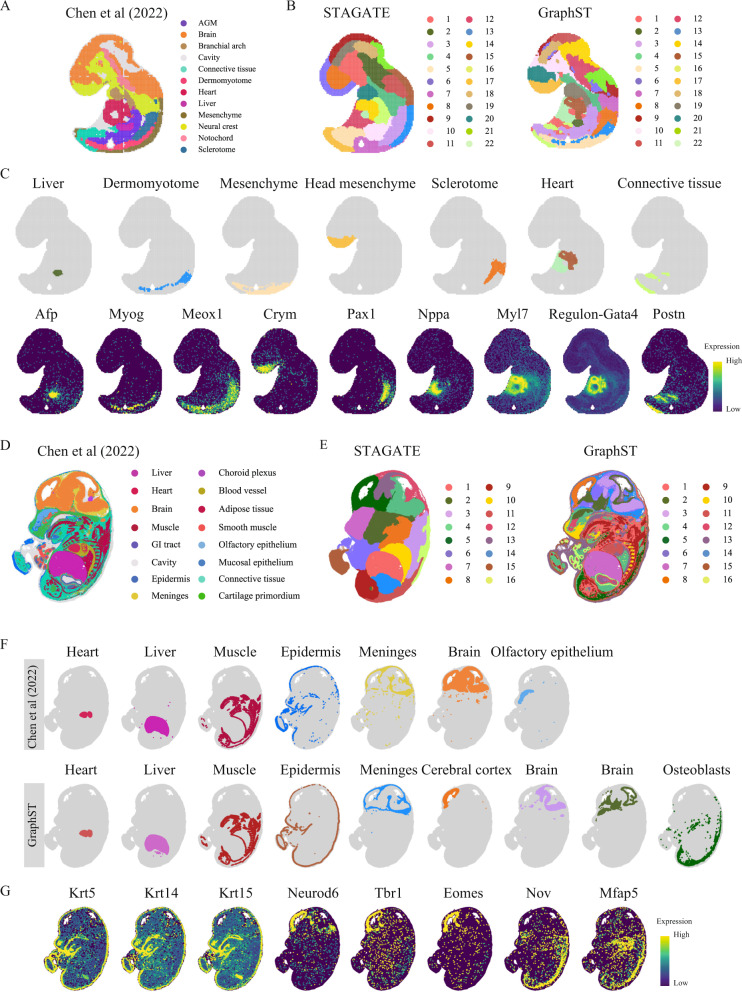
Fig. 3 GraphST enables accurate identification of different organs in the Stereo-seq mouse embryo. A Tissue domain annotations of the E9.5 mouse embryo data taken from the original Stereo-seq study wherein the clusters were first identified using Leiden clustering from SCANPY and then annotated using differentially expressed genes. B Clustering results of STAGATE and GraphST on the E9.5 mouse embryo data. C Visualization of selected spatial domains identified by GraphST and the corresponding marker gene expressions. D Tissue domain annotations of the E14.5 mouse embryo data obtained from the original Stereo-seq study. E Clustering results by STAGATE and GraphST on the E14.5 mouse embryo. F Visualization of selected spatial domains identified by the original Stereo-seq study and GraphST, respectively. G Visualization of marker gene expressions supporting the identified domains.
Fig. 3 GraphST enables accurate identification of different organs in the Stereo-seq mouse embryo. A Tissue domain annotations of the E9.5 mouse embryo data taken from the original Stereo-seq study wherein the clusters were first identified using Leiden clustering from SCANPY and then annotated using differentially expressed genes. B Clustering results of STAGATE and GraphST on the E9.5 mouse embryo data. C Visualization of selected spatial domains identified by GraphST and the corresponding marker gene expressions. D Tissue domain annotations of the E14.5 mouse embryo data obtained from the original Stereo-seq study. E Clustering results by STAGATE and GraphST on the E14.5 mouse embryo. F Visualization of selected spatial domains identified by the original Stereo-seq study and GraphST, respectively. G Visualization of marker gene expressions supporting the identified domains.CC BY · PubMed Central
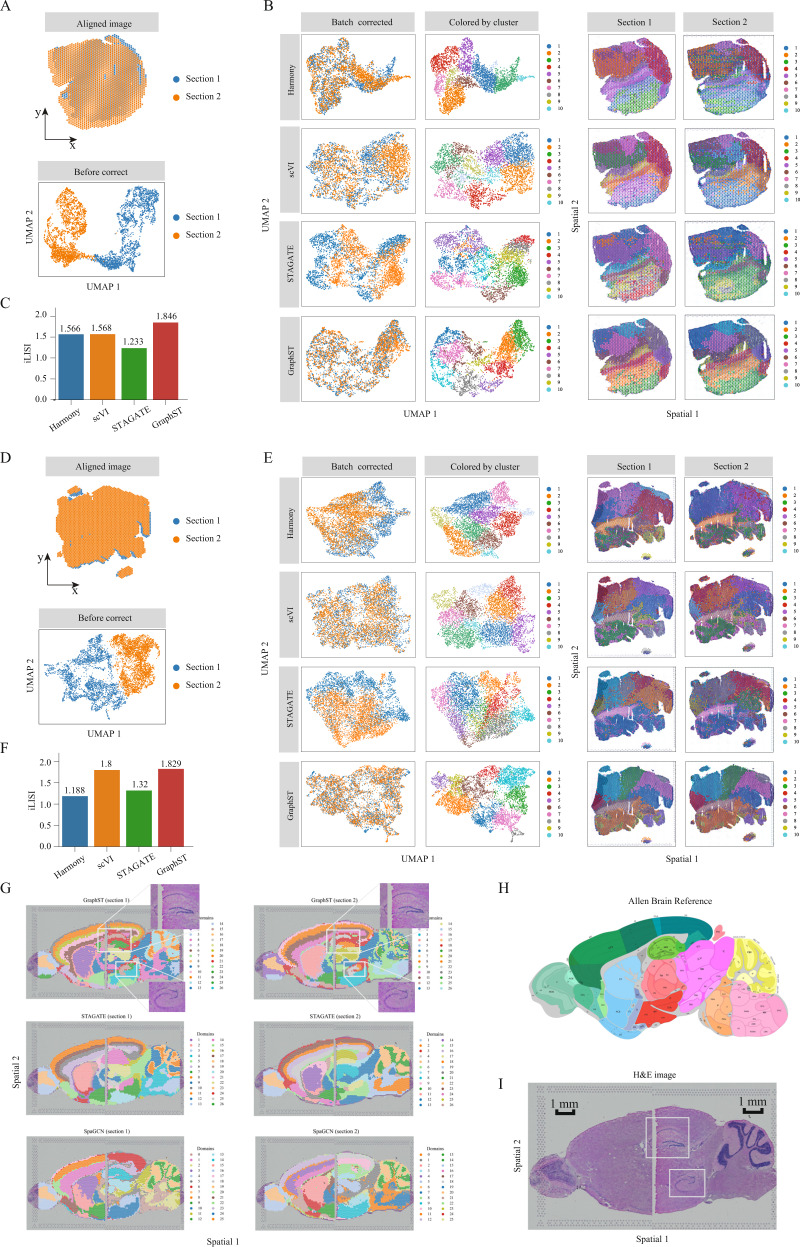
Fig. 4 GraphST enables accurate vertical and horizontal integrations of ST data on mouse breast cancer and mouse brain anterior and posterior data, respectively. A First set of mouse breast cancer sample images aligned with the PASTE algorithm and plotted before batch effect correction. B UMAP plots after batch effect correction and spatial clustering results from Harmony, scVI, STAGATE, and GraphST. Spots in the second column are colored according to the spatial domains identified by the respective clustering methods. C Barplots of iLISI metric for batch correction results from different methods on the first set of samples. D Second set of mouse breast cancer sample images aligned and UMAP plot before batch effect correction. E UMAP plots after batch effect correction and the spatial clusters detected by Harmony, scVI, STAGATE, and GraphST on sections 1 and 2, respectively. Similarly, spots in the second column are colored according to the spatial domains identified by the respective methods. F Barplots of iLISI metric for batch correction results from different methods on the second set of samples. G Horizontal integration results with two mouse brain samples, of which each consists of anterior and posterior brain sections. Top: spatial joint domains identified by GraphST on sections 1 and 2. Middle: spatial joint domains identified by STAGATE. Bottom: spatial joint domains identified by SpaGCN. H Annotated brain section image from Allen Mouse Brain Atlas for reference. I H&E image of mouse brain anterior and posterior.
Fig. 4 GraphST enables accurate vertical and horizontal integrations of ST data on mouse breast cancer and mouse brain anterior and posterior data, respectively. A First set of mouse breast cancer sample images aligned with the PASTE algorithm and plotted before batch effect correction. B UMAP plots after batch effect correction and spatial clustering results from Harmony, scVI, STAGATE, and GraphST. Spots in the second column are colored according to the spatial domains identified by the respective clustering methods. C Barplots of iLISI metric for batch correction results from different methods on the first set of samples. D Second set of mouse breast cancer sample images aligned and UMAP plot before batch effect correction. E UMAP plots after batch effect correction and the spatial clusters detected by Harmony, scVI, STAGATE, and GraphST on sections 1 and 2, respectively. Similarly, spots in the second column are colored according to the spatial domains identified by the respective methods. F Barplots of iLISI metric for batch correction results from different methods on the second set of samples. G Horizontal integration results with two mouse brain samples, of which each consists of anterior and posterior brain sections. Top: spatial joint domains identified by GraphST on sections 1 and 2. Middle: spatial joint domains identified by STAGATE. Bottom: spatial joint domains identified by SpaGCN. H Annotated brain section image from Allen Mouse Brain Atlas for reference. I H&E image of mouse brain anterior and posterior.CC BY · PubMed Central
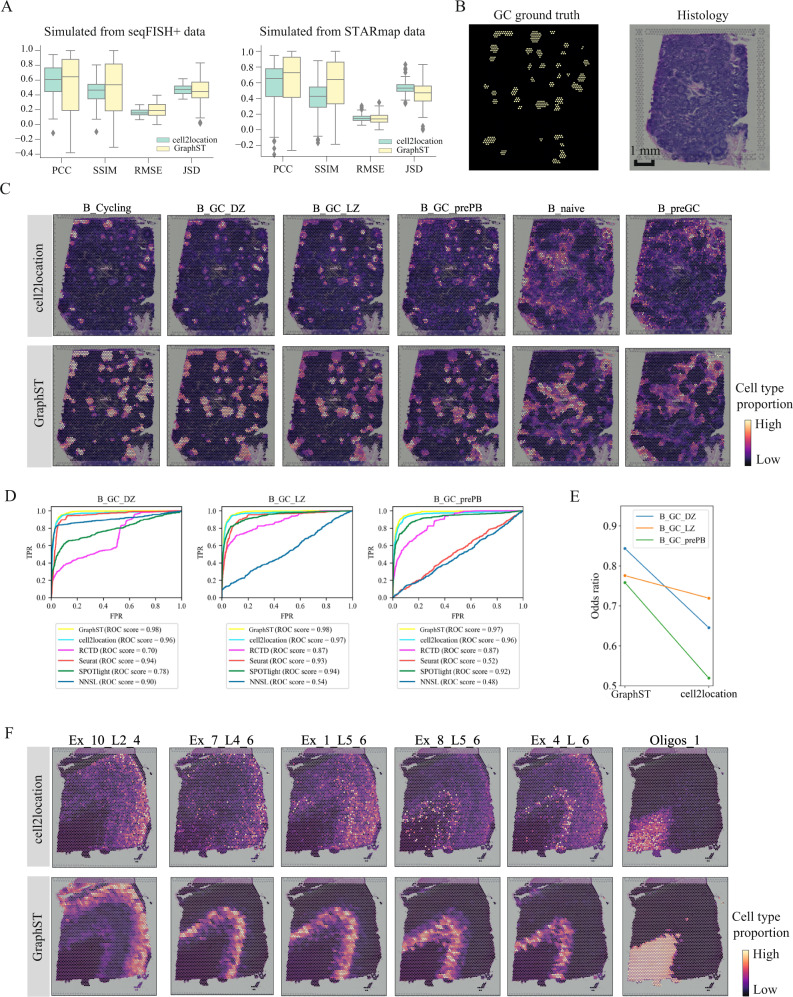
Fig. 5 Comparing the accuracy of GraphST with top deconvolution method cell2location in predicting spatial distributions of scRNA-seq data with simulated data, human lymph node, and the slice 151673 of DLPFC. A Boxplots of PCC, SSIM, RMSE, and JSD metrics for cell2location and GraphST results on simulated data created from seqFISH+ and STARmap experimental data. In the boxplot, the center line denotes the median, box limits denote the upper and lower quartiles, and whiskers denote the 1.5× interquartile range. n = 8 (12) different predicted cell types for simulated data created from seqFISH+ (STARmap) experimental data. B Left, annotations of germinal center (GC) locations from cell2location’s study (GC locations annotated with yellow). Right, H&E image of human lymph node data. C Comparison between cell2location and GraphST on the spatial distributions of selected cell types, namely B_Cycling, B_GC_DZ, B_GC_LZ, B_GC_prePB, B_naive, and B_preGC. D Quantitative evaluation via AUC of three cell types (B_GC_DZ, B_GC_LZ, and B_GC_prePB) localized in the GCs using the annotated locations shown in (B). E Quantitative evaluation of GC cell type mapping of three cell types (B_GC_DZ, B_GC_LZ, and B_GC_prePB) between cell2location and GraphST using the odds ratio metric. F Comparison between cell2location and GraphST on the spatial distribution of cell types Ex_10_L2_4, Ex_7_L4_6, Ex_1_L5_6, Ex_8_L5_6, Ex_4_L_6, and Oligos_1 with slice 151673 of the DLPFC dataset.
Fig. 5 Comparing the accuracy of GraphST with top deconvolution method cell2location in predicting spatial distributions of scRNA-seq data with simulated data, human lymph node, and the slice 151673 of DLPFC. A Boxplots of PCC, SSIM, RMSE, and JSD metrics for cell2location and GraphST results on simulated data created from seqFISH+ and STARmap experimental data. In the boxplot, the center line denotes the median, box limits denote the upper and lower quartiles, and whiskers denote the 1.5× interquartile range. n = 8 (12) different predicted cell types for simulated data created from seqFISH+ (STARmap) experimental data. B Left, annotations of germinal center (GC) locations from cell2location’s study (GC locations annotated with yellow). Right, H&E image of human lymph node data. C Comparison between cell2location and GraphST on the spatial distributions of selected cell types, namely B_Cycling, B_GC_DZ, B_GC_LZ, B_GC_prePB, B_naive, and B_preGC. D Quantitative evaluation via AUC of three cell types (B_GC_DZ, B_GC_LZ, and B_GC_prePB) localized in the GCs using the annotated locations shown in (B). E Quantitative evaluation of GC cell type mapping of three cell types (B_GC_DZ, B_GC_LZ, and B_GC_prePB) between cell2location and GraphST using the odds ratio metric. F Comparison between cell2location and GraphST on the spatial distribution of cell types Ex_10_L2_4, Ex_7_L4_6, Ex_1_L5_6, Ex_8_L5_6, Ex_4_L_6, and Oligos_1 with slice 151673 of the DLPFC dataset.CC BY · PubMed Central
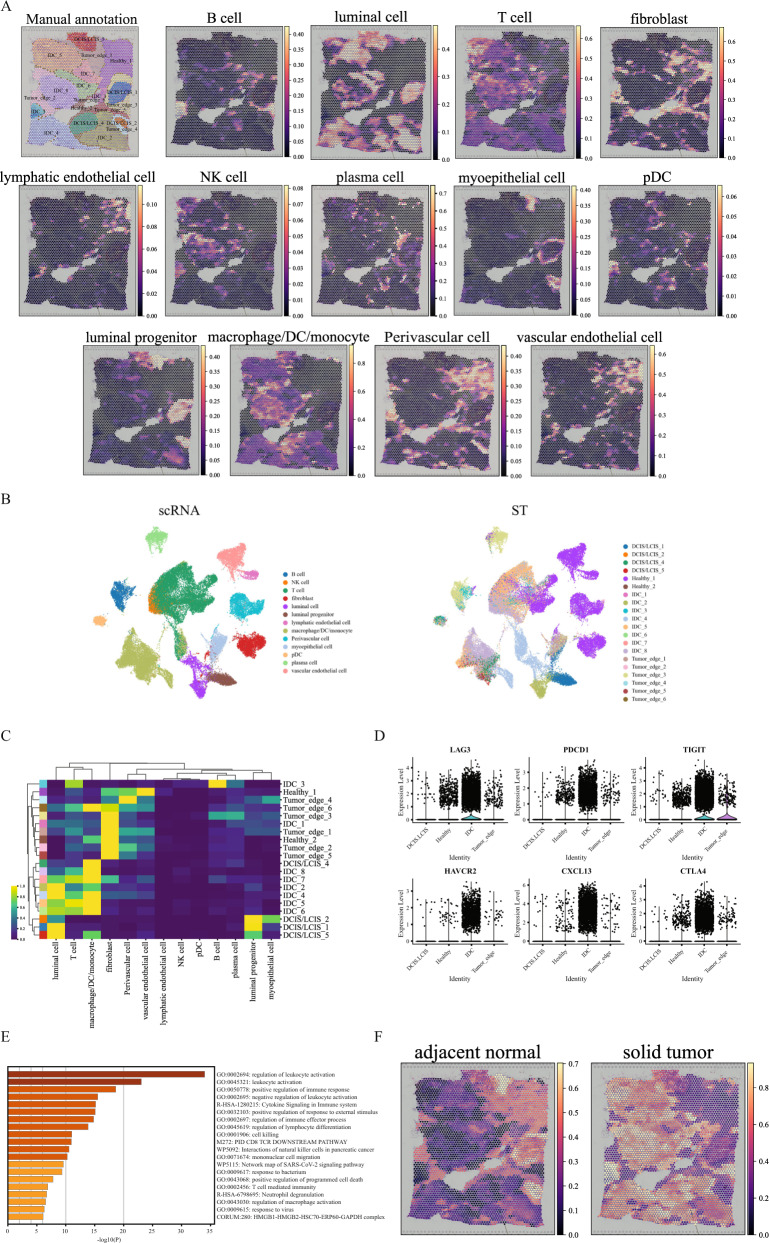
Fig. 6 GraphST enables comprehensive and accurate spatial mapping of scRNA-seq data in human breast cancer data. A Manual annotation and spatial distribution of major cell types mapped by GraphST, namely B cell, luminal cell, T cell, fibroblast, lymphatic endothelial cell, NK cell, plasma cell, myoepithelial cell, pDC, luminal progenitor, macrophage/DC/monocyte, Perivascular cell, and vascular endothelial cell. B Visualization of scRNA-seq data and spatial localization of cell types with UMAP generated from the output cell representations of GraphST. C Heatmap of the spatial distribution of cell types. D The gene expression of six T-cell exhaustion-related markers in different annotated domains. E Functional enrichment results of the IDC domain specific differentially expressed genes. Statistical significance was assessed by the hypergeometric test, and p-values were adjusted by the Benjamini–Hochberg p-value correction algorithm. The statistical test was one-sided. F Predicted spatial distribution of cells from two sample types, adjacent normal and solid tumor.
Fig. 6 GraphST enables comprehensive and accurate spatial mapping of scRNA-seq data in human breast cancer data. A Manual annotation and spatial distribution of major cell types mapped by GraphST, namely B cell, luminal cell, T cell, fibroblast, lymphatic endothelial cell, NK cell, plasma cell, myoepithelial cell, pDC, luminal progenitor, macrophage/DC/monocyte, Perivascular cell, and vascular endothelial cell. B Visualization of scRNA-seq data and spatial localization of cell types with UMAP generated from the output cell representations of GraphST. C Heatmap of the spatial distribution of cell types. D The gene expression of six T-cell exhaustion-related markers in different annotated domains. E Functional enrichment results of the IDC domain specific differentially expressed genes. Statistical significance was assessed by the hypergeometric test, and p-values were adjusted by the Benjamini–Hochberg p-value correction algorithm. The statistical test was one-sided. F Predicted spatial distribution of cells from two sample types, adjacent normal and solid tumor.CC BY · PubMed Central

Verification

Claims the paper makes

The claims and statistics of this paper haven’t been checked yet.

Run the check — free, no account needed. It reads the open-access text and checks the sources it cites.

A few free checks a day · papers already verified open instantly · results are public

Claims other papers make about this one

Each is checked against this paper’s own text: does it say what the citing paper says it does?

Self-check

Percentages, sums and reported differences re-computed from the paper’s own numbers.

The self-check needs the paper’s full text.

Citations

Cites

Show all 55 references

Cited by

Sorted by citations

Items 701–709 of 709

Metadata

Authors
Long, Y., Ang, K. S., Li, M., Chong, K. L. K., Sethi, R., Zhong, C., Xu, H., Ong, Z., Sachaphibulkij, K., Chen, A., Zeng, L., Fu, H., Wu, M., Lim, L. H. K., Liu, L., & Chen, J.
Affiliations
  • Agency for Science, Technology and Research (SG)
  • National Neuroscience Institute (SG)
  • National University of Singapore (SG)
  • BGI Group (China) (CN)
  • Duke-NUS Medical School (SG)
Corresponding author
  • Chen, Ao
  • Chen, Jinmiao
Venue
Nature Communications
Published
2023-03-01
Volume
14
Issue
1
Pages
1155-1155
ISSN
2041-1723 (ISSN-L)
OpenAlex
W4322738920
Cited by
700
References
55
Citations by year
2026: 284 · 2025: 233 · 2024: 156 · 2023: 27
FWCI
62.55
Type
journal article
Language
en
Open access
Locations
  • Nature Communications (publishedVersion, cc-by)
  • bioRxiv (Cold Spring Harbor Laboratory) (acceptedVersion, cc-by-nc-nd)
  • Research Square (acceptedVersion, cc-by)
  • PubMed Central (publishedVersion, cc-by)
  • PubMed (publishedVersion)
  • RePEc: Research Papers in Economics (submittedVersion)
  • DOAJ (DOAJ: Directory of Open Access Journals) (submittedVersion, cc-by-sa)
Funders
  • National Research Foundation
  • National Research Foundation Singapore (2017-04, NRF-CRP19-2017-04, MOH-OFLCG18May-0003)
  • Medical Research Council
  • National Medical Research Council (MOH-OFLCG18May-0003, NMRC /OFLCG/003/2018, NMRC-OFIRG18nov-2013)
Topics
  • Life Sciences › Biochemistry, Genetics and Molecular Biology › Molecular Biology › Single-cell and spatial transcriptomics
  • Life Sciences › Biochemistry, Genetics and Molecular Biology › Molecular Biology › Gene expression and cancer classification
  • Life Sciences › Biochemistry, Genetics and Molecular Biology › Biophysics › Cell Image Analysis Techniques
Keywords
spatial transcriptomics, graph neural networks, self-supervised contrastive learning, spatial clustering, cell type deconvolution, batch effect correction, tumor-infiltrating T cells, breast tumors, brain tissue
MeSH terms
Brain, Cluster Analysis, Germinal Center, Gene Expression Profiling, Transcriptome

About these checks

Registry, retraction, Cites and statistics results are computed, not judged, with one exception: a printed reference that no index lists is read once by a model before it counts as a citation error. Claims are extracted by a model and kept only when their quote appears verbatim in the text; each cited source is then checked, with a model’s help, for whether it says what the claim relies on. Those verdicts can be wrong — read the claim’s quote and the cited source before relying on one.

Statistics and arithmetic are recomputed, not judged.

Confidence bands are shown only for fields calibrated on our annotated test set. None is calibrated yet, so no band is shown.

What counts as a claim ›How we measure confidence ›How we check this ›

Are you an author, or do you see a problem with this page? Request a review