

The DOI matches its Crossref record; 57 of the 57 references it cites were found in a registry or an index.
Spatially informed clustering, integration, and deconvolution of spatial transcriptomics with GraphST
Open accessPublished version of a preprint
Abstract
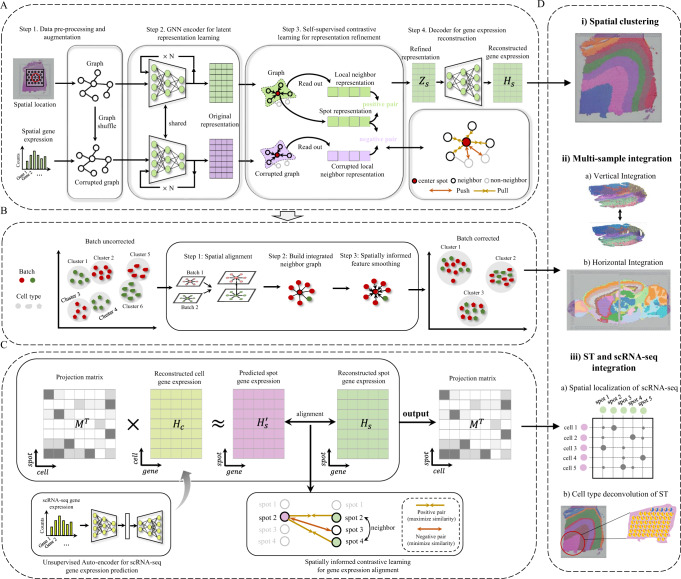
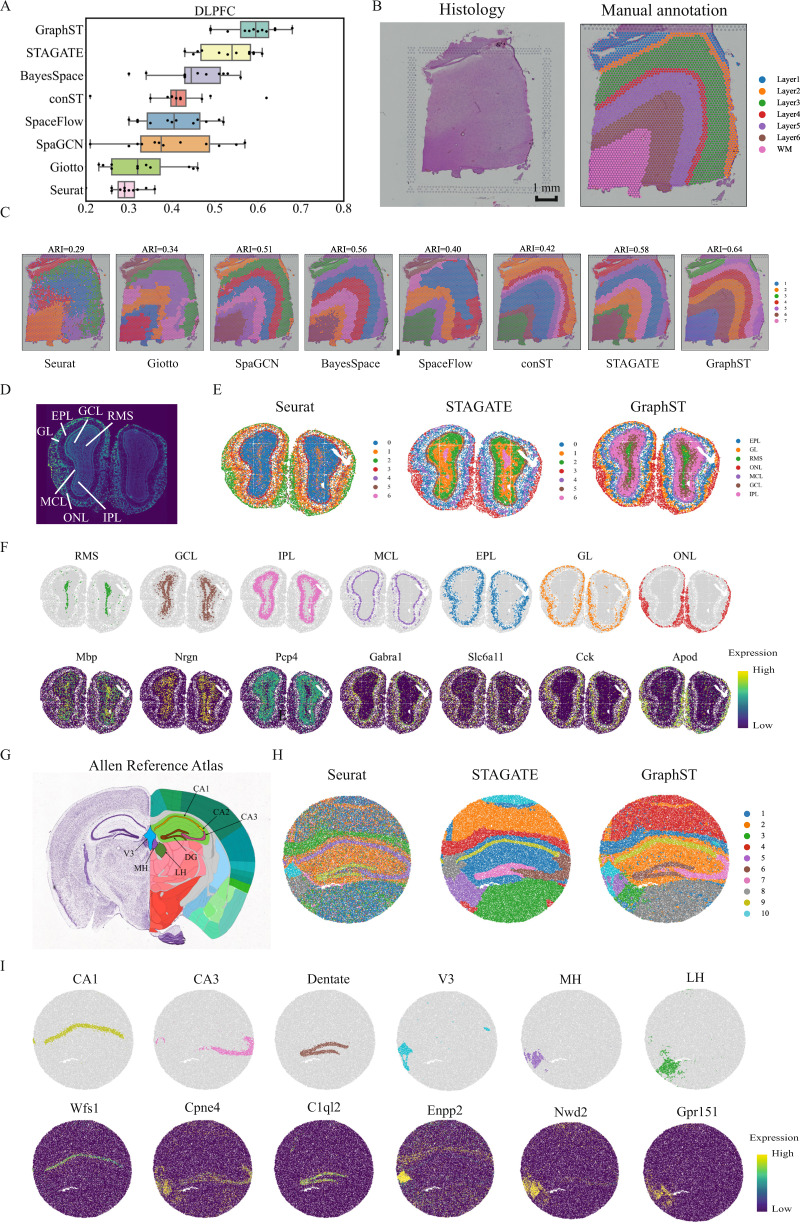
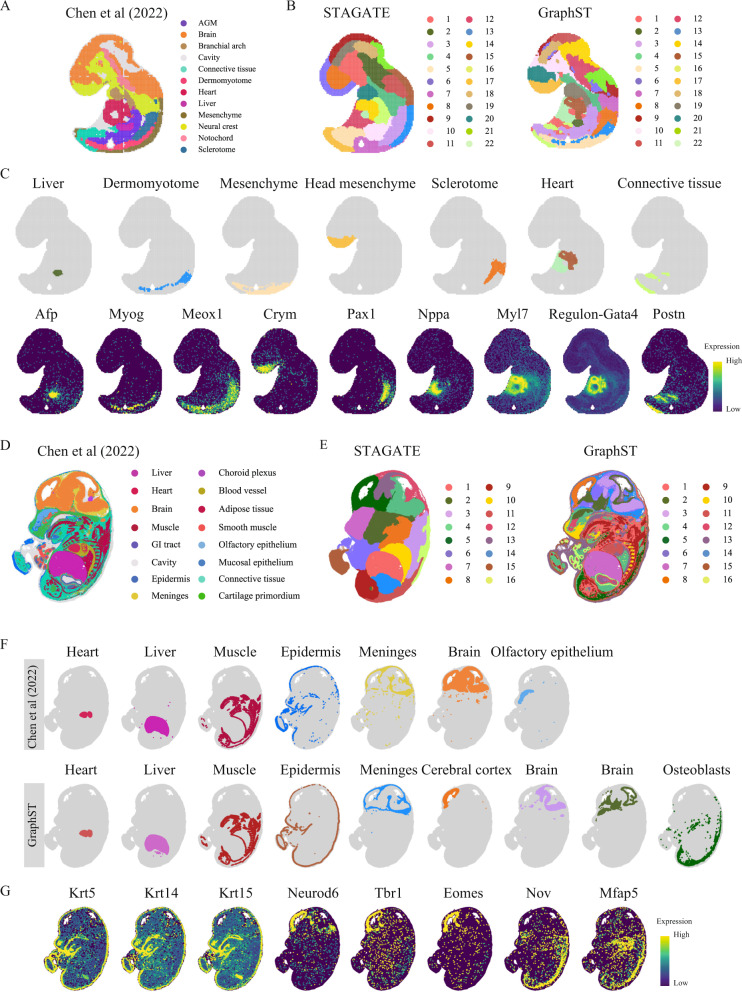
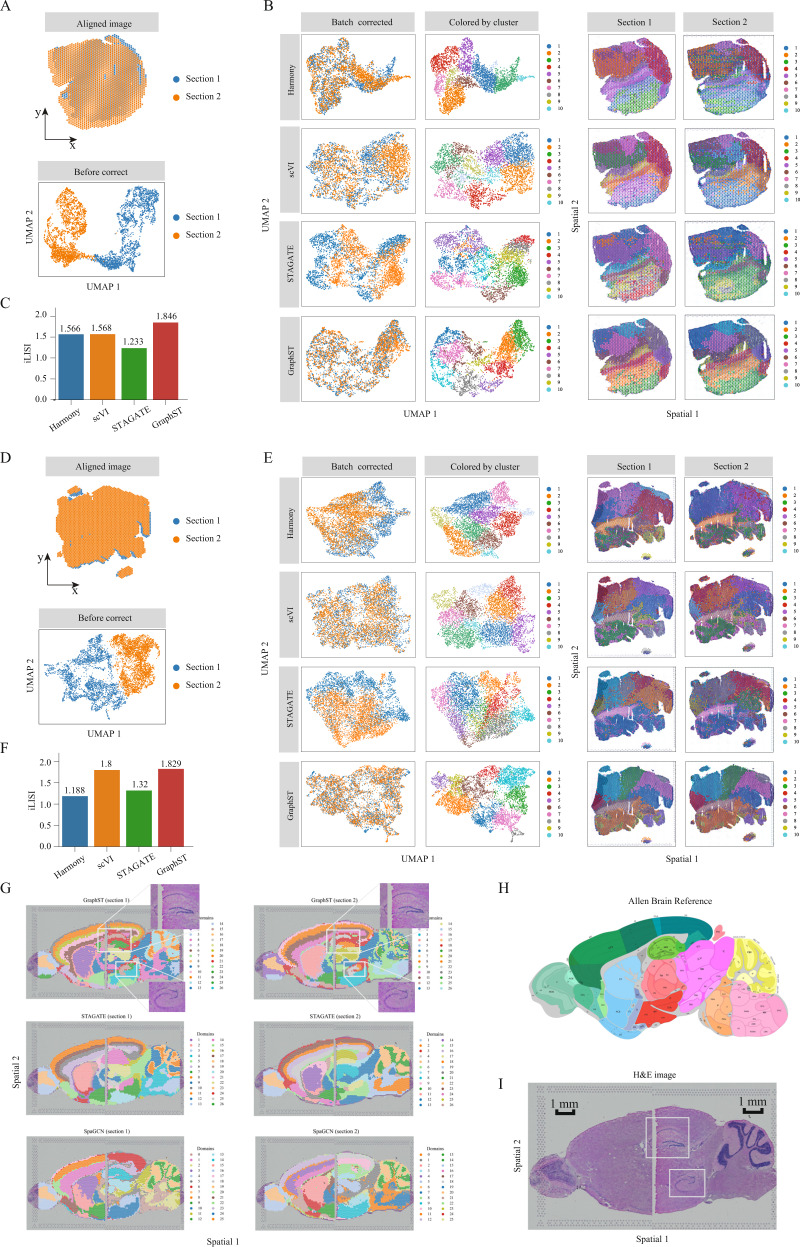
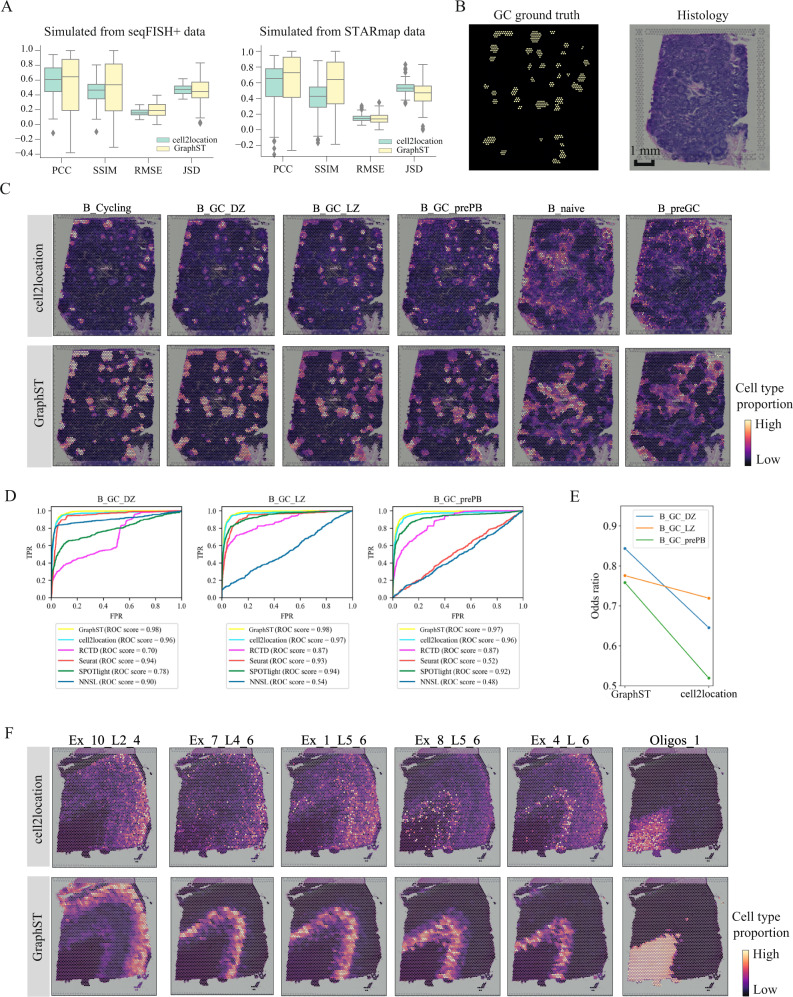
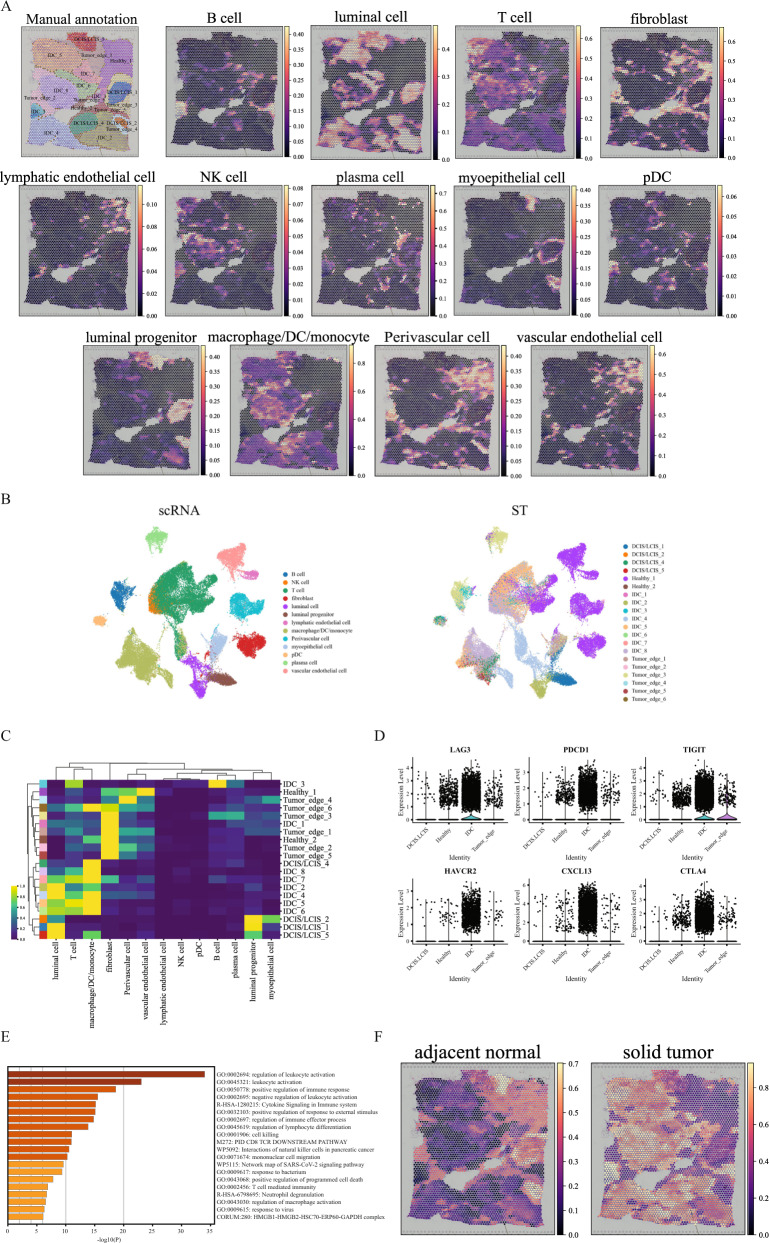
Spatial transcriptomics technologies generate gene expression profiles with spatial context, requiring spatially informed analysis tools for three key tasks, spatial clustering, multisample integration, and cell-type deconvolution. We present GraphST, a graph self-supervised contrastive learning method that fully exploits spatial transcriptomics data to outperform existing methods. It combines graph neural networks with self-supervised contrastive learning to learn informative and discriminative spot representations by minimizing the embedding distance between spatially adjacent spots and vice versa. We demonstrated GraphST on multiple tissue types and technology platforms. GraphST achieved 10% higher clustering accuracy and better delineated fine-grained tissue structures in brain and embryo tissues. GraphST is also the only method that can jointly analyze multiple tissue slices in vertical or horizontal integration while correcting batch effects. Lastly, GraphST demonstrated superior cell-type deconvolution to capture spatial niches like lymph node germinal centers and exhausted tumor infiltrating T cells in breast tumor tissue.
Overview
The claims and statistics of this paper haven’t been checked yet.
Run the check — free, no account needed. It reads the open-access text and checks the sources it cites.
Integrity signals
Registry
Cites
Statistics
Figures
Verification
Claims the paper makes
The claims and statistics of this paper haven’t been checked yet.
Run the check — free, no account needed. It reads the open-access text and checks the sources it cites.
Claims other papers make about this one
Each is checked against this paper’s own text: does it say what the citing paper says it does?
The cited source says what the claim attributes to it.
In the citing paper
“Long et al. introduced the GraphST framework, which combined GNN and contrastive learning to integrate information within spatial transcriptomic datasets, across tissue sections and scRNA-seq datasets [127].”
From Challenges in AI-driven Biomedical Multimodal Data Fusion and Analysis (2025) · cites this paper as [127]
Self-check
Percentages, sums and reported differences re-computed from the paper’s own numbers.
The self-check needs the paper’s full text.
Citations
Cites
Adam: A Method for Stochastic Optimization
Kingma, D. P., & Ba, J. (2014) · arXiv · doi:10.48550/arxiv.1412.6980 · Cited by 98,946
Semi-supervised classification with graph convolutional networks
Kipf, T. N., & Welling, M. (2016) · arXiv · doi:10.48550/arxiv.1609.02907 · Cited by 24,853
Fast unfolding of communities in large networks
Blondel, V. D., Guillaume, J.-L., Lambiotte, R., & Lefebvre, E. (2008) · Journal of Statistical Mechanics: Theory and Experiment · doi:10.1088/1742-5468/2008/10/p10008 · Cited by 21,424
Silhouettes: A graphical aid to the interpretation and validation of cluster analysis
Rousseeuw, P. J. (1987) · Journal of Computational and Applied Mathematics · doi:10.1016/0377-0427(87)90125-7 · Cited by 21,392
Enrichr: a comprehensive gene set enrichment analysis web server 2016 update
Kuleshov, M. V., Jones, M. R., Rouillard, A. D., Fernandez, N. F., Duan, Q., Wang, Z., Koplev, S., Jenkins, S. L., Jagodnik, K. M., Lachmann, A., et al. (2016) · Nucleic Acids Research · doi:10.1093/nar/gkw377 · Cited by 10,799
Fast, sensitive and accurate integration of single-cell data with Harmony
Korsunsky, I., Millard, N., Fan, J., Slowikowski, K., Zhang, F., Wei, K., Baglaenko, Y., Brenner, M., Loh, P.-R., & Raychaudhuri, S. (2019) · Nature Methods · doi:10.1038/s41592-019-0619-0 · Cited by 10,488
SCANPY: large-scale single-cell gene expression data analysis
Wolf, F. A., Angerer, P., & Theis, F. J. (2018) · Genome Biology · doi:10.1186/s13059-017-1382-0 · Cited by 8,881
Solving Least Squares Problems
Lawson, C. L., & Hanson, R. J. (1995) · doi:10.1137/1.9781611971217 · Cited by 7,103
Spatial reconstruction of single-cell gene expression data
Satija, R., Farrell, J. A., Gennert, D., Schier, A. F., & Regev, A. (2015) · Nature Biotechnology · doi:10.1038/nbt.3192 · Cited by 7,055
Deep generative modeling for single-cell transcriptomics
Lopez, R., Regier, J., Cole, M. B., Jordan, M. I., & Yosef, N. (2018) · Nature Methods · doi:10.1038/s41592-018-0229-2 · Cited by 2,530
Cited by
Sorted by citations
Pham, D., Tan, X., Balderson, B., Xu, J., Grice, L. F., Yoon, S., Willis, E. F., Tran, M., Lam, P. Y., Raghubar, A. M., et al. (2023) · Nature Communications · doi:10.1038/s41467-023-43120-6 · Cited by 757
Profiling cell identity and tissue architecture with single-cell and spatial transcriptomics
Gulati, G. S., D'Silva, J. P., Liu, Y., Wang, L., & Newman, A. M. (2024) · Nature Reviews Molecular Cell Biology · doi:10.1038/s41580-024-00768-2 · Cited by 347
BANKSY unifies cell typing and tissue domain segmentation for scalable spatial omics data analysis
Singhal, V., Chou, N., Lee, J., Yue, Y., Liu, J., Chock, W. K., Lin, L., Chang, Y.-C., Teo, E. M. L., Aow, J., et al. (2024) · Nature Genetics · doi:10.1038/s41588-024-01664-3 · Cited by 282
Spatiotemporal omics for biology and medicine
Liu, L., Chen, A., Li, Y., Mulder, J., Heyn, H., & Xu, X. (2024) · Cell · doi:10.1016/j.cell.2024.07.040 · Cited by 252
Self-citationDeciphering spatial domains from spatial multi-omics with SpatialGlue
Long, Y., Ang, K. S., Sethi, R., Liao, S., Heng, Y., van Olst, L., Ye, S., Zhong, C., Xu, H., Zhang, D., et al. (2024) · Nature Methods · doi:10.1038/s41592-024-02316-4 · Cited by 223
Self-citation
Metadata
- Authors
- Long, Y., Ang, K. S., Li, M., Chong, K. L. K., Sethi, R., Zhong, C., Xu, H., Ong, Z., Sachaphibulkij, K., Chen, A., Zeng, L., Fu, H., Wu, M., Lim, L. H. K., Liu, L., & Chen, J.
- Affiliations
- Agency for Science, Technology and Research (SG)
- National Neuroscience Institute (SG)
- National University of Singapore (SG)
- BGI Group (China) (CN)
- Duke-NUS Medical School (SG)
- Corresponding author
- Chen, Ao
- Chen, Jinmiao
- ORCID
- Venue
- Nature Communications
- Published
- 2023-03-01
- Volume
- 14
- Issue
- 1
- Pages
- 1155-1155
- ISSN
- 2041-1723 (ISSN-L)
- PMC
- PMC9977836
- OpenAlex
- W4322738920
- Cited by
- 700
- References
- 55
- Citations by year
- 2026: 284 · 2025: 233 · 2024: 156 · 2023: 27
- FWCI
- 62.55
- Type
- journal article
- Language
- en
- Open access
- gold
- doi.org
- Locations
- Nature Communications (publishedVersion, cc-by)
- bioRxiv (Cold Spring Harbor Laboratory) (acceptedVersion, cc-by-nc-nd)
- Research Square (acceptedVersion, cc-by)
- PubMed Central (publishedVersion, cc-by)
- PubMed (publishedVersion)
- RePEc: Research Papers in Economics (submittedVersion)
- DOAJ (DOAJ: Directory of Open Access Journals) (submittedVersion, cc-by-sa)
- Funders
- National Research Foundation
- National Research Foundation Singapore (2017-04, NRF-CRP19-2017-04, MOH-OFLCG18May-0003)
- Medical Research Council
- National Medical Research Council (MOH-OFLCG18May-0003, NMRC /OFLCG/003/2018, NMRC-OFIRG18nov-2013)
- Topics
- Life Sciences › Biochemistry, Genetics and Molecular Biology › Molecular Biology › Single-cell and spatial transcriptomics
- Life Sciences › Biochemistry, Genetics and Molecular Biology › Molecular Biology › Gene expression and cancer classification
- Life Sciences › Biochemistry, Genetics and Molecular Biology › Biophysics › Cell Image Analysis Techniques
- Keywords
- spatial transcriptomics, graph neural networks, self-supervised contrastive learning, spatial clustering, cell type deconvolution, batch effect correction, tumor-infiltrating T cells, breast tumors, brain tissue
- MeSH terms
- Brain, Cluster Analysis, Germinal Center, Gene Expression Profiling, Transcriptome
About these checks
Registry, retraction, Cites and statistics results are computed, not judged, with one exception: a printed reference that no index lists is read once by a model before it counts as a citation error. Claims are extracted by a model and kept only when their quote appears verbatim in the text; each cited source is then checked, with a model’s help, for whether it says what the claim relies on. Those verdicts can be wrong — read the claim’s quote and the cited source before relying on one.
Statistics and arithmetic are recomputed, not judged.
Confidence bands are shown only for fields calibrated on our annotated test set. None is calibrated yet, so no band is shown.
What counts as a claim ›How we measure confidence ›How we check this ›
Are you an author, or do you see a problem with this page? Request a review
