

The DOI matches its Crossref record; 35 of the 35 references it cites were found in a registry or an index.
Large socio-economic, geographic and demographic disparities exist in exposure to school closures
Open accessPublished version of a preprint
Abstract
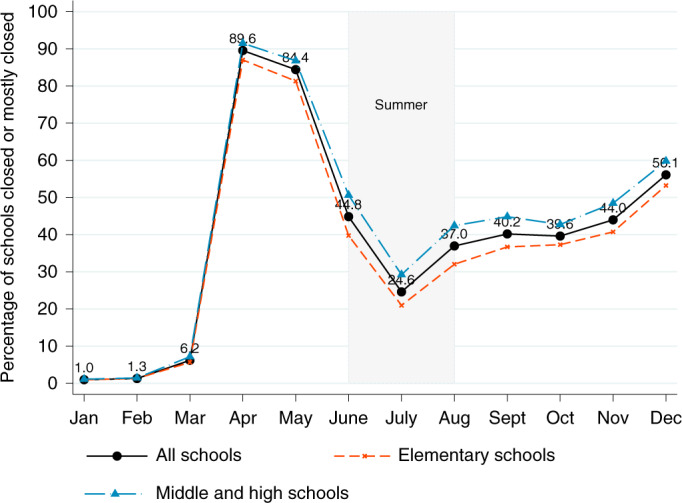
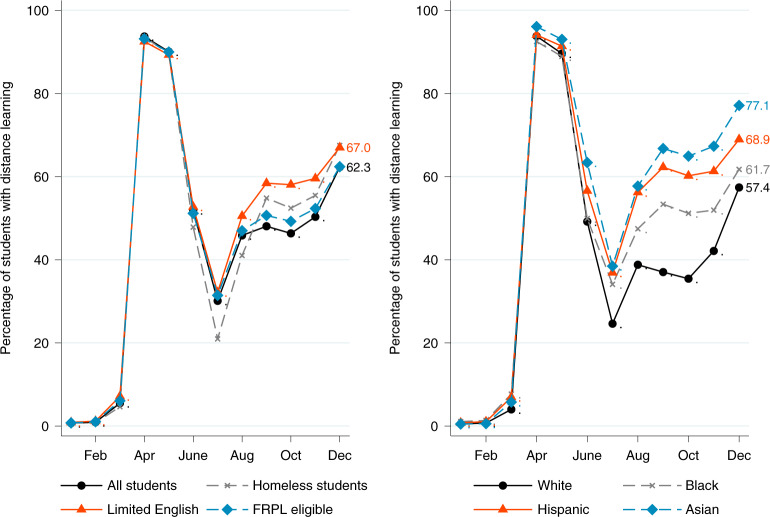
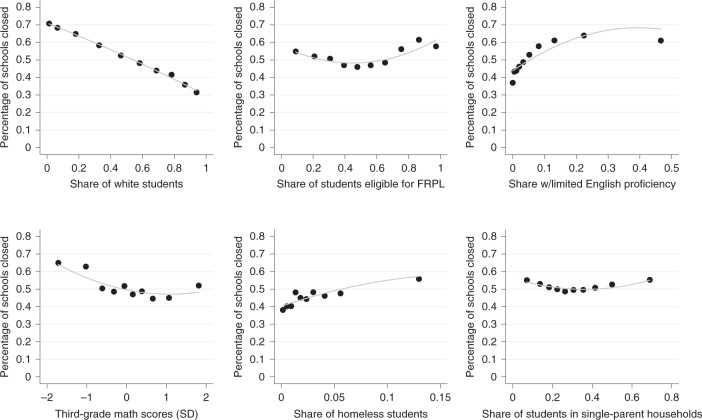
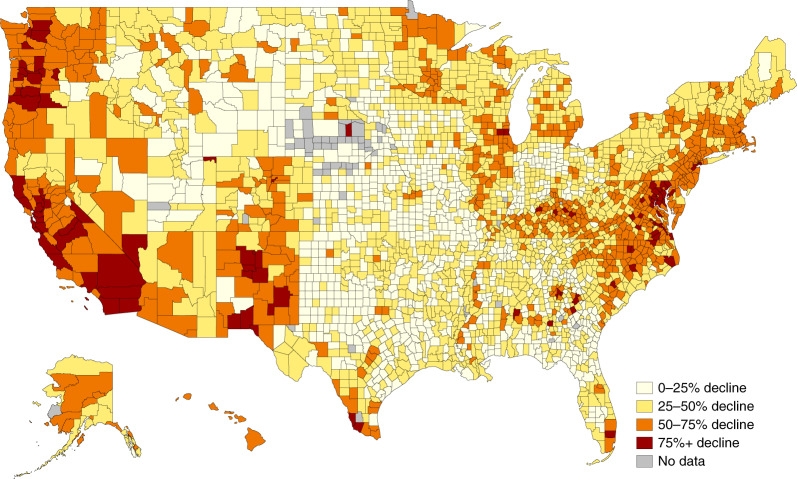
The coronovirus disease 2019 (COVID-19) pandemic has prompted many school districts to turn to distance or at-home learning. Studies are emerging on the negative effects of distance learning on educational performance, but less is known about the socio-economic, geographic and demographic characteristics of students exposed to distance learning. We introduce a U.S. School Closure and Distance Learning Database that tracks in-person visits across more than 100,000 schools throughout 2020. The database, which we make publicly accessible and update monthly, describes year-over-year change in in-person visits to each school throughout 2020 to estimate whether the school is engaged in distance learning. Our findings reveal that school closures from September to December 2020 were more common in schools with lower third-grade math scores and higher shares of students from racial/ethnic minorities, who experience homelessness, have limited English proficiency and are eligible for free/reduced-price school lunches. The findings portend rising inequalities in learning outcomes.
Overview
The claims and statistics of this paper haven’t been checked yet.
Run the check — free, no account needed. It reads the open-access text and checks the sources it cites.
Integrity signals
Registry
Cites
Statistics
Figures
Verification
Claims the paper makes
The claims and statistics of this paper haven’t been checked yet.
Run the check — free, no account needed. It reads the open-access text and checks the sources it cites.
Claims other papers make about this one
Each is checked against this paper’s own text: does it say what the citing paper says it does?
The cited source says what the claim attributes to it.
In the citing paper
“Our results show that learning loss was particularly pronounced for students from disadvantaged homes, confirming the fears held by many that school closures would cause socioeconomic gaps to widen (51 –55).”
From Learning loss due to school closures during the COVID-19 pandemic (2021) · cites this paper as [54]
The cited source says what the claim attributes to it.
In the citing paper
“Evidence from mobile phone locations (Parolin and Lee 2021) indicates that 9 out of 10 schools were closed in April 2020, falling to 40 percent in September but then rising again to 56 percent in December.”
From Educational Inequality* (2022) · cites this paper as Parolin and Lee 2021
The cited source says what the claim attributes to it.
In the citing paper
“Parolin and Lee (2021) show that school closures in the United States in the fall of 2020 were more common for students from ethnic minorities.”
From Educational Inequality* (2022) · cites this paper as Parolin and Lee (2021)
Self-check
Percentages, sums and reported differences re-computed from the paper’s own numbers.
The self-check needs the paper’s full text.
Citations
Cites
Learning loss due to school closures during the COVID-19 pandemic
Engzell, P., Frey, A., & Verhagen, M. D. (2021) · Proceedings of the National Academy of Sciences · doi:10.1073/pnas.2022376118 · Cited by 1,848
Learning loss due to school closures during the COVID-19 pandemic
Engzell, P., Frey, A., & Verhagen, M. D. (2020) · doi:10.31235/osf.io/ve4z7 · Cited by 1,739
Mobility network models of COVID-19 explain inequities and inform reopening
Chang, S., Pierson, E., Koh, P. W., Gerardin, J., Redbird, B., Grusky, D., & Leskovec, J. (2021) · Nature · doi:10.1038/s41586-020-2923-3 · Cited by 1,533
COVID-19, school closures, and child poverty: a social crisis in the making
Lancker, W. V., & Parolin, Z. (2020) · The Lancet Public Health · doi:10.1016/s2468-2667(20)30084-0 · Cited by 1,433
Self-citationAllcott, H., Boxell, L., Conway, J., Gentzkow, M., Thaler, M., & Yang, D. (2020) · Journal of Public Economics · doi:10.1016/j.jpubeco.2020.104254 · Cited by 999
Projecting the Potential Impact of COVID-19 School Closures on Academic Achievement
Kuhfeld, M., Soland, J., Tarasawa, B., Johnson, A., Ruzek, E., & Liu, J. (2020) · Educational Researcher · doi:10.3102/0013189x20965918 · Cited by 997
Fear, lockdown, and diversion: Comparing drivers of pandemic economic decline 2020
Goolsbee, A., & Syverson, C. (2021) · Journal of Public Economics · doi:10.1016/j.jpubeco.2020.104311 · Cited by 749
The Opportunity Atlas: Mapping the Childhood Roots of Social Mobility
Chetty, R., Friedman, J. N., Hendren, N., Jones, M. R., & Porter, S. R. (2018) · National Bureau of Economic Research · doi:10.3386/w25147 · Cited by 567
Giorgio, D. P., Federico, B., Costa, P., Karpiński, Z., & Mazza, J. (2020) · RePEc: Research Papers in Economics · doi:10.2760/126686 · Cited by 534
The Hispanic-White Achievement Gap in Math and Reading in the Elementary Grades
Reardon, S. F., & Galindo, C. (2009) · American Educational Research Journal · doi:10.3102/0002831209333184 · Cited by 511
Cited by
Sorted by citations
Items 101–200 of 220
Schools and the transmission of Sars-Cov-2: Evidence from Italy
Lattanzio, S. (2023) · Economics & Human Biology · doi:10.1016/j.ehb.2023.101342 · Cited by 4
The COVID-19 Pandemic and Oral Reading Fluency
Furjanic, D., Ives, C., Fainstein, D., Kennedy, P., & Biancarosa, G. (2024) · The Elementary school journal · doi:10.1086/730115 · Cited by 4
Du, F., & Mao, L. (2024) · Spatial and Spatio-temporal Epidemiology · doi:10.1016/j.sste.2024.100691 · Cited by 5
Coulter, K. M., & Benner, A. D. (2023) · Current Opinion in Psychology · doi:10.1016/j.copsyc.2023.101614 · Cited by 4
Transformational Creativity in Education
Ivčević, Z., Anderson, R., & Hoffmann, J. D. (2024) · Springer eBooks · doi:10.1007/978-3-031-51590-3_11 · Cited by 4
Makridis, C. A., Piano, C. E., & DeAngelis, C. A. (2022) · SSRN Electronic Journal · doi:10.2139/ssrn.4001953 · Cited by 4
The connection between missing school and Indigenous community: challenges and complexities
Zamzuri, N. H., Hanafiah, M. H., Sharif, T. I. S. T., Nor, N. M., & Rosnan, H. (2023) · AlterNative An International Journal of Indigenous Peoples · doi:10.1177/11771801231188015 · Cited by 4
Miller, E. B., Canfield, C. F., Aviles, A. I., Hunter, L. J., Shaw, D. S., Mendelsohn, A. L., & Morris‐Perez, P. A. (2025) · Early Child Development and Care · doi:10.1080/03004430.2025.2574979 · Cited by 3
Hunersen, K., Ramaiya, A., Cabral, C. S., Matilde Maddaleno, H., & Mmari, K. (2024) · Journal of Adolescent Health · doi:10.1016/j.jadohealth.2024.08.007 · Cited by 3
School closures, child maltreatment reporting and victimization during the pandemic
Chen, W., & Dube, S. R. (2025) · Child Abuse & Neglect · doi:10.1016/j.chiabu.2024.107243 · Cited by 3
Remote instruction adversely impacts parental mental health, less among homeschoolers
Makridis, C. A., Piano, C. E., & DeAngelis, C. A. (2025) · Scientific Reports · doi:10.1038/s41598-025-89804-5 · Cited by 3
Lee, J., Ottmar, E., Chan, J. Y., Decker, L. E., & Booker, B. (2025) · Learning Environments Research · doi:10.1007/s10984-025-09525-4 · Cited by 3
The countervailing impacts of significant 2020 events on youth delinquency
Baumer, E. P., & Staff, J. (2025) · Criminology · doi:10.1111/1745-9125.12410 · Cited by 4
Virtual Learning and Youth-Onset Type 2 Diabetes during the COVID-19 Pandemic
Grundman, J., Chung, S. T., Estrada, E., Podolsky, R. H., Meyers, A. G., & Marks, B. E. (2023) · Hormone Research in Paediatrics · doi:10.1159/000531720 · Cited by 3
Revisiting Ethnic Differences in In-Person Learning During the 2021-22 School Year
Camp, A. M., Johnson, A., & Zamarro, G. (2023) · Journal of School Choice · doi:10.1080/15582159.2023.2259630 · Cited by 3
Durable Change in U.S. Urban Mobility Networks, 2019–2022
Marlow, T., Makovi, K., & Abrahão, B. (2023) · Socius Sociological Research for a Dynamic World · doi:10.1177/23780231231198857 · Cited by 3
Investigating the effect of COVID-19 disruption in education using REDS data
Bertoletti, A., & Karpiński, Z. (2024) · Large-scale Assessments in Education · doi:10.1186/s40536-024-00195-x · Cited by 3
Taxing the Rich: How Incentives and Embeddedness Shape Millionaire Tax Flight
Young, C., & Lurie, I. Z. (2025) · American Journal of Sociology · doi:10.1086/737165 · Cited by 3
Disruption to Schooling Impedes the Development of Abstract Reasoning and Theory of Mind in ChildrenPreprint
Alan, Ş., & Turkum, B. (2023) · Research Square · doi:10.21203/rs.3.rs-2813458/v1 · Cited by 3
Parents’ Cigarette Purchases During COVID-19: Evidence From NielsenIQ Consumer Panel Data
Jones, L. E., Kang, N., & Yilmazer, T. (2025) · American Journal of Preventive Medicine · doi:10.1016/j.amepre.2025.107980 · Cited by 2
Liu, S., Mazzaferro, M. M., & Fisher, P. A. (2026) · Early Childhood Research Quarterly · doi:10.1016/j.ecresq.2026.03.007 · Cited by 2
Ali, N., Khasawneh, M. A. S., Murtaza, A., Hassan, M. U., Iqbal, T., Saeed, A., Akhter, M., & Hussain, P. D. A. (2026) · International Journal of Adolescence and Youth · doi:10.1080/02673843.2026.2665210 · Cited by 6
Locked, Stocked, and Charmin: Sources of White Americans’ Responses to the COVID-19 Pandemic
Jonson, C. L., Graham, A., Cullen, F. T., Pickett, J. T., Haner, M., & Sloan, M. M. (2023) · Victims & Offenders · doi:10.1080/15564886.2023.2183917 · Cited by 3
School Disruptions Exacerbated Inequality in High School Completion
Liu, R. (2023) · Educational Researcher · doi:10.3102/0013189x231167152 · Cited by 3
Hao, X. (2023) · PLoS ONE · doi:10.1371/journal.pone.0293168 · Cited by 2
Bellani, L., Bertogg, A., Kulić, N., & Strauß, S. (2024) · Genus · doi:10.1186/s41118-024-00212-5 · Cited by 2
Cantor, J., Whaley, C., Ward, J., & Jena, A. B. (2024) · Health Affairs · doi:10.1377/hlthaff.2023.01250 · Cited by 2
Adult children's responsiveness to parental needs during the pandemic
Lin, I., Wiemers, E., Chin, J. A., Strauss, A. W., Seltzer, J. A., & Hotz, V. J. (2024) · Journal of Marriage and the Family · doi:10.1111/jomf.13043 · Cited by 2
The fall and rise of parental financial investments during the COVID ‐19 pandemic
Hastings, O. P., Amorim, M. F. D. C. L., & Kornrich, S. (2024) · Journal of Marriage and the Family · doi:10.1111/jomf.13046 · Cited by 2
Senarath, N., Dedunupitiya, W., Ilangarathna, G. A., Thilakasiri, I., Samarakoon, B., Ramanayake, L., Godaliyadda, R. I., Ekanayake, P., Herath, V. R., Pinnawala, M., et al. (2024) · Humanities and Social Sciences Communications · doi:10.1057/s41599-024-04099-7 · Cited by 3
The Politics of Pandemic School Operations for Reopening and Beyond: Evidence from Virginia
Schueler, B. E., Miller, L. C., & Reynolds, A. (2025) · American Educational Research Journal · doi:10.3102/00028312251348247 · Cited by 2
Fahle, E. M., Kane, T. J., Patterson, T., Reardon, S. F., Staiger, D. O., & Stuart, E. A. (2025) · Teachers College Record The Voice of Scholarship in Education · doi:10.1177/01614681251369937 · Cited by 4
Lucchini, L., Marziano, V., Trentini, F., Chiavenna, C., D’Agnese, E., Offeddu, V., Manica, M., Poletti, P., Balsamo, D., Guzzetta, G., et al. (2026) · Communications Medicine · doi:10.1038/s43856-026-01543-4 · Cited by 4
Capacidades estatais e políticas municipais de Educação durante a pandemia de Covid-19
Lui, L., Segatto, C. I., Albert, C., & Marques, R. (2023) · Cadernos Gestão Pública e Cidadania · doi:10.12660/cgpc.v28.86049 · Cited by 2
Hernandez, A. M., & Daoud, A. M. (2024) · Journal of Latinos and Education · doi:10.1080/15348431.2024.2370835 · Cited by 2
Consistency between Household and County Measures of Onsite Schooling during the COVID-19 Pandemic
Lupton‐Smith, C., Goicoechea, E. B., Collins, M. E., Lessler, J., Grabowski, M. K., & Stuart, E. A. (2022) · Journal of Research on Educational Effectiveness · doi:10.1080/19345747.2022.2131660 · Cited by 6
Gaofeng, Z. (2021) · SSRN Electronic Journal · doi:10.2139/ssrn.3945380 · Cited by 2
School Closures and Effective In-Person Learning During Covid-19: When, Where, and for WhomPreprint
Kurmann, A., & Lalé, É. (2022) · SSRN Electronic Journal · doi:10.2139/ssrn.4114107 · Cited by 2
Learning motivation and engagement
Wang, M., Scanlon, C. L., & Henry, D. A. (2023) · Elsevier eBooks · doi:10.1016/b978-0-323-96023-6.00010-5 · Cited by 3
The Future of Work: Remote Opportunities and Female Labor Force ParticipationPreprint
Song, M. (2025) · SSRN Electronic Journal · doi:10.2139/ssrn.5127427 · Cited by 2
Lattke, L. S., Lorenzo, A. D., Tesauri, B., & Rabaglietti, E. (2022) · Adolescents · doi:10.3390/adolescents2030030 · Cited by 1
Asadolahi, S., Davidson, A. M., & White, L. A. (2023) · Politics Groups and Identities · doi:10.1080/21565503.2023.2286389 · Cited by 1
AI-Based Models for Identifying Underdeveloped Villages in Indonesia's Rural Development
Azies, H. A. (2024) · The Journal of Indonesia Sustainable Development Planning · doi:10.46456/jisdep.v5i3.611 · Cited by 1
School Distance: Its Impact to Learners’ Academic Performance
Mangotara, M., & Basmayor, E. N. (2025) · Psychology and Education A Multidisciplinary Journal · doi:10.70838/pemj.350406 · Cited by 1
The Path of Student Learning Delay During the COVID-19 Pandemic: Evidence from Michigan
Strunk, K. O., Kilbride, T., Imberman, S. A., Walker, S., Yu, D., & Hopkins, B. (2025) · Education Finance and Policy · doi:10.1162/edfp.a.26 · Cited by 1
Singer, J. (2025) · Teachers College Record The Voice of Scholarship in Education · doi:10.1177/01614681251368326 · Cited by 1
Connolly, C., Steinbach, S., Vo, M., & Wan, X. (2026) · Journal of Economic Surveys · doi:10.1111/joes.70047 · Cited by 1
Palmer, A. R., Tan, P., Aralis, H. J., Edwards, N. C., Kataoka, S., Wood, A., Hwang, J., & Ijadi‐Maghsoodi, R. (2026) · Child Development · doi:10.1093/chidev/aacag146 · Cited by 1
Challenges with Evaluating Education Policy Using Panel Data during and after the COVID-19 Pandemic
Feller, A., & Stuart, E. A. (2021) · Journal of Research on Educational Effectiveness · doi:10.1080/19345747.2021.1938316 · Cited by 1
Terry, N. P., Zuckerman, A. P., & McCardle, P. (2023) · The Elementary School Journal · doi:10.1086/723376 · Cited by 1
State capacities and municipal education policies during the COVID-19 pandemic
Lui, L., Segatto, C. I., Albert, C., & Marques, R. (2023) · Cadernos Gestão Pública e Cidadania · doi:10.12660/cgpc.v28.86049.84315 · Cited by 1
Yépez, M. P., Ron, V. L., García-Santillán, I. D., & Astudillo, Á. M. P. (2023) · Digital Education Review · doi:10.1344/der.2023.44.83-92 · Cited by 1
COVID-19 across the Life Course
Kuh, D. J., & Blodgett, J. M. (2024) · Oxford University Press eBooks · doi:10.1093/oso/9780197625217.003.0002 · Cited by 1
Luo, C. Y., Kowalczyk, M., Msall, M. E., & Volerman, A. (2024) · Journal of Developmental & Behavioral Pediatrics · doi:10.1097/dbp.0000000000001294 · Cited by 1
Wu, Y. P., Brunsgaard, E. K., Siniscalchi, N., Stump, T. K., Smith, H., Grossman, D., Jensen, J. D., Buller, D. B., Hay, J. L., Shen, J., et al. (2024) · Contemporary Clinical Trials Communications · doi:10.1016/j.conctc.2024.101399 · Cited by 1
Alifah, A. N., Permata, R. P., Sanjaya, I. M. W. A., Arismawati, P., & Prastyabudi, W. A. (2024) · Beyond Technology Summit on Informatics International Conference (BTS-I2C) · doi:10.1109/bts-i2c63534.2024.10941845 · Cited by 1
Back to school: The effect of school visits during COVID-19 on COVID-19 outcomes
Bravata, D. M., Cantor, J., Sood, N., & Whaley, C. (2025) · Journal of Health Economics · doi:10.1016/j.jhealeco.2025.103025 · Cited by 1
Forecasting the Long-Term Effects of the Pandemic on Children: Towards a COVID-Generation
Pelekasis, P. (2021) · IntechOpen eBooks · doi:10.5772/intechopen.97931 · Cited by 1
COVID-19 Vaccination for Caregivers in the Pediatric Medical Home
Wenderlich, A. M., Rand, C. M., & Halterman, J. S. (2021) · Archives of Pediatrics and Adolescent Medicine · doi:10.1001/jamapediatrics.2021.4214 · Cited by 1
Sommer, U., & Rappel‐Kroyzer, O. (2023) · Political Geography · doi:10.1016/j.polgeo.2023.102939 · Cited by 1
COVID-19 and children's behavioral health: An overview
Pajek, J. A., Mancini, K. J., & Murray, M. S. (2023) · Current problems in pediatric and adolescent health care · doi:10.1016/j.cppeds.2023.101491 · Cited by 3
Terry, N. P., Zuckerman, A. P., & McCardle, P. (2022) · New Directions for Child and Adolescent Development · doi:10.1002/cad.20472 · Cited by 1
Freedman, S. M., Marquardt, K., Salcedo, D., Simon, K. I., & Wing, C. (2023) · doi:10.21033/wp-2023-04 · Cited by 1
Pediatric Drug Adherence and Parental Attention: Evidence from Comprehensive Claims Data
Feng, J., Higgins, M., & Patel, E. S. (2023) · National Bureau of Economic Research · doi:10.3386/w30968 · Cited by 1
The Effects of COVID-19-Imposed School Closures on Children
Brussier, I. C. (2022) · Advances in psychology, mental health, and behavioral studies (APMHBS) book series · doi:10.4018/978-1-6684-3484-0.ch008
Hassan, H., Siddique, A., Wang, L. C., & Islam, A. (2020) · AEA Randomized Controlled Trials · doi:10.1257/rct.6395
The Impact of Schools on the Transmission of Sars-Cov-2: Evidence from Italy *Preprint
Lattanzio, S. (2022) · medRxiv · doi:10.1101/2022.07.18.22276940
Writing as a Form of Agency and Advocacy
Wright, K. L., & Hodges, T. S. (2022) · Advances in educational technologies and instructional design book series · doi:10.4018/978-1-6684-3745-2.ch011
Every Child and Adolescent, Everywhere
Okechukwu, A., Okusanya, B. O., & Ehiri, J. E. (2022) · Routledge eBooks · doi:10.4324/9781003128373-13
“I Think I’ve Always Thought I Have to Prove Myself”
Zavala, R. (2022) · San José State University ScholarWorks (San Jose State University) · doi:10.31979/etd.uxzx-z6y5
Covid pandemic as a disruptive factor enhancing ICT use in social sciences’ teaching practices
(2022) · Scientific Papers of Silesian University of Technology Organization and Management Series · doi:10.29119/1641-3466.2022.160.25
Kannan, K. B. N., & Taylor, W. (2023) · SSRN Electronic Journal · doi:10.2139/ssrn.4173547
Pediatric Drug Adherence and Parental Attention: Evidence from Comprehensive Claims DataPreprint
Feng, J., Higgins, M. J., & Patel, E. S. (2023) · SSRN Electronic Journal · doi:10.2139/ssrn.4364716
Keeping Children, Teachers, and Staff in School: How to Prepare Schools for the Next Pandemic
Fink, B. (2023) · Journal of School Health · doi:10.1111/josh.13398
Diemer, A. R., Shelton, A. J., Park, A., Langley, P., & Anglum, J. C. (2023) · Education Policy Analysis Archives · doi:10.14507/epaa.31.8111
CEO Gender and the Employment Collapse during Recessions: Evidence from 11 Million US FirmsPreprint
Chang, M.-C., & Park, Z. (2023) · SSRN Electronic Journal · doi:10.2139/ssrn.4659747
Hassan, H., Islam, A., Wang, L. C., & Siddique, A. (2020) · AEA Randomized Controlled Trials · doi:10.1257/rct.6395-1.3
School Closures and Parental Mental Health
Gupta, S., Salcedo, D., & Simon, K. I. (2024) · National Bureau of Economic Research · doi:10.3386/w32516
The Good, Bad, and Ugly of School Closures and Virtual Learning
Colvin, M. K., Reesman, J. L., & Glen, T. (2024) · doi:10.1093/9780197762660.003.0002
Teleworking and Remote Schooling During the PandemicPreprint
Loewenstein, M. A. (2024) · Research Square · doi:10.21203/rs.3.rs-4758000/v1
Jan Stuhler discussion of: Women in politics during COVID
Stuhler, J. L. (2024) · Economic Policy · doi:10.1093/epolic/eiae049
COVID-19 Incidence and Age Eligibility for Elementary School
Lin, E., Bilinski, A., Collender, P. A., Lee, V., Sud, S. R., León, T. M., White, L. A., Remais, J. V., & Head, J. R. (2024) · JAMA Network Open · doi:10.1001/jamanetworkopen.2024.44836
Jones, T. M., Hwang, S. H. J., Metzger, A. N., Bailey, J. A., Deng, J., Cirolia, A., Stone, S., & Shapiro, V. B. (2026) · Contemporary School Psychology · doi:10.1007/s40688-026-00600-y
Teleworking and remote schooling during the COVID-19 pandemic
Loewenstein, M. A. (2013) · Monthly labor review · doi:10.21916/mlr.2025.10
Parents' Cigarette Purchases during COVID-19: Evidence from NielsenIQ Consumer Panel DataPreprint
Jones, L. E., Kang, N., & Yilmazer, T. (2025) · SSRN Electronic Journal · doi:10.2139/ssrn.5251465
How dormant ties are reactivated through social media during major life events
Zhao, Y., Bai, W., Qiao, T., & Wang, W. (2025) · Computers in Human Behavior · doi:10.1016/j.chb.2025.108746
Oh, G. Y., Lee, E., Yoo, A., Park, C., & Lee, Y.-R. (2025) · SSRN Electronic Journal · doi:10.2139/ssrn.5363089
Self-citationShifting preferences: COVID-19 and higher education application *
Dagorn, E., Meroni, E. C., & Moulin, L. (2025) · Applied Economics · doi:10.1080/00036846.2025.2536753
Bittencourt, T., Callejas, G. B., & Vásquez, D. R. (2025) · Journal of Research in International Education · doi:10.1177/14752409251368535
Perusopetuksen tilannekuva erilaistuvissa kunnissa: Manner-Suomen kuntien tarkastelu
Kalalahti, M., Minkkinen, L., Saarinen, T., Tyni, K., Vaara, E., Ala‐Vähälä, T., Häkkinen, P., Jänkälä, J.-P., Pitkänen, H., Pöysä‐Tarhonen, J., et al. (2025) · Koulutuksen tutkimuslaitos Raportteja ja työpapereita · doi:10.17011/ktl-rt/16 · Cited by 6
Estimating the Economic Cost of Floods: Evidence from Urban Mobility and Rental MarketsPreprint
Zheng, S., Lee, S., & Xibo, W. A. N. (2025) · SSRN Electronic Journal · doi:10.2139/ssrn.5502768
Effects of the COVID-19 pandemic on student performance in anatomy and physiology labs
Pollock, N. B. (2025) · AJP Advances in Physiology Education · doi:10.1152/advan.00163.2025
Covid-19 School and Child Care Center Closures and Female Labor Force ParticipationPreprint
Kaltenberg, M., & Osborne-Christenson, E. (2025) · Research Square · doi:10.21203/rs.3.rs-7303187/v1
Muzayanah, U., Muawanah, S., Wibowo, A. M., & Sofanudin, A. (2025) · Cogent Education · doi:10.1080/2331186x.2025.2577910
Alifah, A. N., Permata, R. P., & Sholana, I. (2025) · AIP conference proceedings · doi:10.1063/5.0299370
Lohmann, C., & Haller, T. (2025) · Research in Social Stratification and Mobility · doi:10.1016/j.rssm.2025.101106
(2023) · Emerald Group Publishing Limited eBooks · doi:10.1108/979-8-88730-294-220251040
Bellani, L., Bertogg, A., Kulić, N., & Strauß, S. (2024) · Figshare · doi:10.6084/m9.figshare.26726788
Metadata
- Authors
- Parolin, Z., & Lee, E. K.
- Affiliations
- Bocconi University (IT)
- Columbia University (US)
- Corresponding author
- Parolin, Zachary
- Venue
- Nature Human Behaviour
- Published
- 2021-03-18
- Volume
- 5
- Issue
- 4
- Pages
- 522-528
- ISSN
- 2397-3374 (ISSN-L)
- PMC
- PMC8060162
- OpenAlex
- W3138870524
- Cited by
- 217
- References
- 35
- Citations by year
- 2026: 26 · 2025: 27 · 2024: 42 · 2023: 54 · 2022: 44 · 2021: 23
- FWCI
- 71.66
- Type
- journal article
- Language
- en
- Open access
- hybrid
- doi.org
- Locations
- Nature Human Behaviour (publishedVersion, cc-by)
- PubMed Central (publishedVersion, cc-by)
- PubMed (publishedVersion)
- RePEc: Research Papers in Economics (submittedVersion)
- Archivio istituzionale della Ricerca - Bocconi (submittedVersion)
- OSF Preprints (OSF Preprints) (submittedVersion, cc-by)
- OSF Preprints (OSF Preprints) (submittedVersion)
- Funders
- Bill and Melinda Gates Foundation (017972)
- Topics
- Social Sciences › Education › Education during COVID-19 pandemic
- Social Sciences › Education › School Choice and Performance
- Physical Sciences › Mathematics › Modeling and Simulation › COVID-19 epidemiological studies
- Keywords
- school closures, distance education, COVID-19 pandemic, educational inequality, socioeconomic disparities, racial and ethnic disparities, homelessness, limited English proficiency, learning outcomes
- MeSH terms
- Academic Performance, Limited English Proficiency, COVID-19, SARS-CoV-2, Adolescent, Child, Communicable Disease Control, Ethnicity, Ill-Housed Persons, Humans, Income, Minority Groups, Public Policy, Schools, Socioeconomic Factors, United States, Databases, Factual, Education, Distance
About these checks
Registry, retraction, Cites and statistics results are computed, not judged, with one exception: a printed reference that no index lists is read once by a model before it counts as a citation error. Claims are extracted by a model and kept only when their quote appears verbatim in the text; each cited source is then checked, with a model’s help, for whether it says what the claim relies on. Those verdicts can be wrong — read the claim’s quote and the cited source before relying on one.
Statistics and arithmetic are recomputed, not judged.
Confidence bands are shown only for fields calibrated on our annotated test set. None is calibrated yet, so no band is shown.
What counts as a claim ›How we measure confidence ›How we check this ›
Are you an author, or do you see a problem with this page? Request a review
