Student or educator? Sign up with your school email and get 6 months of Pro free.
CoChat

The DOI matches its Crossref record; 95 of the 95 references it cites were found in a registry or an index.

Massive haplotypes underlie ecotypic differentiation in sunflowers

Open access

Published version of a preprint

Abstract

Species often include multiple ecotypes that are adapted to different environments1. However, it is unclear how ecotypes arise and how their distinctive combinations of adaptive alleles are maintained despite hybridization with non-adapted populations2–4. Here, by resequencing 1,506 wild sunflowers from 3 species (Helianthus annuus, Helianthus petiolaris and Helianthus argophyllus), we identify 37 large (1–100 Mbp in size), non-recombining haplotype blocks that are associated with numerous ecologically relevant traits, as well as soil and climate characteristics. Limited recombination in these haplotype blocks keeps adaptive alleles together, and these regions differentiate sunflower ecotypes. For example, haplotype blocks control a 77-day difference in flowering between ecotypes of the silverleaf sunflower H. argophyllus (probably through deletion of a homologue of FLOWERING LOCUS T (FT)), and are associated with seed size, flowering time and soil fertility in dune-adapted sunflowers. These haplotypes are highly divergent, frequently associated with structural variants and often appear to represent introgressions from other—possibly now-extinct—congeners. These results highlight a pervasive role of structural variation in ecotypic adaptation. Resequencing analyses of three species of wild sunflower identify large non-recombining haplotype blocks that correlate with ecologically relevant traits, soil and climate characteristics, and that differentiate species ecotypes.

Overview

The claims and statistics of this paper haven’t been checked yet.

Free: it reads the open-access text and checks the first 5 claims that cite a source we can check. Create a free account to check every claim.

A few free checks a day · papers already verified open instantly · results are public

Integrity signals

Registry

Crossref · 10.1038/s41586-020-2467-6

Cites

95 of 95 references verified0 citation errors · 0 not checkable

Statistics

Figures

Fig. 1 Population structure and association analyses of wild sunflowers. a , Map of wild sunflower populations surveyed in this study. b , Maximum-likelihood tree for the samples included in this study and previously described samples from cultivated sunflowers 16 . Bootstrap values for major nodes are reported (asterisks = 100; squares >89). c , Flowering-time GWA study for H. annuus . The purple line represents 5% Bonferroni-corrected significance. d , GEA analysis of degree-days below 18 °C (DD < 18) for H. annuus . The purple line represents a Bayes factor (BF is ) of 20 deciban (dB). Additional statistical information is provided in Methods.
Fig. 1 Population structure and association analyses of wild sunflowers. a , Map of wild sunflower populations surveyed in this study. b , Maximum-likelihood tree for the samples included in this study and previously described samples from cultivated sunflowers 16 . Bootstrap values for major nodes are reported (asterisks = 100; squares >89). c , Flowering-time GWA study for H. annuus . The purple line represents 5% Bonferroni-corrected significance. d , GEA analysis of degree-days below 18 °C (DD < 18) for H. annuus . The purple line represents a Bayes factor (BF is ) of 20 deciban (dB). Additional statistical information is provided in Methods.CC-BY · From the PDF
Fig. 2 A large introgression from H. annuus containing a functional Ha FT1 gene causes early flowering in coastal H. argophyllus . a , Inland (left) and coastal-island (right) H. argophyllus plants. Image provided by B. T. Moyers. b , Distribution of late- and early-flowering ecotypes (left), and of haplotypes of the causal 10-Mbp region on chromosome 6 (right). c , d , Flowering-time GWA analysis in H. argophyllus ( c ) and enlarged view of the bottom of chromosome 6 ( d ). The purple line represents 5% Bonferroni-corrected significance. e , PCA of the last 30 Mbp of chromosome 6. Three clusters are defined by principal component 1 (PC1). f , Schematic of all unique haplotypes found at the bottom of chromosome 6, and corresponding flowering time. Chromosome positions match d . g , Flowering times associated with different genotypes at the approximately 130-140-Mbp region of chromosome 6 ( ann , H. annuus ). h , Sequencing depth of SNPs in the Ha FT1 gene. i , PCR on genomic DNA from early- and late-flowering H. argophyllus plants. j , Expression analysis in mature leaves or shoot apices of the plants examined in i , grown for six weeks in long-day conditions (14 h light; 10 h dark). Cleaved-amplified polymorphic sequence (CAPS) markers were used to distinguish Ha FT1 from Ha FT2 . For gel source data, see Supplementary Fig. 1. k , Six-week-old A. thaliana plants grown in long-day conditions. ft-10 is a late-flowering A. thaliana FT mutant in Col-0 background. Scale bar, 1 cm. l , Flowering time (as total leaf number) for primary transformants that express the FT1 gene from H. argophyllus in the ft-10 background. Difference between ft-10 and Ha FT1 ft-10 is significant ( P < 10 -8 ). m , Maximum likelihood phylogeny of the 130-140-Mbp region on chromosome 6 in H. argophyllus and H. annuus . Bootstrap values for major nodes are reported (asterisks = 100). Additional statistical information is provided in Methods.
Fig. 2 A large introgression from H. annuus containing a functional Ha FT1 gene causes early flowering in coastal H. argophyllus . a , Inland (left) and coastal-island (right) H. argophyllus plants. Image provided by B. T. Moyers. b , Distribution of late- and early-flowering ecotypes (left), and of haplotypes of the causal 10-Mbp region on chromosome 6 (right). c , d , Flowering-time GWA analysis in H. argophyllus ( c ) and enlarged view of the bottom of chromosome 6 ( d ). The purple line represents 5% Bonferroni-corrected significance. e , PCA of the last 30 Mbp of chromosome 6. Three clusters are defined by principal component 1 (PC1). f , Schematic of all unique haplotypes found at the bottom of chromosome 6, and corresponding flowering time. Chromosome positions match d . g , Flowering times associated with different genotypes at the approximately 130-140-Mbp region of chromosome 6 ( ann , H. annuus ). h , Sequencing depth of SNPs in the Ha FT1 gene. i , PCR on genomic DNA from early- and late-flowering H. argophyllus plants. j , Expression analysis in mature leaves or shoot apices of the plants examined in i , grown for six weeks in long-day conditions (14 h light; 10 h dark). Cleaved-amplified polymorphic sequence (CAPS) markers were used to distinguish Ha FT1 from Ha FT2 . For gel source data, see Supplementary Fig. 1. k , Six-week-old A. thaliana plants grown in long-day conditions. ft-10 is a late-flowering A. thaliana FT mutant in Col-0 background. Scale bar, 1 cm. l , Flowering time (as total leaf number) for primary transformants that express the FT1 gene from H. argophyllus in the ft-10 background. Difference between ft-10 and Ha FT1 ft-10 is significant ( P < 10 -8 ). m , Maximum likelihood phylogeny of the 130-140-Mbp region on chromosome 6 in H. argophyllus and H. annuus . Bootstrap values for major nodes are reported (asterisks = 100). Additional statistical information is provided in Methods.CC-BY · From the PDF
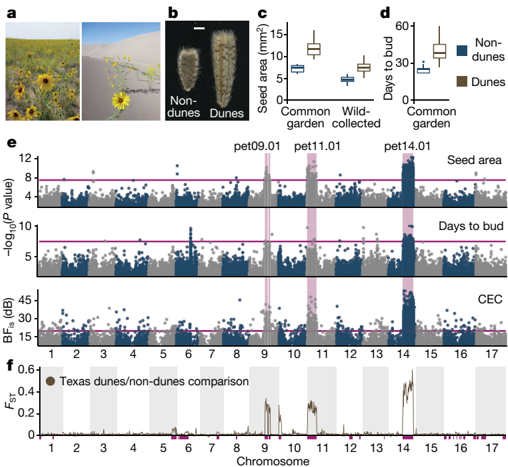
Fig. 3 Large non-recombining haplotypes control dune adaptation in H. p. fallax . a , Sand sheet (left) or sand dune (right) populations of H. petiolaris . The dune sunflowers image was provided by J. D. Herndon. b , Representative seeds from dune-adapted and non-dune-adapted plants grown in a common garden. Scale bar, 1 mm. c , Seed size (area), averaged for eight seeds per plant. Seeds were collected in the wild or from a common garden. In both conditions, seeds from dune-adapted plants are about 60% larger than those of non-dune-adapted plants. P = 2.2 × 10 -16 for wild plants, P = 1.2 × 10 -6 for common garden plants. d , Flowering time in a common garden. P = 8.1 × 10 -8 . e , Seed-size and flowering-time GWA analyses, and CEC (soil fertility) GEA analysis for H. p. fallax . Purple lines represent 5% Bonferroni-corrected significance (in the GWA analyses), and BF is = 20 dB (in the GEA analysis). Haploblock predictions corresponding to three significant plateaus are highlighted in purple. f , F ST values in 2-Mbp non-overlapping sliding windows for comparisons between dune- and non-dune-adapted Texas populations of H. p. fallax . Purple bars represent predicted haploblocks. Some predicted haploblocks are fragmented owing to rearrangements in H. petiolaris relative to the H. annuus reference genome. Additional statistical information is provided in Methods.
Fig. 3 Large non-recombining haplotypes control dune adaptation in H. p. fallax . a , Sand sheet (left) or sand dune (right) populations of H. petiolaris . The dune sunflowers image was provided by J. D. Herndon. b , Representative seeds from dune-adapted and non-dune-adapted plants grown in a common garden. Scale bar, 1 mm. c , Seed size (area), averaged for eight seeds per plant. Seeds were collected in the wild or from a common garden. In both conditions, seeds from dune-adapted plants are about 60% larger than those of non-dune-adapted plants. P = 2.2 × 10 -16 for wild plants, P = 1.2 × 10 -6 for common garden plants. d , Flowering time in a common garden. P = 8.1 × 10 -8 . e , Seed-size and flowering-time GWA analyses, and CEC (soil fertility) GEA analysis for H. p. fallax . Purple lines represent 5% Bonferroni-corrected significance (in the GWA analyses), and BF is = 20 dB (in the GEA analysis). Haploblock predictions corresponding to three significant plateaus are highlighted in purple. f , F ST values in 2-Mbp non-overlapping sliding windows for comparisons between dune- and non-dune-adapted Texas populations of H. p. fallax . Purple bars represent predicted haploblocks. Some predicted haploblocks are fragmented owing to rearrangements in H. petiolaris relative to the H. annuus reference genome. Additional statistical information is provided in Methods.CC-BY · From the PDF
Fig. 4 Large haploblocks are pervasive in wild sunflowers and are associated with structural variants. a , Local PCA output for putative segregating haploblock (ann05.01). Dots represent 100 SNP windows; outlier windows are highlighted. MDS, multidimensional scaling. b , Genomic positions of identified haploblocks. Some predicted haploblocks are fragmented owing to rearrangements relative to the H. annuus reference genome. c , PCA for the ann05.01 region in H. annuus . d , Heterozygosity at ann05.01 for the three clusters of plants identified in c . e , Linkage disequilibrium (LD) plot for chromosome 5. Top triangle, all H. annuus plants; bottom triangle, plants homozygous for the more-common haploblock allele. Colours represent the second highest R 2 value in 0.5-Mbp windows. Purple bars and the white box represent ann05.01. f , Comparison of chromosome-5 organization between two sunflower reference assemblies. Red, reverse; blue, forward. g , Comparison between genetic maps for H. p. fallax and the chromosome-17 HA412-HOv2 reference sequence. A predicted haploblock (pet17.01) is highlighted in purple. h , Comparison of HiC link patterns between pairs of plants with different haplotypes at three haploblocks. Red and blue dots show increased and decreased long-distance interactions, respectively, in one sample, consistent with structural variants. Differences highlighted by black arrows are in the >99.9th percentile compared to all other possible interactions at the same distance across the genome. Purple bars and solid black lines represent predicted haploblocks. The dune haplotype for pet09.01 is split in two fragments (dotted lines) when aligned to the H. annuus reference genome. Additional statistical information is provided in Methods.
Fig. 4 Large haploblocks are pervasive in wild sunflowers and are associated with structural variants. a , Local PCA output for putative segregating haploblock (ann05.01). Dots represent 100 SNP windows; outlier windows are highlighted. MDS, multidimensional scaling. b , Genomic positions of identified haploblocks. Some predicted haploblocks are fragmented owing to rearrangements relative to the H. annuus reference genome. c , PCA for the ann05.01 region in H. annuus . d , Heterozygosity at ann05.01 for the three clusters of plants identified in c . e , Linkage disequilibrium (LD) plot for chromosome 5. Top triangle, all H. annuus plants; bottom triangle, plants homozygous for the more-common haploblock allele. Colours represent the second highest R 2 value in 0.5-Mbp windows. Purple bars and the white box represent ann05.01. f , Comparison of chromosome-5 organization between two sunflower reference assemblies. Red, reverse; blue, forward. g , Comparison between genetic maps for H. p. fallax and the chromosome-17 HA412-HOv2 reference sequence. A predicted haploblock (pet17.01) is highlighted in purple. h , Comparison of HiC link patterns between pairs of plants with different haplotypes at three haploblocks. Red and blue dots show increased and decreased long-distance interactions, respectively, in one sample, consistent with structural variants. Differences highlighted by black arrows are in the >99.9th percentile compared to all other possible interactions at the same distance across the genome. Purple bars and solid black lines represent predicted haploblocks. The dune haplotype for pet09.01 is split in two fragments (dotted lines) when aligned to the H. annuus reference genome. Additional statistical information is provided in Methods.CC-BY · From the PDF
Fig. 5 Haploblocks are highly divergent and are associated with multiple ecologically relevant traits and environmental variables. a , Bayesian phylogeny of ann05.01. Ma, million years ago. b , Divergence-time estimates for haploblocks, relative to those of different species or subspecies of wild sunflowers. c , Summary of GWA and GEA analyses for haploblocks treated as single loci. Darker squares represent categories that contain at least one trait or variable that is significantly associated with a haploblock ( P < 0.001; BFis > 10). d , GEA analyses for temperature difference (TD) (a measure of continentality) using a kinship matrix and PCA covariate including (black dots) or excluding (yellow dots) the haploblock regions. Haploblocks are highlighted in purple. Purple lines represent BF is = 20 dB (for the GEAs). Additional statistical information is provided in Methods.
Fig. 5 Haploblocks are highly divergent and are associated with multiple ecologically relevant traits and environmental variables. a , Bayesian phylogeny of ann05.01. Ma, million years ago. b , Divergence-time estimates for haploblocks, relative to those of different species or subspecies of wild sunflowers. c , Summary of GWA and GEA analyses for haploblocks treated as single loci. Darker squares represent categories that contain at least one trait or variable that is significantly associated with a haploblock ( P < 0.001; BFis > 10). d , GEA analyses for temperature difference (TD) (a measure of continentality) using a kinship matrix and PCA covariate including (black dots) or excluding (yellow dots) the haploblock regions. Haploblocks are highlighted in purple. Purple lines represent BF is = 20 dB (for the GEAs). Additional statistical information is provided in Methods.CC-BY · From the PDF
Image 6
CC-BY · From the PDF
Extended Data Fig. 2 | Phenotypic, structural and functional analyses for arg06.01. a , Flowering time for the three wild sunflower species measured in a common garden experiment. Number of individuals: n = 612 ( H. annuus ); n = 161 ( H. petiolaris petiolaris ); n = 211 ( H. petiolaris fallax ); n = 48 ( H. niveus canescens ); n = 261 ( H. argophyllus 0/0); n = 25 ( H. argophyllus 0/1); n = 23 ( H. argophyllus 1/1). b , Leaf nitrogen content and carbon/nitrogen ratio GWAs in H. argophyllus (two-sided mixed model associations; n = 289 individuals). The purple lines represent 5% Bonferroni-corrected significance. Only positions with -log 10 P value >2 are plotted. c , Genotype presence or absence for the 130-135-Mbp region of chromosome 6 in H. argophyllus . The x -axis represents consecutive SNP positions; distances on this axis are therefore not proportional to physical distances on the chromosome. Purple bars highlight the positions of the five HaFT genes in the region (Ha FT5 and Ha FT6 are only a few hundred bp apart). Flowering time data are the same as used in GWA analyses. d , Ha FT1 and Ha FT2 expression levels in mature leaves or shoot apices of >6-month-old, flowering H. argophyllus plants, grown in a greenhouse in long days conditions (14 h light:10 h dark). This experiment was performed on two independent pairs of individuals, with similar results. e , Six-week-old A. thaliana plants grown in long day conditions at 23 °C. At least 19 independent transgenic events were analysed for each construct in each genetic background, and flowering time was consistent within each group. Scale bar,
Extended Data Fig. 2 | Phenotypic, structural and functional analyses for arg06.01. a , Flowering time for the three wild sunflower species measured in a common garden experiment. Number of individuals: n = 612 ( H. annuus ); n = 161 ( H. petiolaris petiolaris ); n = 211 ( H. petiolaris fallax ); n = 48 ( H. niveus canescens ); n = 261 ( H. argophyllus 0/0); n = 25 ( H. argophyllus 0/1); n = 23 ( H. argophyllus 1/1). b , Leaf nitrogen content and carbon/nitrogen ratio GWAs in H. argophyllus (two-sided mixed model associations; n = 289 individuals). The purple lines represent 5% Bonferroni-corrected significance. Only positions with -log 10 P value >2 are plotted. c , Genotype presence or absence for the 130-135-Mbp region of chromosome 6 in H. argophyllus . The x -axis represents consecutive SNP positions; distances on this axis are therefore not proportional to physical distances on the chromosome. Purple bars highlight the positions of the five HaFT genes in the region (Ha FT5 and Ha FT6 are only a few hundred bp apart). Flowering time data are the same as used in GWA analyses. d , Ha FT1 and Ha FT2 expression levels in mature leaves or shoot apices of >6-month-old, flowering H. argophyllus plants, grown in a greenhouse in long days conditions (14 h light:10 h dark). This experiment was performed on two independent pairs of individuals, with similar results. e , Six-week-old A. thaliana plants grown in long day conditions at 23 °C. At least 19 independent transgenic events were analysed for each construct in each genetic background, and flowering time was consistent within each group. Scale bar,CC-BY · From the PDF
Extended Data Fig. 3 | Several haploblocks differentiate dune and non-dune populations of H. petiolaris . a , Correlation between seed size and flowering time. Although dune-adapted H. petiolaris fallax flowers later and has larger seeds than non-dune-adapted populations, these two traits generally show no correlation, or a weak negative correlation, in H. annuus and H. petiolaris . Purple lines represent linear regressions, shaded grey area are 95% confidence intervals. H. annuus : n = 426 individuals, one-sided F 1,423 = 1.831, P = 0.18; H. petiolaris : n = 307 individuals, one-sided F 1,305 = 9.841, P = 0.0019. b , Seed length GWA in H. petiolaris fallax (two-sided mixed model associations; n = 165 individuals). No significant association with haploblocks is found in GWA analyses for seed width (not shown). c , F ST values in 2-Mbp non-overlapping sliding windows for comparisons between dune- and non-dune-adapted populations of H. petiolaris fallax in Colorado. Purple bars represent predicted haploblocks. d , Flowering time (approximated as total leaf number (TLN) on the primary stem) GWA for H. petiolaris petiolaris (twosided mixed model associations; n = 160 individuals). The purple lines in b , d represent 5% Bonferroni-corrected significance. Only positions with -log10 P value >2 are plotted. e , Distribution of F ST values for SNPs and haploblocks in comparisons between dune- and non-dune-adapted populations of H. petiolaris fallax in Texas and Colorado 16 . Percentiles are reported for the most highly divergent haploblocks. Box plots show the median, box edges represent the 25th and 75th percentiles, whiskers represent the maximum and minimum data points within 1.5× interquartile range outside box edges. Number of individuals: n = 28 (Colorado); n = 54 (Texas). Number of SNPs: n = 1,196,399 (Colorado); n = 1,169,273 (Texas). f , Maximum-likelihood trees for two of the haploblocks segregating within H. petiolaris . Dune populations of H. petiolaris fallax are highlighted in light (Colorado) and dark tan (Texas). For pet09.01 and pet11.01, although both dune populations have converged on the same haplotype, the Texas haplotype is the ancestral H. petiolaris fallax copy, whereas in Colorado the haplotype is derived from introgression with H. petiolaris petiolaris , suggesting convergent adaptation. Bootstrap values for major nodes are reported (asterisks = 100).
Extended Data Fig. 3 | Several haploblocks differentiate dune and non-dune populations of H. petiolaris . a , Correlation between seed size and flowering time. Although dune-adapted H. petiolaris fallax flowers later and has larger seeds than non-dune-adapted populations, these two traits generally show no correlation, or a weak negative correlation, in H. annuus and H. petiolaris . Purple lines represent linear regressions, shaded grey area are 95% confidence intervals. H. annuus : n = 426 individuals, one-sided F 1,423 = 1.831, P = 0.18; H. petiolaris : n = 307 individuals, one-sided F 1,305 = 9.841, P = 0.0019. b , Seed length GWA in H. petiolaris fallax (two-sided mixed model associations; n = 165 individuals). No significant association with haploblocks is found in GWA analyses for seed width (not shown). c , F ST values in 2-Mbp non-overlapping sliding windows for comparisons between dune- and non-dune-adapted populations of H. petiolaris fallax in Colorado. Purple bars represent predicted haploblocks. d , Flowering time (approximated as total leaf number (TLN) on the primary stem) GWA for H. petiolaris petiolaris (twosided mixed model associations; n = 160 individuals). The purple lines in b , d represent 5% Bonferroni-corrected significance. Only positions with -log10 P value >2 are plotted. e , Distribution of F ST values for SNPs and haploblocks in comparisons between dune- and non-dune-adapted populations of H. petiolaris fallax in Texas and Colorado 16 . Percentiles are reported for the most highly divergent haploblocks. Box plots show the median, box edges represent the 25th and 75th percentiles, whiskers represent the maximum and minimum data points within 1.5× interquartile range outside box edges. Number of individuals: n = 28 (Colorado); n = 54 (Texas). Number of SNPs: n = 1,196,399 (Colorado); n = 1,169,273 (Texas). f , Maximum-likelihood trees for two of the haploblocks segregating within H. petiolaris . Dune populations of H. petiolaris fallax are highlighted in light (Colorado) and dark tan (Texas). For pet09.01 and pet11.01, although both dune populations have converged on the same haplotype, the Texas haplotype is the ancestral H. petiolaris fallax copy, whereas in Colorado the haplotype is derived from introgression with H. petiolaris petiolaris , suggesting convergent adaptation. Bootstrap values for major nodes are reported (asterisks = 100).CC-BY · From the PDF
Image 9
CC-BY · From the PDF
Image 10
CC-BY · From the PDF
Extended Data Fig. 6 | Comparisons between reference assemblies and genetic maps confirm structural rearrangements associated with haploblocks. a , Alignment of chromosome 1 for the H. annuus genome assemblies PSC8 and HA412-HOv2. The ann01.01 region (at about 8 Mpb; inset), for which the two cultivars have different haplotypes, shows inverted alignment. b , Three H. annuus genetic maps (constructed using F 2 populations between wild individuals and the HA412-HO cultivar). c , Four genetic maps (constructed using F 1 populations. From top to bottom: H. petiolaris petiolaris , H. petiolaris fallax 87 , newly constructed dune H. petiolaris fallax and newly constructed non-dune H. petiolaris fallax 88 ) are plotted relative to the HA412-HOv2 reference assembly. To the right of each dot plot, markers are plotted in the order in which they appear in each genetic map. Haploblock regions and the markers that fall within them are highlighted in purple. Circled haploblock regions show evidence of different orientations across the multiple
Extended Data Fig. 6 | Comparisons between reference assemblies and genetic maps confirm structural rearrangements associated with haploblocks. a , Alignment of chromosome 1 for the H. annuus genome assemblies PSC8 and HA412-HOv2. The ann01.01 region (at about 8 Mpb; inset), for which the two cultivars have different haplotypes, shows inverted alignment. b , Three H. annuus genetic maps (constructed using F 2 populations between wild individuals and the HA412-HO cultivar). c , Four genetic maps (constructed using F 1 populations. From top to bottom: H. petiolaris petiolaris , H. petiolaris fallax 87 , newly constructed dune H. petiolaris fallax and newly constructed non-dune H. petiolaris fallax 88 ) are plotted relative to the HA412-HOv2 reference assembly. To the right of each dot plot, markers are plotted in the order in which they appear in each genetic map. Haploblock regions and the markers that fall within them are highlighted in purple. Circled haploblock regions show evidence of different orientations across the multipleCC-BY · From the PDF
Image 12
CC-BY · From the PDF
Image 13
CC-BY · From the PDF
Image 14
CC-BY · From the PDF
Image 15
CC-BY · From the PDF

Verification

Claims the paper makes

The claims and statistics of this paper haven’t been checked yet.

Free: it reads the open-access text and checks the first 5 claims that cite a source we can check. Create a free account to check every claim.

A few free checks a day · papers already verified open instantly · results are public

Claims other papers make about this one

Each is checked against this paper’s own text: does it say what the citing paper says it does?

1 more claim about this paper

Create a free account to see every claim other papers make about this one.

See all claims — free account

Self-check

Percentages, sums and reported differences re-computed from the paper’s own numbers.

The self-check needs the paper’s full text.

Citations

Cites

Show all 94 references

Research works printed but not linked: 1

  1. Heiser, C. B. Three new annual sunflowers (Helianthus) from the southwestern United States. Rhodora 60, 272–283 (1958).

Cited by

See all 516

Metadata

Authors
Todesco, M., Owens, G. L., Bercovich, N., Légaré, J.-S., Soudi, S., Burge, D. O., Huang, K., Ostevik, K. L., Drummond, E. B. M., Imerovski, I., Lande, K., Pascual-Robles, M. A., Nanavati, M., Jahani, M., Cheung, W., Staton, S. E., Muños, S., Nielsen, R., Donovan, L. A., Burke, J. M., Yeaman, S., & Rieseberg, L. H.
Affiliations
  • University of British Columbia (CA)
  • University of Calgary (CA)
  • Centre National de la Recherche Scientifique (FR)
  • University of California, Berkeley (US)
  • University of Georgia (US)
Corresponding author
  • Bercovich, Natalia
  • Rieseberg, Loren H.
Venue
Nature
Published
2020-07-08
Volume
584
Issue
7822
Pages
602-607
ISSN
  • 0028-0836 (ISSN-L)
  • 1476-4687
OpenAlex
W3041530105
Cited by
513
References
94
Citations by year
2026: 60 · 2025: 85 · 2024: 80 · 2023: 93 · 2022: 98 · 2021: 65 · 2020: 28
FWCI
46.03
Type
journal article
Language
en
Open access
Licence
Locations
  • Nature (publishedVersion, cc-by)
  • bioRxiv (Cold Spring Harbor Laboratory) (acceptedVersion)
  • PubMed (publishedVersion)
  • HAL (submittedVersion, cc-by-nc-nd)
  • HAL (submittedVersion, other-oa)
  • HAL (submittedVersion)
  • RePEc: Research Papers in Economics (submittedVersion)
  • eScholarship (California Digital Library) (submittedVersion, cc-by-nc-nd)
Funders
  • National Science Foundation (1444522)
  • Genome Canada (LSARP2014-223SUN)
  • Compute Canada
  • Genome British Columbia (LSARP2014‐223SUN, 223SUN)
Topics
  • Life Sciences › Agricultural and Biological Sciences › Plant Science › Sunflower and Safflower Cultivation
  • Life Sciences › Biochemistry, Genetics and Molecular Biology › Genetics › Chromosomal and Genetic Variations
  • Life Sciences › Biochemistry, Genetics and Molecular Biology › Genetics › Genetic Mapping and Diversity in Plants and Animals
Keywords
ecotypic differentiation, sunflower, Helianthus petiolaris, Helianthus argophyllus, structural variants, introgression, flowering time, FLOWERING LOCUS T, seed size, soil fertility, adaptive alleles, hybridization
MeSH terms
Acclimatization, Alleles, Haplotypes, Helianthus, Phylogeny, Seeds, Flowers, Ecotype

About these checks

Registry, retraction, Cites and statistics results are computed, not judged, with one exception: a printed reference that no index lists is read once by a model before it counts as a citation error. Claims are extracted by a model and kept only when their quote appears verbatim in the text; each cited source is then checked, with a model’s help, for whether it says what the claim relies on. Those verdicts can be wrong — read the claim’s quote and the cited source before relying on one.

Statistics and arithmetic are recomputed, not judged.

Confidence bands are shown only for fields calibrated on our annotated test set. None is calibrated yet, so no band is shown.

What counts as a claim ›How we measure confidence ›How we check this ›

Are you an author, or do you see a problem with this page? Request a review

How to cite

Cite CoChat for the checks on this page, and the paper for its own findings.

This page
CoChat. (2026). Citation check: Massive haplotypes underlie ecotypic differentiation in sunflowers. https://app.cochat.ai/papers/10.1038/s41586-020-2467-6
The paper
Todesco, M., Owens, G. L., Bercovich, N., Légaré, J.-S., Soudi, S., Burge, D. O., Huang, K., Ostevik, K. L., Drummond, E. B. M., Imerovski, I., Lande, K., Pascual-Robles, M. A., Nanavati, M., Jahani, M., Cheung, W., Staton, S. E., Muños, S., Nielsen, R., Donovan, L. A., . . . Rieseberg, L. H. (2020). Massive haplotypes underlie ecotypic differentiation in sunflowers. Nature. https://doi.org/10.1038/s41586-020-2467-6

Data sources

Bibliographic data: Semantic Scholar, OpenAlex, Crossref.

Contains information from the Semantic Scholar Academic Graph Datasets, made available under the ODC Attribution License (ODC-BY 1.0).

Semantic Scholar’s data is described in: Kinney, R., et al. (2023). The Semantic Scholar Open Data Platform. arXiv:2301.10140.