

The DOI matches its Crossref record; 64 of the 64 references it cites were found in a registry or an index.
Global reference mapping of human transcription factor footprints
Open accessPublished version of a preprint
Abstract
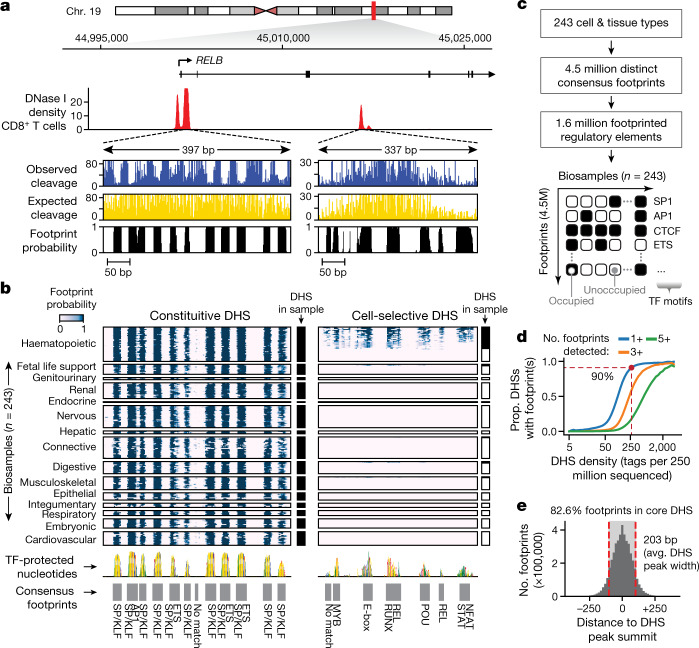
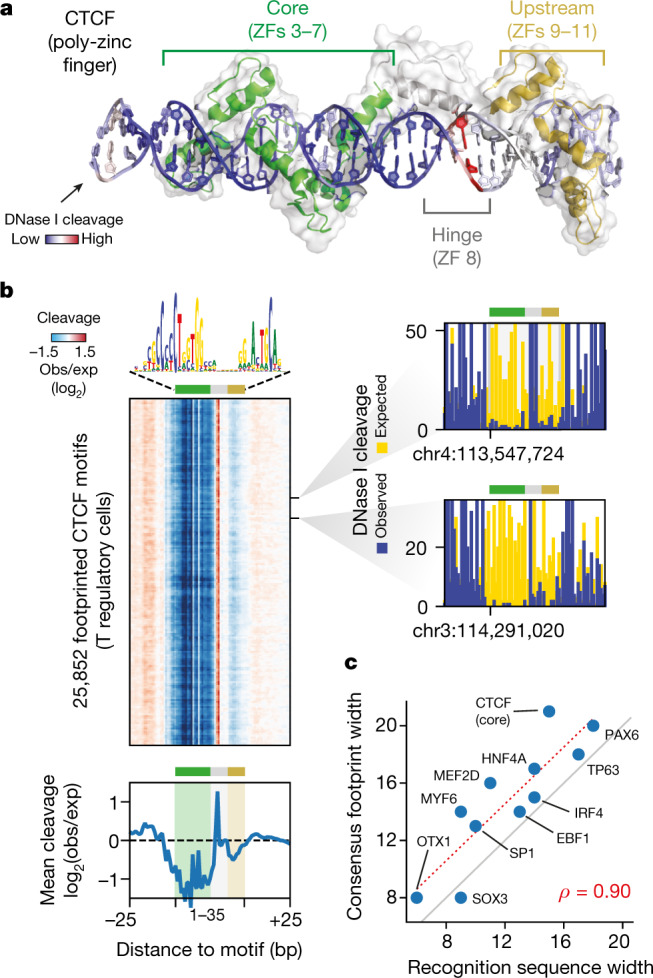
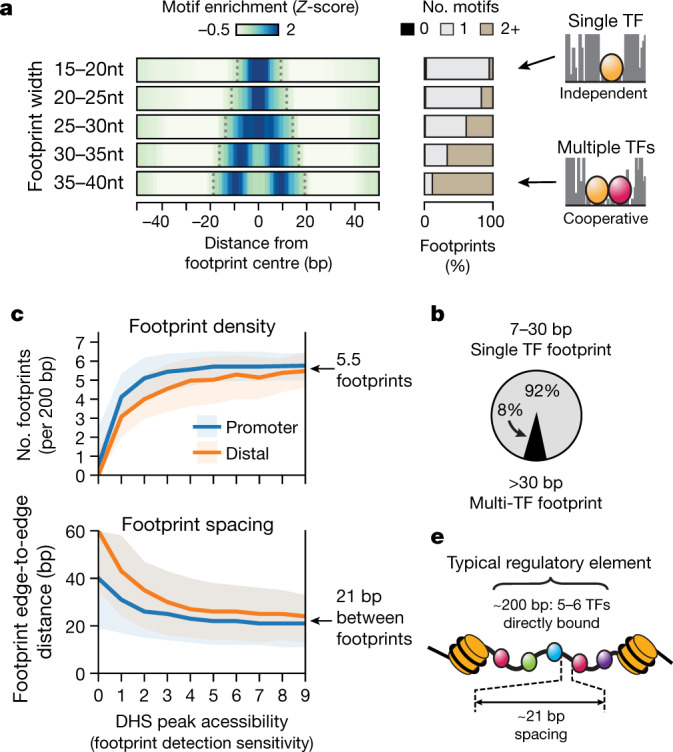
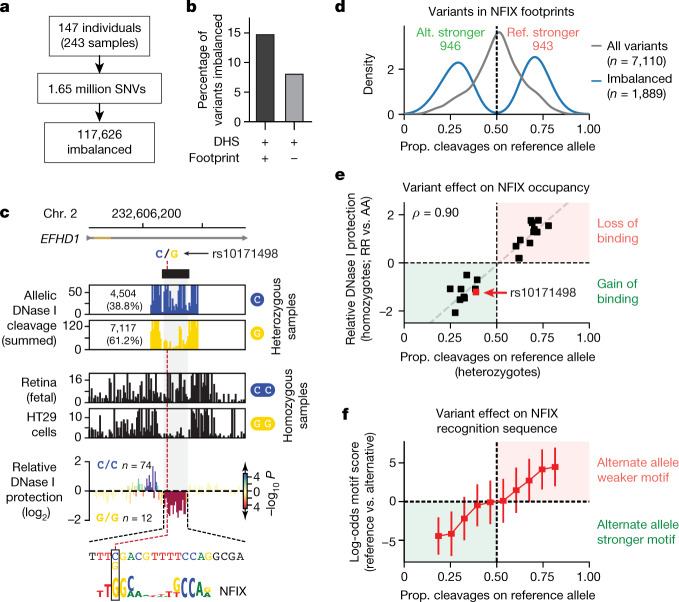
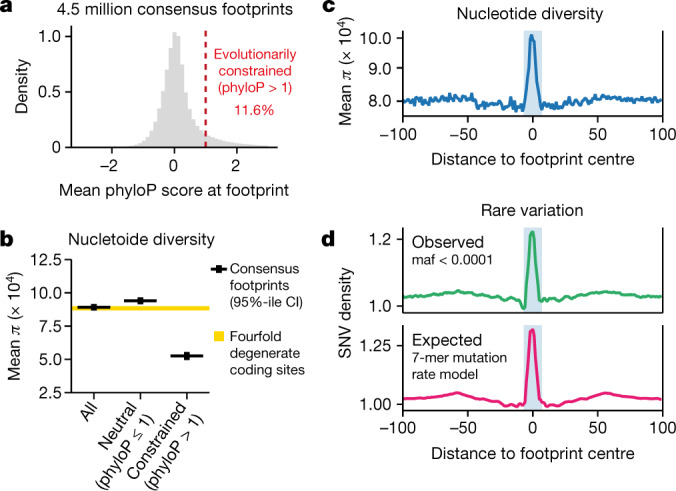
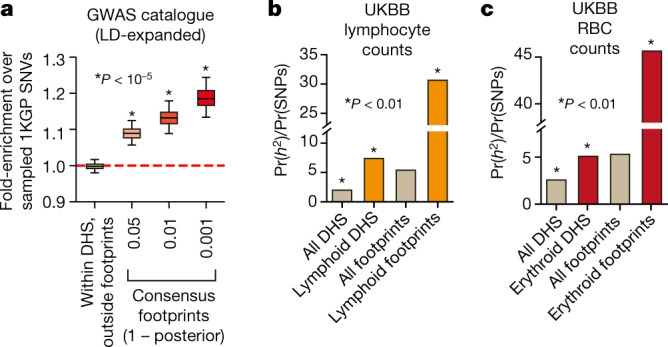
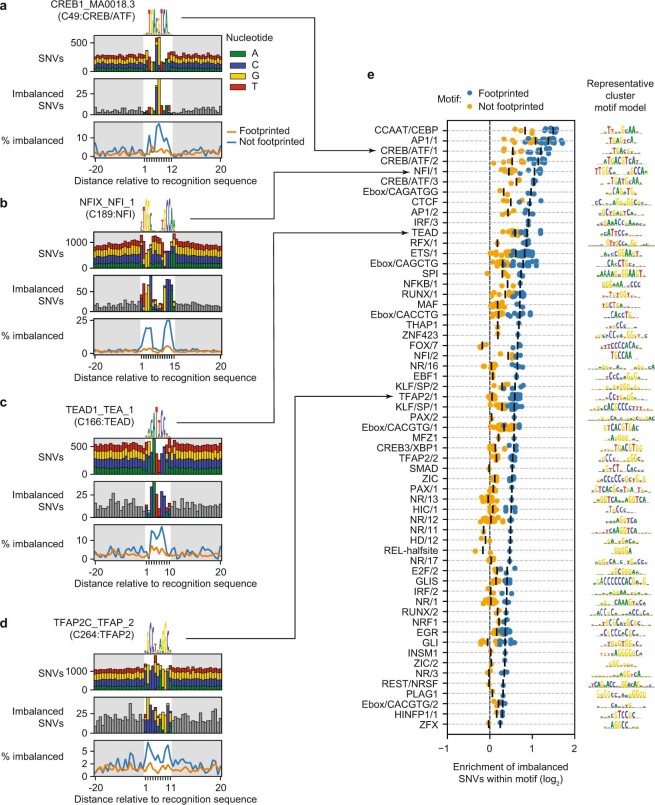
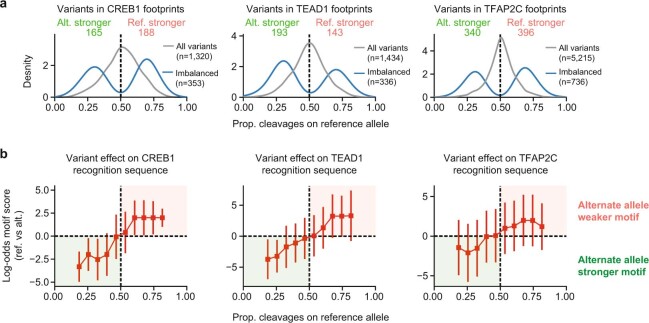
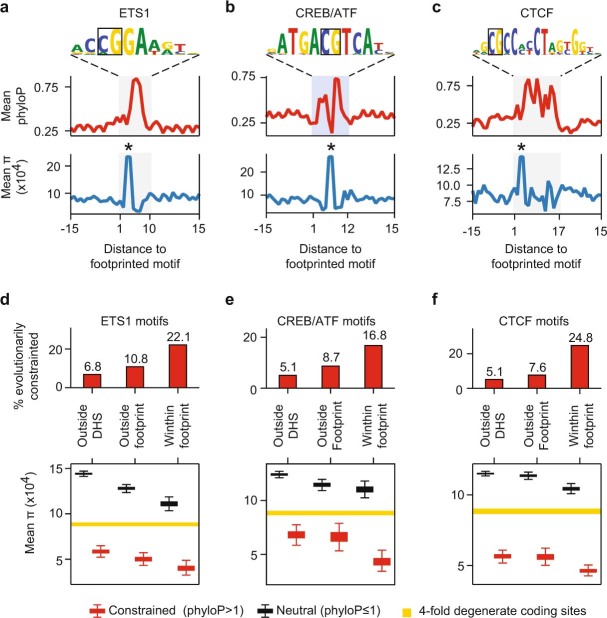
Abstract Combinatorial binding of transcription factors to regulatory DNA underpins gene regulation in all organisms. Genetic variation in regulatory regions has been connected with diseases and diverse phenotypic traits 1 , yet it remains challenging to distinguish variants that impact regulatory function 2 . Genomic DNase I footprinting enables quantitative, nucleotide-resolution delineation of sites of transcription factor occupancy within native chromatin 3–5 . However, to date only a small fraction of such sites have been precisely resolved on the human genome sequence 5 . To enable comprehensive mapping of transcription factor footprints, we produced high-density DNase I cleavage maps from 243 human cell and tissue types and states and integrated these data to delineate at nucleotide resolution ~4.5 million compact genomic elements encoding transcription factor occupancy. We map the fine-scale structure of ~1.6 million DHS and show that the overwhelming majority is populated by well-spaced sites of single transcription factor:DNA interaction. Cell context-dependent cis-regulation is chiefly executed by wholesale actuation of accessibility at regulatory DNA versus by differential transcription factor occupancy within accessible elements. We show further that the well-described enrichment of disease- and phenotypic trait-associated genetic variants in regulatory regions 1,6 is almost entirely attributable to variants localizing within footprints, and that functional variants impacting transcription factor occupancy are nearly evenly partitioned between loss- and gain-of-function alleles. Unexpectedly, we find that the global density of human genetic variation is markedly increased within transcription factor footprints, revealing an unappreciated driver of cis-regulatory evolution. Our results provide a new framework for both global and nucleotide-precision analyses of gene regulatory mechanisms and functional genetic variation.
Overview
The claims and statistics of this paper haven’t been checked yet.
Run the check — free, no account needed. It reads the open-access text and checks the sources it cites.
Integrity signals
Registry
Cites
Statistics
Figures
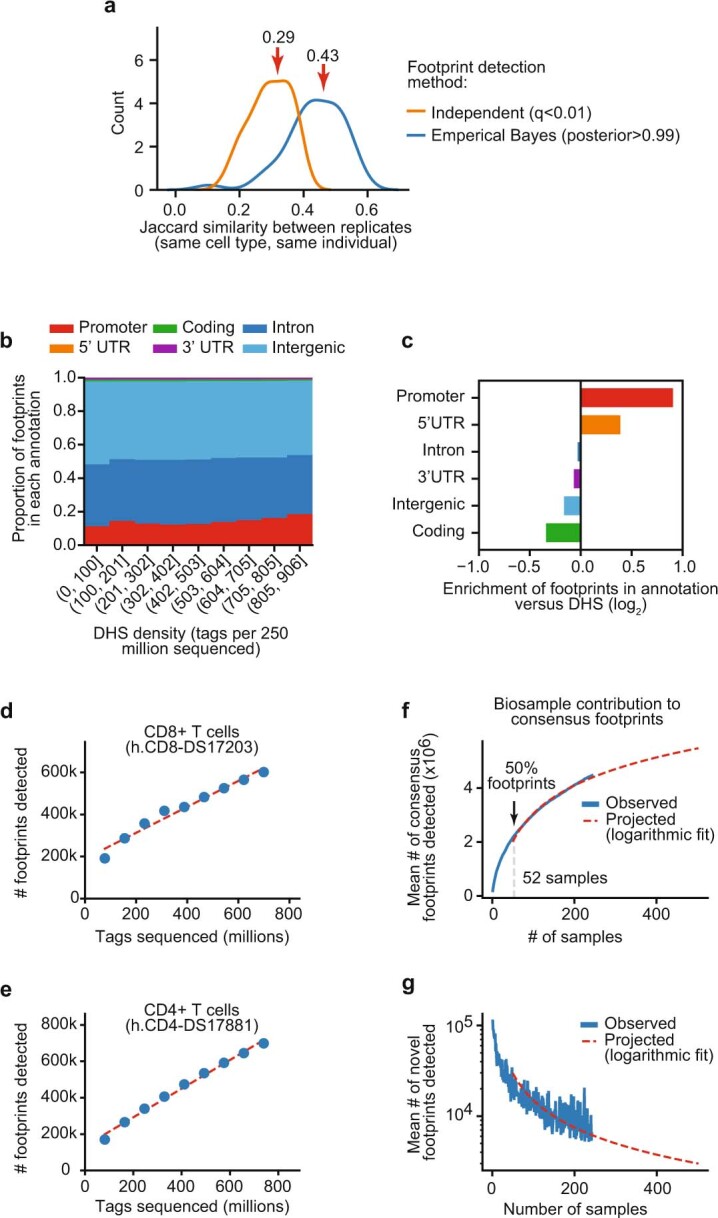
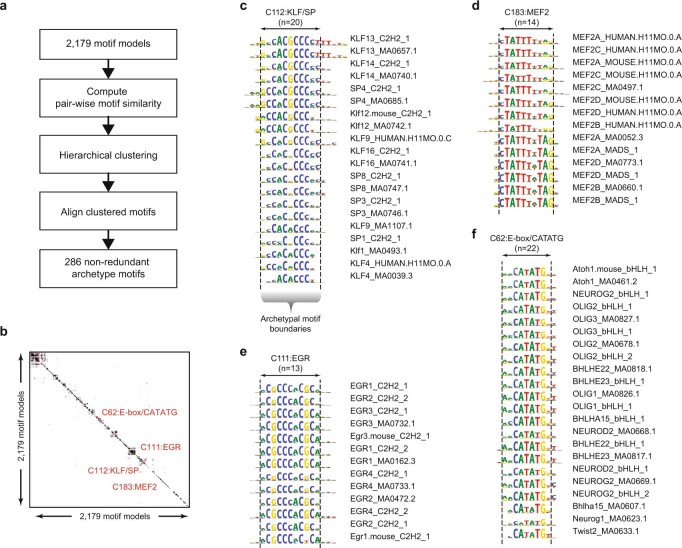
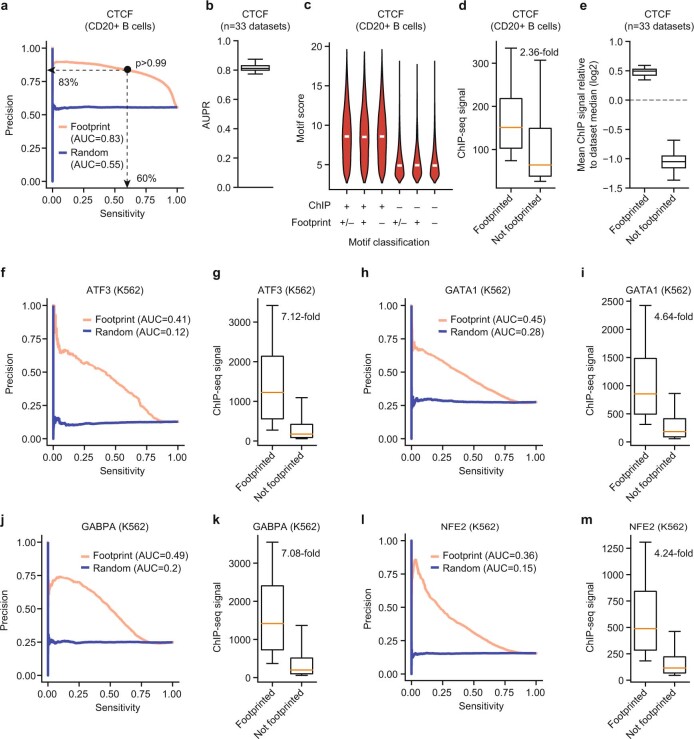
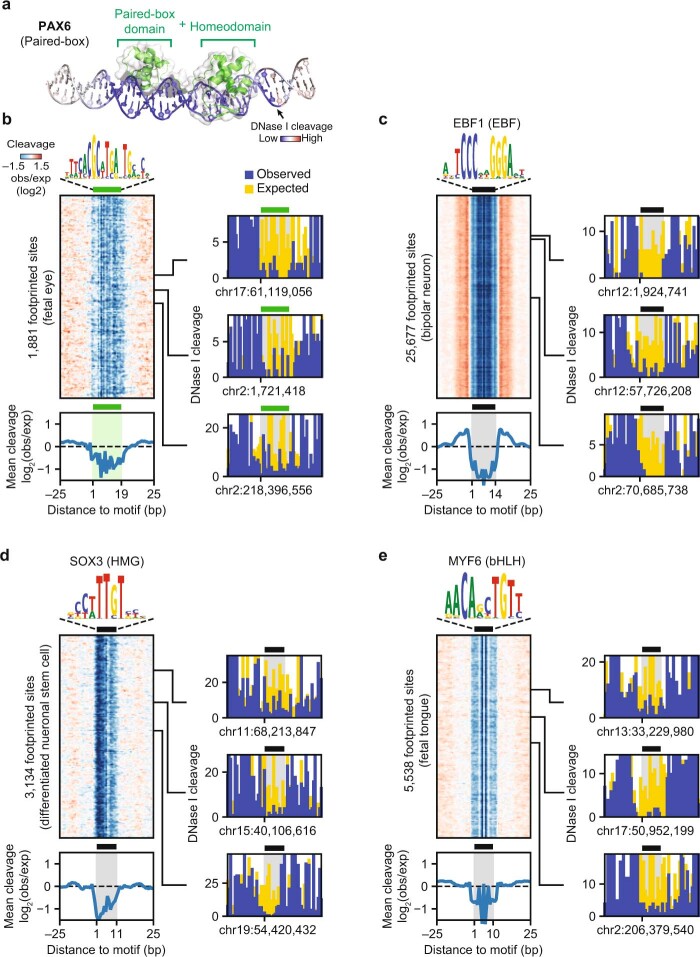
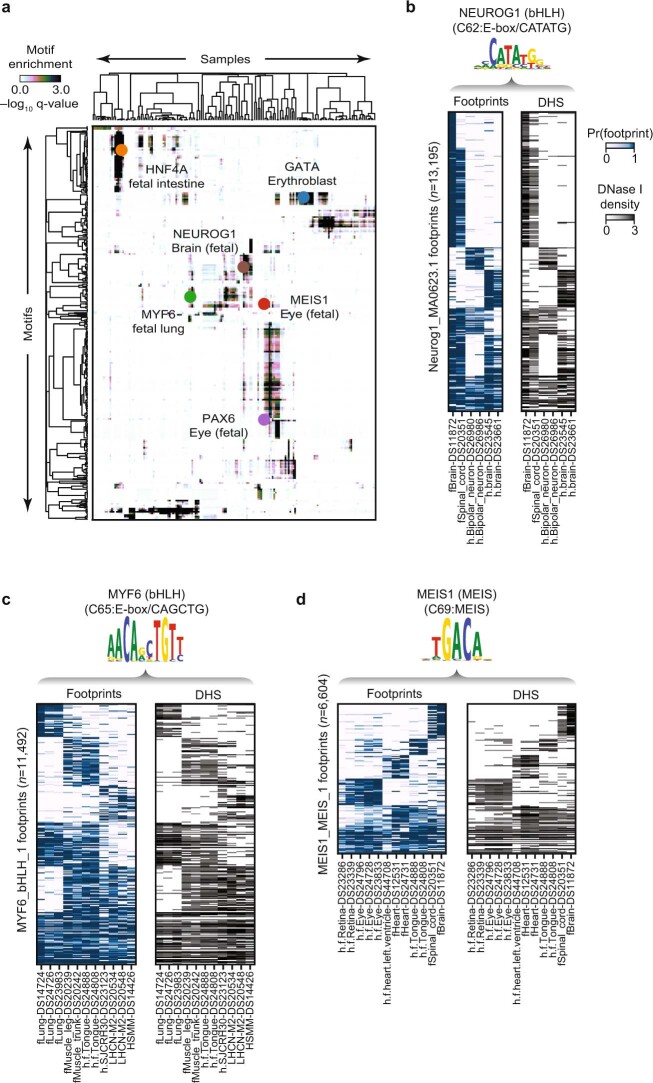
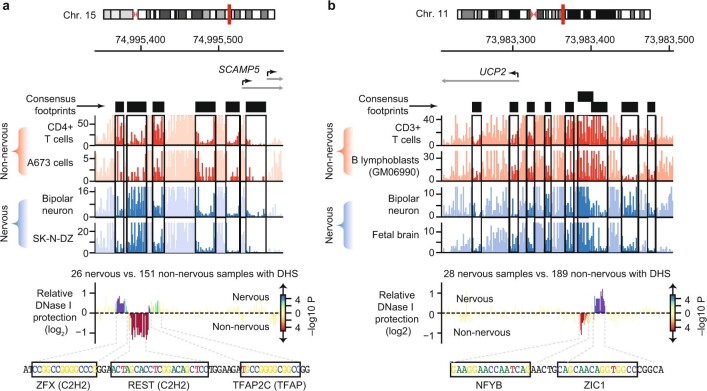
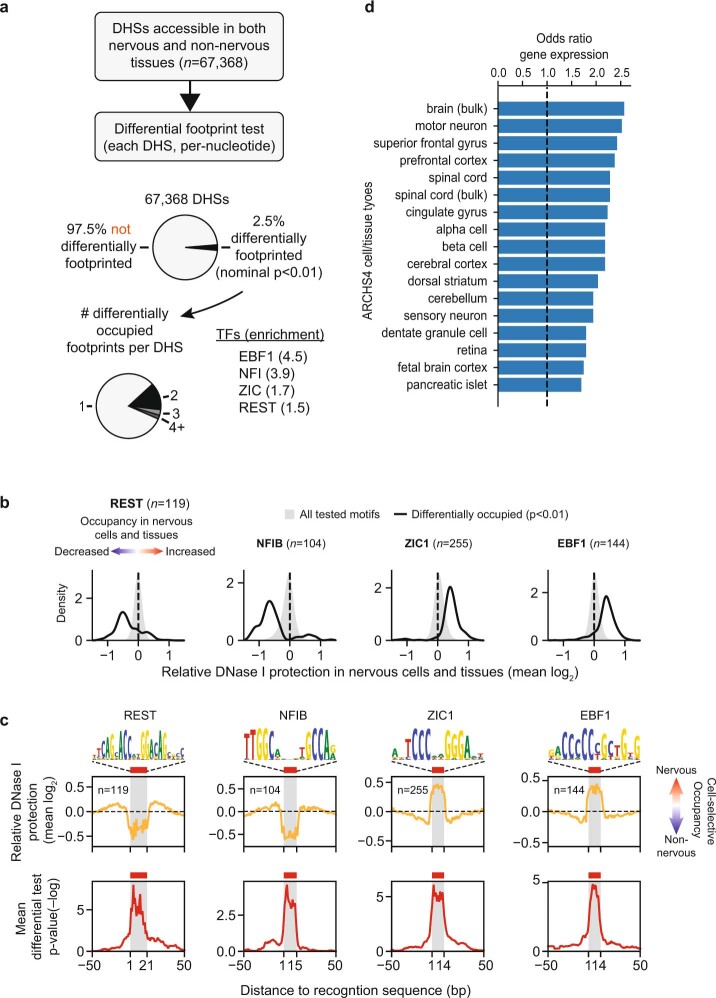
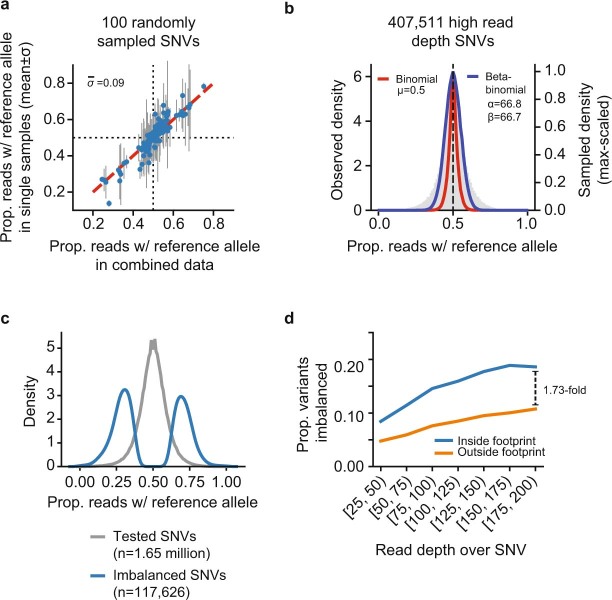
Verification
Claims the paper makes
The claims and statistics of this paper haven’t been checked yet.
Run the check — free, no account needed. It reads the open-access text and checks the sources it cites.
Claims other papers make about this one
Each is checked against this paper’s own text: does it say what the citing paper says it does?
The source backs part of the claim, not all of it — or backs it for a different population, condition or comparison.
In the citing paper
“In some cases, we found statistically weak evidence for stronger correlations with other factors from the same motif family,45 e.g., the activity of enhancers with Gfi1 sites was correlated with the expression of Gfi1b (Figure S3C).”
From Design principles of cell-state-specific enhancers in hematopoiesis (2025) · cites this paper as [45]
Experimental — accuracy not yet measured
Self-check
Percentages, sums and reported differences re-computed from the paper’s own numbers.
The self-check needs the paper’s full text.
Citations
Cites
A global reference for human genetic variation
The 1000 Genomes Project Consortium, authors, C., Auton, A., Abecasis, G. R., Steering committee, Altshuler, D. M., Durbin, R. M., Abecasis, G. R., Bentley, D. R., Chakravarti, A., et al. (2015) · Nature · doi:10.1038/nature15393 · Cited by 18,247
An integrated encyclopedia of DNA elements in the human genome
The ENCODE Project Consortium (2012) · Nature · doi:10.1038/nature11247 · Cited by 18,072
A map of human genome variation from population-scale sequencing.
The 1000 Genomes Project Consortium (2010) · Nature · doi:10.1038/nature09534 · Cited by 7,877
Integrative analysis of 111 reference human epigenomes
Roadmap Epigenomics Consortium, Kundaje, A., Meuleman, W., Ernst, J., Bilenky, M., Yen, A., Heravi-Moussavi, A., Kheradpour, P., Zhang, Z., Wang, J., et al. (2015) · Nature · doi:10.1038/nature14248 · Cited by 6,368
LD Score regression distinguishes confounding from polygenicity in genome-wide association studies
Schizophrenia Working Group of the Psychiatric Genomics Consortium, Bulik-Sullivan, B. K., Loh, P.-R., Finucane, H. K., Ripke, S., Yang, J., Patterson, N., Daly, M. J., Price, A. L., & Neale, B. M. (2015) · Nature Genetics · doi:10.1038/ng.3211 · Cited by 5,559
Buniello, A., MacArthur, J. A. L., Cerezo, M., Harris, L. W., Hayhurst, J., Malangone, C., McMahon, A., Morales, J., Mountjoy, E., Sollis, E., et al. (2019) · Nucleic Acids Research · doi:10.1093/nar/gky1120 · Cited by 4,000
Systematic Localization of Common Disease-Associated Variation in Regulatory DNA
Maurano, M. T., Humbert, R., Rynes, E., Thurman, R. E., Haugen, E., Wang, H., Reynolds, A. P., Sandstrom, R., Qu, H., Brody, J., et al. (2012) · Science · doi:10.1126/science.1222794 · Cited by 3,716
Self-citationThe Human Transcription Factors
Lambert, S. A., Jolma, A., Campitelli, L. F., Das, P. K., Yin, Y., Albu, M., Chen, X., Taipale, J., Hughes, T. R., & Weirauch, M. T. (2018) · Cell · doi:10.1016/j.cell.2018.01.029 · Cited by 3,399
The accessible chromatin landscape of the human genome
Thurman, R. E., Rynes, E., Humbert, R., Vierstra, J., Maurano, M. T., Haugen, E., Sheffield, N. C., Stergachis, A. B., Wang, H., Vernot, B., et al. (2012) · Nature · doi:10.1038/nature11232 · Cited by 2,679
Self-citationPartitioning heritability by functional annotation using genome-wide association summary statistics
ReproGen Consortium, Finucane, H. K., Schizophrenia Working Group of the Psychiatric Genomics Consortium, The RACI Consortium, Bulik-Sullivan, B., Gusev, A., Trynka, G., Reshef, Y., Loh, P.-R., Anttila, V., et al. (2015) · Nature Genetics · doi:10.1038/ng.3404 · Cited by 2,604
Cited by
Sorted by citations
Items 301–394 of 394
Regulation of stereotypic chromatin conformations at enhancers by CLOCK:BMAL1Preprint
Nie, X. Y., Ahuja, N., Hsieh, A., Abbi, G., Jiang, Y., & Menet, J. S. (2024) · bioRxiv (Cold Spring Harbor Laboratory) · doi:10.1101/2024.04.24.590818 · Cited by 1
“Because the footprint that TFs occupy on DNA is much smaller than the footprint of the histone octamer (usually 30 bp vs 147 bp) 14 , binding of a TF on DNA can not only inhibit nucleosome compaction, but also facilitate the binding of other TFs at nearby locations 6,12,15-20 .”
BackgroundFunctional characteristics and computational model of abundant hyperactive loci in the human genomePreprint
Hudaiberdiev, S., & Ovcharenko, I. (2024) · eLife · doi:10.7554/elife.95170.2 · Cited by 1
Heterochromatin fidelity is a therapeutic vulnerability in lymphoma and other human cancersPreprint
Najia, M. A. T., Jha, D. K., Zhang, C., Laurent, B., Kubaczka, C., Markel, A., Li, C., Morris, V., Tompkins, A., Hensch, L. T., et al. (2025) · bioRxiv (Cold Spring Harbor Laboratory) · doi:10.1101/2025.01.31.635709 · Cited by 1
Butts, J. C., Rong, S., Gosai, S. J., Castro, R. I., Noon, M., Adeniran, K., Ghosh, R., Sabeti, P. C., Tewhey, R., & Reilly, S. K. (2025) · bioRxiv (Cold Spring Harbor Laboratory) · doi:10.1101/2025.04.16.648420 · Cited by 3
Global cis-regulatory landscape of double-stranded DNA virusesPreprint
Taslim, T. H., Finkelberg, J. A., Kales, S., Soto-Ugaldi, L. F., D’Elia, B., Engin, B., Muñoz-Esquivel, G. D., Morara, E., Purinton, J., Chandok, H., et al. (2025) · bioRxiv (Cold Spring Harbor Laboratory) · doi:10.1101/2025.07.20.665756 · Cited by 1
Disease-associated genetic variants can cause mutations in tissue-specific protein isoformsPreprint
Weykopf, G., Badonyi, M., Friman, E. T., Nguyen, J. M. H., Ioannou, A., Livesey, B., Coutts, A. A., Hird, E. F., Wham, M., Stanton, C. M., et al. (2025) · bioRxiv (Cold Spring Harbor Laboratory) · doi:10.1101/2025.07.24.666385 · Cited by 1
Everitt, A., Whalen, S., & Pollard, K. S. (2025) · bioRxiv (Cold Spring Harbor Laboratory) · doi:10.1101/2025.08.07.669008 · Cited by 1
“Consistent with prior work 13,18,40,41 , we observed performance dips around 100 million reads in both our consistency and equivalency analyses.”
Gündüz, I. B., Wei, B., Chen, D. C., Wang, W., Hariharan, M., Norell, T., Broderick, T. J., McClain, M. T., Satterwhite, L. L., Burke, T. W., et al. (2025) · bioRxiv (Cold Spring Harbor Laboratory) · doi:10.1101/2025.09.09.675101 · Cited by 1
Predictive design of tissue-specific mammalian enhancers that function in vivo in the mouse embryoPreprint
Chen, S., Loubière, V., Hollingsworth, E. W., Jacinto, S. H., Dizehchi, A., Schreiber, J. M., Kvon, E. Z., & Stark, A. (2025) · bioRxiv (Cold Spring Harbor Laboratory) · doi:10.64898/2025.12.22.695948 · Cited by 1
Tiusanen, V., Patel, D., Xia, J., Xu, C., Datta, S., Yun, J. W., Cancellieri, S., Fei, L., Yilmaz, M., Pitkänen, E., et al. (2026) · bioRxiv (Cold Spring Harbor Laboratory) · doi:10.64898/2026.01.23.701252 · Cited by 1
Multi-scale dissection, compaction and derivatization of mammalian developmental enhancersPreprint
Lalanne, J., Li, T., Kajiwara, E. A. N., Huynh, C., Do, T. V., Martin, B. K., Regalado, S. G., & Shendure, J. (2026) · bioRxiv (Cold Spring Harbor Laboratory) · doi:10.64898/2026.04.20.719625 · Cited by 1
Moribe, F., Iskar, M., Durdu, S., Wirbelauer, C., Hoerner, L., Smallwood, S., Burger, L., & Schübeler, D. (2026) · bioRxiv (Cold Spring Harbor Laboratory) · doi:10.64898/2026.05.04.722487 · Cited by 3
Schaper, C. D. (2020) · Preprints.org · doi:10.20944/preprints202009.0300.v1
“It is acknowledged that the mapping of transcription factor proteins is difficult to understand under consensus transcription theories [18, 19, 20, 21, 22].”
BackgroundHigh-dimensional association detection in large scale genomic dataPreprint
Koch, H., Keller, C. A., Xiang, G., Giardine, B. M., Zhang, F., Wang, Y., Hardison, R. C., & Li, Q. (2020) · bioRxiv (Cold Spring Harbor Laboratory) · doi:10.1101/2020.11.18.388504
“42 studied functional changes in regulation by TFs using TF footprinting data.”
Methodde Bellefon, S. M., Thibord, F., Auer, P. L., Blangero, J., Coban‐Akdemir, Z., Floyd, J. S., Fornage, M., Johnsen, J. M., Lange, L. A., Lewis, J. P., et al. (2020) · bioRxiv (Cold Spring Harbor Laboratory) · doi:10.1101/2020.11.23.394296
Detecting Differential Transcription Factor Binding Based on DNA Accessibility
Lin, J. Y., & Jones, T. R. (2020) · IEEE MIT Undergraduate Research Technology Conference (URTC) · doi:10.1109/urtc51696.2020.9668911
Planell, N., Martinez‐de‐Morentin, X., Mouzo, D., Lara‐Astiaso, D., Vilas‐Zornoza, A., Martín‐Úriz, P. S., Alignani, D., Paiva, B., Maillo, A., Kurowska, A. K., et al. (2023) · bioRxiv (Cold Spring Harbor Laboratory) · doi:10.1101/2023.07.01.547234
Peña-Martínez, E. G., Pomales-Matos, D. A., Rivera-Madera, A., Messon-Bird, J. L., Medina-Feliciano, J. G., Sanabria-Alberto, L., Barreiro-Rosario, A. C., Rodríguez-Ríos, J. M., & Rodríguez‐Martínez, J. A. (2023) · medRxiv · doi:10.1101/2023.09.01.23294951
ProA and ProB repeat sequences shape 3D genome organization in eukaryotesPreprint
Bonnet, K., Hulo, N., Mourad, R., Ewing, A. D., Croce, O., Naville, M., Vassetzky, N. S., Gilson, É., Picard, D., & Fourel, G. (2023) · bioRxiv (Cold Spring Harbor Laboratory) · doi:10.1101/2023.10.27.564043
Causal Effects of 1400 Blood Metabolites And Sleep Disorders: A Mendelian Randomization StudyPreprint
Ma, Z., min, Z., Zhao, H., & Qu, N. (2024) · Research Square · doi:10.21203/rs.3.rs-3914147/v1
Gao, P., Lyu, Q., Ghanam, A. R., Lazzarotto, C. R., Newby, G. A., Zhang, W., Choi, M., Slivano, O. J., Holden, K., Walker, J. A., et al. (2021) · Figshare · doi:10.6084/m9.figshare.14220663
Wuputra, K., Tsai, M.-H., Kato, K., Ku, C., Pan, J.-B., Yang, Y.-H., Saito, S., Wu, C., Lin, Y., Cheng, K., et al. (2023) · Figshare · doi:10.6084/m9.figshare.23993127
Gao, P., Lyu, Q., Ghanam, A. R., Lazzarotto, C. R., Newby, G. A., Zhang, W., Choi, M., Slivano, O. J., Holden, K., Walker, J. A., et al. (2021) · Figshare · doi:10.6084/m9.figshare.14220669
Gao, P., Lyu, Q., Ghanam, A. R., Lazzarotto, C. R., Newby, G. A., Zhang, W., Choi, M., Slivano, O. J., Holden, K., Walker, J. A., et al. (2021) · Figshare · doi:10.6084/m9.figshare.14220666
Gao, P., Lyu, Q., Ghanam, A. R., Lazzarotto, C. R., Newby, G. A., Zhang, W., Choi, M., Slivano, O. J., Holden, K., Walker, J. A., et al. (2021) · Figshare · doi:10.6084/m9.figshare.14220660
Gao, P., Lyu, Q., Ghanam, A. R., Lazzarotto, C. R., Newby, G. A., Zhang, W., Choi, M., Slivano, O. J., Holden, K., Walker, J. A., et al. (2021) · Figshare · doi:10.6084/m9.figshare.14220651
Gao, P., Lyu, Q., Ghanam, A. R., Lazzarotto, C. R., Newby, G. A., Zhang, W., Choi, M., Slivano, O. J., Holden, K., Walker, J. A., et al. (2021) · Figshare · doi:10.6084/m9.figshare.14220657
Gao, P., Lyu, Q., Ghanam, A. R., Lazzarotto, C. R., Newby, G. A., Zhang, W., Choi, M., Slivano, O. J., Holden, K., Walker, J. A., et al. (2021) · Figshare · doi:10.6084/m9.figshare.14220654
Sequence characteristics and an accurate model of abundant hyperactive loci in the human genomePreprint
Hudaiberdiev, S., & Ovcharenko, I. (2024) · eLife · doi:10.7554/elife.95170.1
Cafaro, C., Ali, Z., Arrizabalaga, A. L., Bello, D. T. D., Duran-Lozano, L., Ekdahl, L., Thodberg, M., Pertesi, M., Portilla, A. L. D. L., & Nilsson, B. (2024) · Haematologica · doi:10.3324/haematol.2024.285363
“2c ) 10 .”
Isoform and pathway-specific regulation of post-transcriptional RNA processing in human cellsPreprint
Bedi, K., Magnuson, B., Narayanan, I. V., McShane, A., Ashaka, M., Paulsen, M. T., Wilson, T. E., & Ljungman, M. E. (2024) · bioRxiv (Cold Spring Harbor Laboratory) · doi:10.1101/2024.06.12.598705 · Cited by 1
Yuan, S., Ni, P., & Su, Z. (2024) · Research Square · doi:10.21203/rs.3.rs-4510188/v1
Baker, S. M., Mullan, A. F., Jennings, R. E., Hanley, K. P., Ang, Y. S., Palles, C., Hanley, N. A., & Sharrocks, A. D. (2024) · bioRxiv (Cold Spring Harbor Laboratory) · doi:10.1101/2024.07.25.605105
Causal role of immune cells in uveitis: a Mendelian randomization study
Pu, J., Zhao, Z., Duan, Y., Lü, J., Yao, Y., Wen, Y., Li, Y., Zhang, Y., & Ye, F. (2024) · Frontiers in Medicine · doi:10.3389/fmed.2024.1445775
“Summary statistics for all immunological features were acquired from the GWAS catalog (ranging from registration number GCST0001391 to GCST0002121) (20).”
BackgroundEmerging Technologies for Epigenetic Drug Discovery
(2024) · Royal Society of Chemistry eBooks · doi:10.1039/9781837674916-part2
A DNA base-specific sequence interposed between CRX and NRL contributes to RHODOPSIN expression
Maritato, R., Medugno, A., D’Andretta, E., Riso, G. D., Lupo, M., Botta, S., Marrocco, E., Renda, M., Sofia, M., Mussolino, C., et al. (2024) · Scientific Reports · doi:10.1038/s41598-024-76664-8
“TFBSs are short degenerate DNA sequences (also known as motifs) that occur as monomeric 11,12 , dimeric, and overlapping sequences embedded in cis -regulatory elements, so that the DNA context surrounding them can also influence how they are bound by TFs 13–18 .”
BackgroundComparative atlas of genome-wide chromatin-associated protein co-occupancyPreprint
White, S. M., Moyers, B. A., Wang, T., Mackiewicz, M., Weimer, A. K. K., Grubert, F., Ramalingam, V., Luo, J. X. J., Jiang, L., Shi, M., et al. (2024) · bioRxiv (Cold Spring Harbor Laboratory) · doi:10.1101/2024.12.17.628199 · Cited by 1
Firbas, P., Gonçalves, C. D. S. T., & de Polavieja, G. G. (2025) · bioRxiv (Cold Spring Harbor Laboratory) · doi:10.1101/2025.02.19.638643 · Cited by 1
Functional interrogation of candidate cis -regulatory elements at the LDLR locusPreprint
Leix, K., Serrano-Zayas, C., Graham, S. E., & Emmer, B. T. (2025) · bioRxiv (Cold Spring Harbor Laboratory) · doi:10.1101/2025.03.20.644385
Mononen, J., Taipale, M., Malinen, M., Levonen, A., Ruotsalainen, A., Norton, L., & Heikkinen, S. (2025) · bioRxiv (Cold Spring Harbor Laboratory) · doi:10.1101/2025.05.08.652810
“A recent study by Viestra et al. highlighted the usefulness of footprinting in identifying candidate rSNPs by showing that TF footprints were enriched for genetic variation compared to the rest of the non-coding genome [18].”
Wu, Q., Shao, W., Jia, Z., Li, Z., Zhao, Z., & Shi, W. (2025) · Journal of Reproductive Immunology · doi:10.1016/j.jri.2025.104551
Kim, D., Park, S., Kwon, Y.-R., Yoon, H., Cho, B., Baek, I., Kang, J. H., Park, T.-E., Corces, M., Kim, H.-J., et al. (2025) · iScience · doi:10.1016/j.isci.2025.113297 · Cited by 1
“…CD8 + T cells of responders and healthy con-trols—but not from non-responders—exhibited significant enrichment of TBX/EOMES-binding motifs (AC0489 42 ), indicating that TBX21-and EOMES-regulated pathways in CD8 + T cells may play a critical role in shaping the AZA response (Figure 2D),…”
p53motifDB: integration of genomic information and tumour suppressor p53 binding motifs
Baniulyte, G., Hicks, S. M., & Sammons, M. A. (2025) · Database · doi:10.1093/database/baaf053 · Cited by 1
“These data have been successfully integrated with TF binding information and other data sources, such as genetic variation and evolutionary conservation, to provide insight into the biological function and mechanisms of transcriptional regulatory regions [ 6 , 14 ].”
Sosa, E., O’Shea, D., Rosean, S., Yoon, C., Stauber, J., Castillo, P. E., Seoighe, C., Fazzari, M. J., & Greally, J. M. (2025) · medRxiv · doi:10.1101/2025.09.23.25336266
Evolution of chromatin accessibility associated with traits of cichlid phenotypic diversityPreprint
Mehta, T. K., Man, A., Etherington, G., Smith, A. M., Indermaur, A., Salzburger, W., Joyce, D. A., Palma, F. D., & Haerty, W. (2025) · bioRxiv (Cold Spring Harbor Laboratory) · doi:10.1101/2025.10.09.681187
Mapping transcription factor binding sites by learning UV damage fingerprints
Wilson, H. E., Stevison, S., Lamprey, L., & Wyrick, J. J. (2025) · Nucleic Acids Research · doi:10.1093/nar/gkaf1014
“…highly specific (i.e. “ChIP-grade”) antibodies, and typically can only measure the binding profile of a single protein at a time, highlighting the need for alternative methods to map cellular TFBS. TFBS have also been characterized by an orthogonal approach known as DNA footprinting [ 15 , 16 ].”
Robust footprinting with sample-specific Tn5 bias correction for bulk and single cell ATAC-seq
Lin, Y., Wang, H., Wilson, P. C., & Zhang, N. R. (2026) · Nature Communications · doi:10.1038/s41467-026-73164-3
“We further analyzed the composition of predicted footprints by measuring the proportion that overlapped with Decima attribution peaks and with DNase-seq footprints 30 (p-value = 0.05).”
InfluentialThe transcriptional regulatory circuit as a driver and therapeutic target in CML blast crisisPreprint
Jiang, L., Lou, E., Fang, J., Jiang, L., Peng, G., Chen, J., Liu, B., Lu, J., Meng, Y., Zhang, H., et al. (2025) · bioRxiv (Cold Spring Harbor Laboratory) · doi:10.1101/2025.11.02.686161
Kunzelman, G. W., Batistuzzo, A., & London, S. E. (2025) · Developmental Neurobiology · doi:10.1002/dneu.23017 · Cited by 1
Sharov, A. A. (2025) · bioRxiv (Cold Spring Harbor Laboratory) · doi:10.1101/2025.11.09.687492
Evo2HiC: a multimodal foundation model for integrative analysis of genome sequence and architecturePreprint
Fang, T., Li, Y., Xiao, Z., Xiao, Z., Hang, S., Murtaza, G., Yang, J., Xu, H., Jha, A., Noble, W. S., et al. (2025) · bioRxiv (Cold Spring Harbor Laboratory) · doi:10.1101/2025.11.18.689171 · Cited by 1
“We next obtained a precomputed, genome-wide catalog of motif matches [44].”
The architecture of allele-specific regulatory variant effects across five human genomesPreprint
Dura, K., Siklenka, K., Strouse, K., Morrow, S., Majoros, W., & Reddy, T. E. (2025) · bioRxiv · doi:10.1101/2025.11.22.689315
“Clustering together overlapping instances of highly similar motifs 22 , we arrived at a final test set of 207,556 instances of 168 motif clusters.”
Melody: Decoding the Sequence Determinants of Locus Specific DNA Methylation Across Human TissuesPreprint
Jin, J., Wang, D., Qiao, J., Gao, W., Liu, Y., Chen, S., Zou, Q., Wu, S., Su, R., & Wei, L. (2025) · bioRxiv (Cold Spring Harbor Laboratory) · doi:10.1101/2025.11.23.689975
Flipons: Biological roles of alternative nucleic acid conformations
Herbert, A. G. (2025) · Elsevier eBooks · doi:10.1016/b978-0-323-99507-8.00022-6
Global Evaluation of Congenital Heart Disease-Associated Non-Coding VariantsPreprint
Peña-Martínez, E. G., Peña-Martínez, E., Sharma, S., Medina-Feliciano, J., Root, E., Parks, L., Granitto, M., Pomales-Matos, D., Bird, J. M., Barreiro-Rosario, A., et al. (2025) · Research Square · doi:10.21203/rs.3.rs-8429365/v1
Patel, Z. M., & Hughes, T. R. (2021) · Figshare · doi:10.6084/m9.figshare.16767622
Additional file 1 of UniBind: maps of high-confidence direct TF-DNA interactions across nine species
Puig, R. R., Boddie, P., Khan, A., Castro-Mondragon, J. A., & Mathelier, A. (2021) · Figshare · doi:10.6084/m9.figshare.14853540
Hepkema, J., Lee, N. K., Stewart, B. J., Ruangroengkulrith, S., Charoensawan, V., Clatworthy, M. R., & Hemberg, M. (2023) · Figshare · doi:10.6084/m9.figshare.23962000
Gao, P., Lyu, Q., Ghanam, A. R., Lazzarotto, C. R., Newby, G. A., Zhang, W., Choi, M., Slivano, O. J., Holden, K., Walker, J. A., et al. (2021) · Figshare · doi:10.6084/m9.figshare.14220648
Patel, Z. M., & Hughes, T. R. (2021) · Figshare · doi:10.6084/m9.figshare.16767610
Gao, P., Lyu, Q., Ghanam, A. R., Lazzarotto, C. R., Newby, G. A., Zhang, W., Choi, M., Slivano, O. J., Holden, K., Walker, J. A., et al. (2021) · Figshare · doi:10.6084/m9.figshare.14220672
Yousefi, S., Deng, R., Lanko, K., Salsench, E. M., Nikoncuk, A., van der Linde, H. C., Perenthaler, E., van Ham, T. J., Mulugeta, E., & Barakat, T. S. (2021) · Figshare · doi:10.6084/m9.figshare.16829134
Hepkema, J., Lee, N. K., Stewart, B. J., Ruangroengkulrith, S., Charoensawan, V., Clatworthy, M. R., & Hemberg, M. (2023) · Figshare · doi:10.6084/m9.figshare.23962003
Hepkema, J., Lee, N. K., Stewart, B. J., Ruangroengkulrith, S., Charoensawan, V., Clatworthy, M. R., & Hemberg, M. (2023) · Figshare · doi:10.6084/m9.figshare.23961997
Biddie, S. C., Weykopf, G., Hird, E. F., Friman, E. T., & Bickmore, W. A. (2024) · Figshare · doi:10.6084/m9.figshare.26758288
Biddie, S. C., Weykopf, G., Hird, E. F., Friman, E. T., & Bickmore, W. A. (2024) · Figshare · doi:10.6084/m9.figshare.26758285
Kaplow, I. M., Schäffer, D. E., Wirthlin, M. E., Lawler, A. J., Brown, A. R., Kleyman, M., & Pfenning, A. R. (2022) · Figshare · doi:10.6084/m9.figshare.19582522
Wei, J., Xue, Y., Chai, H., & Gao, Y. Q. (2026) · Nucleic Acids Research · doi:10.1093/nar/gkag902
“The corresponding sequence was scanned against the hg38 reference genome, using 2179 TF motif position weight matrices previously compiled in a global reference map [ 55 ].”
Nemčko, F., Sabath, K., Pagani, M., Kleinfercher, S., Plaschka, C., & Stark, A. (2025) · bioRxiv (Cold Spring Harbor Laboratory) · doi:10.64898/2025.12.28.696747 · Cited by 1
Identification of novel DNA sequence motifs that modulate transcription in T cells
Knoetze, N., Yung, E., Bayega, A., Brown, S. D., & Holt, R. A. (2026) · BMC Genomics · doi:10.1186/s12864-025-12425-9
“To avoid redundancy, we ensured that no two selected motifs belonged to the same DNA-binding archetype as defined by Vierstra et al. [3] ( h t t p s : / / r e s o u r c e s . a l t i u s . o r g / ~ j v i e r s t r a / p r o j e c t s / m o t i f - c l u s t e r i n g - v 2 .”
Mononen, J., Taipale, M., Malinen, M., Levonen, A., Ruotsalainen, A., Norton, L., & Heikkinen, S. (2026) · PLoS Genetics · doi:10.1371/journal.pgen.1011716
“…cell type specific binding, which is still reflected on chromatin accessibility, is less likely to present with strong for footprint analysis or even DAR analysis with bulk ATAC-seq where the signals from several different cell types combine, which could be solved using single cell approaches [24].”
InfluentialTPCAV: Interpreting deep learning genomics models via concept attributionPreprint
Yang, J., & Mahony, S. (2026) · bioRxiv (Cold Spring Harbor Laboratory) · doi:10.64898/2026.01.20.700723 · Cited by 1
“Specifically, we created a library of DNA motif concepts by embedding instances of known human TF binding motifs into randomly sampled sequences from the human genome, taking the non-redundant clustered motif collection from the Vierstra lab as our source of known motifs 13 (see Methods ).”
Luo, S., Lin, L., Zhang, H., Yang, Y., Liu, Y., Han, Y., Chen, F., Liang, R., Niang, X., Dai, J., et al. (2026) · bioRxiv (Cold Spring Harbor Laboratory) · doi:10.64898/2026.02.02.703403
An Integrative Single-Cell Epigenomic Atlas Annotates the Regulatory Genome of the Adult Mouse BrainPreprint
Wang, Z., Zu, S., Armand, E. J., Loe, T. H., Rink, J. A., Wu, W., Xie, Y., Chang, L., Zhu, C., Johnson, N. D., et al. (2026) · bioRxiv (Cold Spring Harbor Laboratory) · doi:10.64898/2026.02.07.704075 · Cited by 1
de Martin, X., Martínez-Miralles, J., Beletskaya, S., Navarro, A., Izquierdo, J., Oliva, B., & Santpere, G. (2026) · bioRxiv (Cold Spring Harbor Laboratory) · doi:10.64898/2026.02.10.705010
Distinguishing causal from tagging enhancers using single-cell multiome dataPreprint
Dorans, E., & Price, A. L. (2026) · medRxiv · doi:10.64898/2026.02.15.26346353
“We determined that this approach did not outperform using all candidate peak-gene pairs in fine-mapping ( Supplementary Figure 49 ).”
Yang, M., Wu, A., Wang, H., Liu, X., Shi, J., Gao, S., & Zhang, J. (2026) · BIO-PROTOCOL · doi:10.21769/bioprotoc.5637
Lin, J., Dong, W., Zhang, J., Xie, C., Jing, X., Zhao, J., Ma, K., Kang, H., Jiang, Y., Xie, X., et al. (2026) · bioRxiv (Cold Spring Harbor Laboratory) · doi:10.64898/2026.03.03.708783
TFBSpedia: a comprehensive human and mouse transcription factor binding sites databasePreprint
Li, S., Chou, E., Wang, K., Boyle, A. P., & Sartor, M. A. (2026) · bioRxiv (Cold Spring Harbor Laboratory) · doi:10.64898/2026.03.04.709638
Functional interrogation of candidate cis-regulatory elements at the LDLR locus
Leix, K., Serrano-Zayas, C., Vyas, H., Graham, S. E., & Emmer, B. T. (2026) · PLoS Genetics · doi:10.1371/journal.pgen.1012082 · Cited by 1
“In brief, regions of open chromatin in hepatocytes were identified by colocalization with peaks for ATAC-seq or DHS-seq from human liver tissue and/or HepG2 cells [17,18].”
Étude des éléments cis-régulateurs à différentes échelles : approches fondamentales à appliquer
Hammal, F. (2023) · theses.fr (ABES) · doi:10.70675/90dfd1eczcfebz4ccfz9115z46efa92c2877
Magnitov, M. D., van der Weide, R. H., Witvliet, A. F., Hernández-Quiles, M., Martinovic, M., Teunissen, H., Braccioli, L., Vermeulen, M., & de Wit, E. (2026) · Nature Communications · doi:10.1038/s41467-026-72392-x
“To reduce redundancy and retain motifs consistently identi fi ed across multiple individuals, we adapted the published framework to perform motif clustering 111 (see “ Meth-ods ” ), and then matched the resulting clusters to known TF motif instances from the JASPAR database 112,113 (Fig.”
Dixon-Luinenburg, O., Bajwa, A., Vollger, M. R., Stergachis, A., Streets, A., & Ioannidis, N. M. (2026) · bioRxiv (Cold Spring Harbor Laboratory) · doi:10.64898/2026.06.02.729723 · Cited by 1
“Genome-wide motif matches were downloaded from Non-redundant archetype motif clusters (version 1.0) [68].”
InfluentialEastwood, N., Clarke, R. B., Sharrocks, A. D., & Nagarajan, S. (2026) · bioRxiv (Cold Spring Harbor Laboratory) · doi:10.64898/2026.06.08.730919
Disentangling covariate effects on single-cell-resolved epigenomes with DeepDive
Møller, A. F., & Madsen, J. G. S. (2026) · Patterns · doi:10.1016/j.patter.2026.101589
“For motif activity analysis, pyChromVAR 11 was used to estimate motif activity of clustered non-redundant motifs 20 on re-constructed profiles and T2D-to-ND counterfactuals, adjusting for the covariates cell type, disease, sex, race, age, BMI, and HbA1c, with default parameters.”
Zhao, C., Guan, J., Liu, J., Zhang, Z., Zhu, M., Fu, L., Dai, A., Lin, K., Zhang, L., Wang, W., et al. (2026) · Communications Biology · doi:10.1038/s42003-026-10840-6
Yoon, H., Kim, D., Jeong, H.-J., Han, H., Kim, S. J., Jang, J., Jung, D., Myung, S., Yu, C. S., Song, I. H., et al. (2026) · Bioactive Materials · doi:10.1016/j.bioactmat.2026.08.031
“Next, to identify enriched transcription factor binding motifs within peak clusters, we utilized non-redundant transcription factor motifs [97].”
Oriented binding of transcription factors to nucleosomes remodels chromatin at human promoters
Xiao, T., Crowe‐McAuliffe, C., Ochmann, M., Warrier, T., Du, Y., Hou, T., Zou, S., Chen, Y., Zhu, F., Zhang, D., et al. (2026) · Molecular Cell · doi:10.1016/j.molcel.2026.08.005
A single-nucleus multiomic and spatial atlas of gene regulation in human spermatogenesisPreprint
Bhaskaran, J., Ing‐Simmons, E., Balsells, I. B., Persio, S. D., Chan, M., Politz, M., Cremers, J., Rotte, N., Kliesch, S., Friedrich, C., et al. (2026) · bioRxiv (Cold Spring Harbor Laboratory) · doi:10.64898/2026.09.04.749409
The devil is in the enhancer: decoding regulatory variation at the ZNF827 locus in SCAD
Soler, É. (2026) · Clinical Science · doi:10.1042/cs20261108
Mehta, T. K., Man, A., Etherington, G., Smith, A. M., Indermaur, A., Salzburger, W., Joyce, D. A., Palma, F. D., & Haerty, W. (2026) · Genome Biology and Evolution · doi:10.1093/gbe/evag247
Integration by parts: The multi-layered mechanisms of cis-regulatory control
Cornwall-Scoones, J., Briscoe, J., & Delàs, M. J. (2026) · Molecular Cell · doi:10.1016/j.molcel.2026.09.016
Karbalayghareh, A., Pelzer, B., Chin, C. R., Melnick, A. M., Barišić, D., & Leslie, C. S. (2026) · Nature Biotechnology · doi:10.1038/s41587-026-03348-1 · Cited by 2
Kim, J., Ko, Y., Jang, S. Y., Shin, J. E., Kim, J., Shin, J., Park, S., Kwon, M., Lim, S. H., Jung, H. A., et al. (2026) · Research Square · doi:10.21203/rs.3.rs-11257888/v1
Metadata
- Authors
- Vierstra, J., Lazar, J., Sandstrom, R., Halow, J., Lee, K., Bates, D., Diegel, M., Dunn, D., Neri, F., Haugen, E., Rynes, E., Reynolds, A., Nelson, J., Johnson, A., Frerker, M., Buckley, M., Kaul, R., Meuleman, W., & Stamatoyannopoulos, J. A.
- Affiliations
- Altius Institute for Biomedical Sciences (US)
- University of Washington (US)
- Corresponding author
- Vierstra, Jeff
- Stamatoyannopoulos, John A.
- ORCID
- Venue
- Nature
- Published
- 2020-07-29
- Volume
- 583
- Issue
- 7818
- Pages
- 729-736
- ISSN
- 0028-0836 (ISSN-L)
- 1476-4687
- PMC
- PMC7410829
- OpenAlex
- W3046196569
- Cited by
- 386
- References
- 62
- Citations by year
- 2026: 48 · 2025: 84 · 2024: 75 · 2023: 58 · 2022: 39 · 2021: 67 · 2020: 15
- FWCI
- 15.15
- Type
- journal article
- Language
- en
- Open access
- hybrid
- doi.org
- Locations
- Nature (publishedVersion, cc-by)
- bioRxiv (Cold Spring Harbor Laboratory) (acceptedVersion, cc-by-nc-nd)
- PubMed Central (publishedVersion, cc-by)
- PubMed (publishedVersion)
- RePEc: Research Papers in Economics (submittedVersion)
- Funders
- GlaxoSmithKline
- National Institutes of Health
- National Human Genome Research Institute (U54HG007010, UM1HG009444, R35HG011317)
- Topics
- Life Sciences › Biochemistry, Genetics and Molecular Biology › Molecular Biology › Genomics and Chromatin Dynamics
- Life Sciences › Biochemistry, Genetics and Molecular Biology › Genetics › Genetic Associations and Epidemiology
- Life Sciences › Biochemistry, Genetics and Molecular Biology › Molecular Biology › Chromatin Remodeling and Cancer
- Keywords
- transcription factor footprints, DNase I footprinting, DNase I hypersensitive sites, transcription factor occupancy, chromatin accessibility, cis-regulatory evolution, loss-of-function alleles, gain-of-function alleles, gene expression regulation, functional genetic variation
- MeSH terms
- Deoxyribonuclease I, DNA, Genetics, Population, Humans, Models, Molecular, Regulatory Sequences, Nucleic Acid, Transcription Factors, Genome, Human, Consensus Sequence, DNA Footprinting, Polymorphism, Single Nucleotide, Genome-Wide Association Study
About these checks
Registry, retraction, Cites and statistics results are computed, not judged, with one exception: a printed reference that no index lists is read once by a model before it counts as a citation error. Claims are extracted by a model and kept only when their quote appears verbatim in the text; each cited source is then checked, with a model’s help, for whether it says what the claim relies on. Those verdicts can be wrong — read the claim’s quote and the cited source before relying on one.
Statistics and arithmetic are recomputed, not judged.
Confidence bands are shown only for fields calibrated on our annotated test set. None is calibrated yet, so no band is shown.
What counts as a claim ›How we measure confidence ›How we check this ›
Are you an author, or do you see a problem with this page? Request a review
