

The DOI matches its Crossref record; 63 of the 63 references it cites were found in a registry or an index.
The cGAS–STING pathway drives type I IFN immunopathology in COVID-19
Open accessAbstract
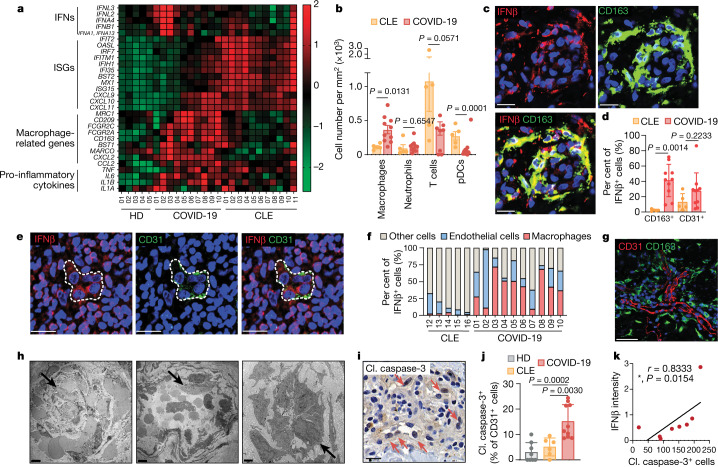
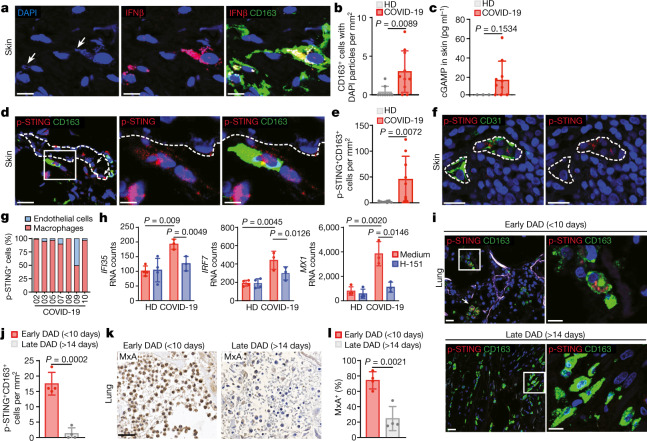
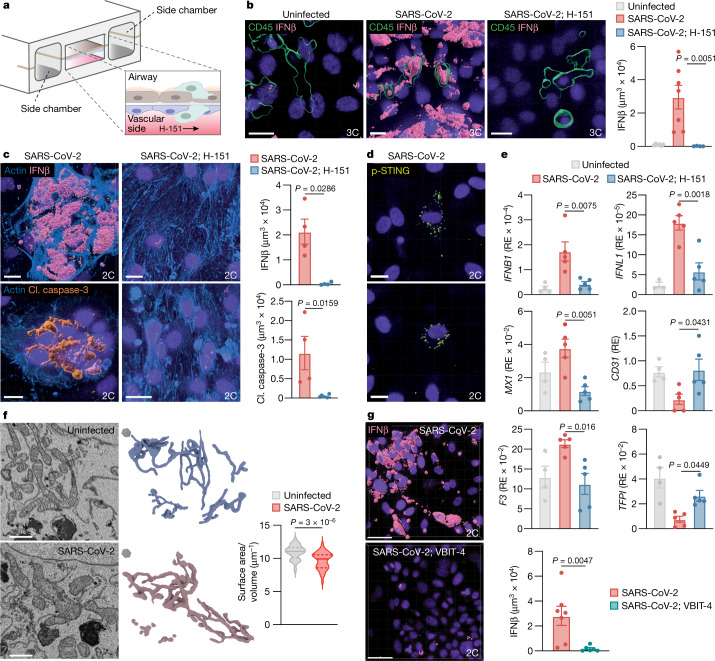
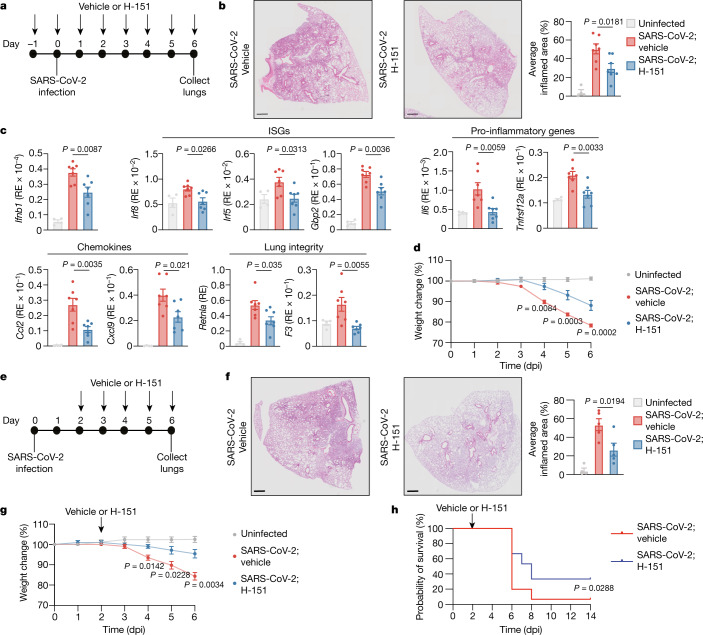
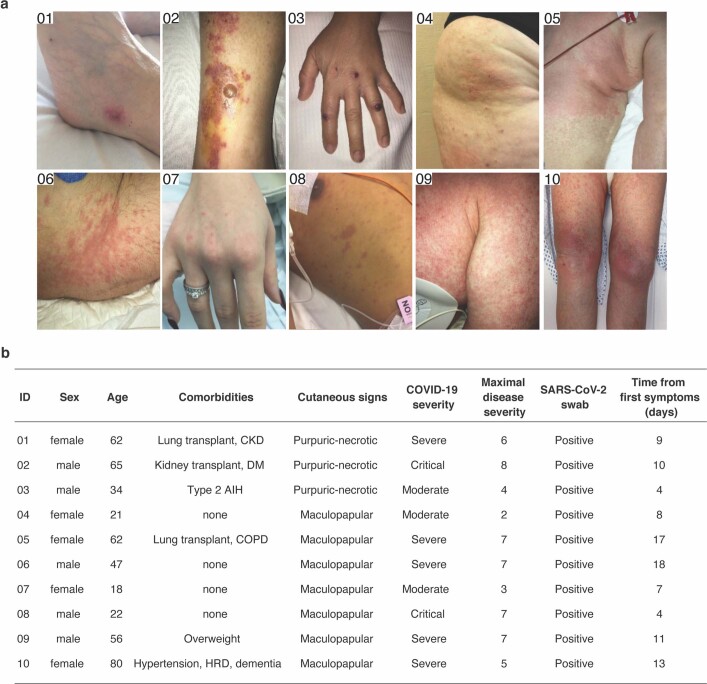
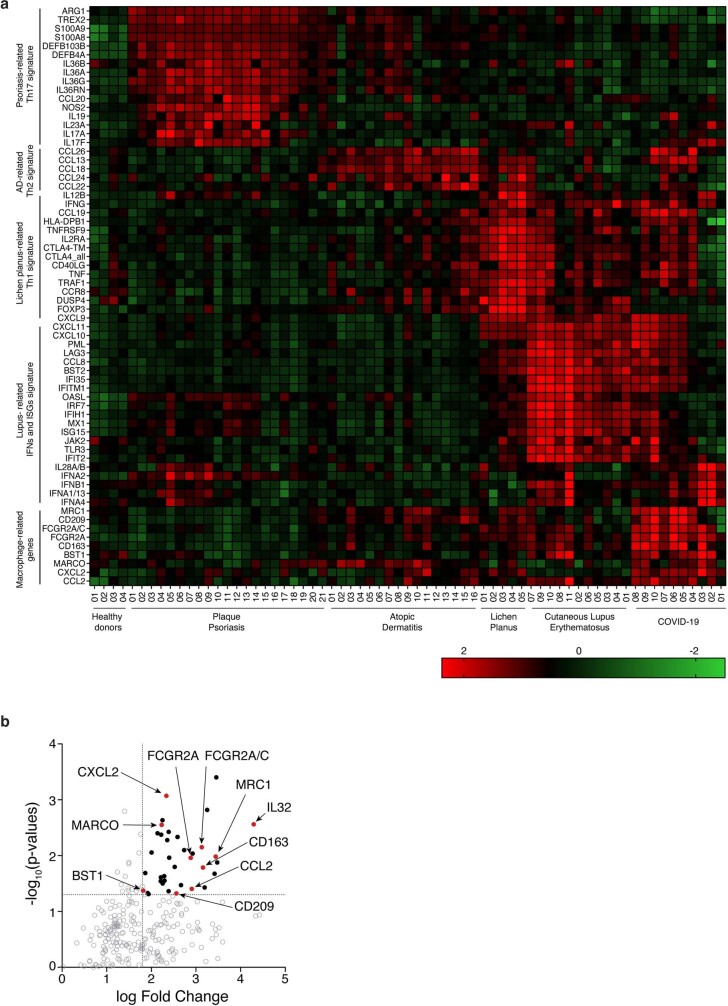
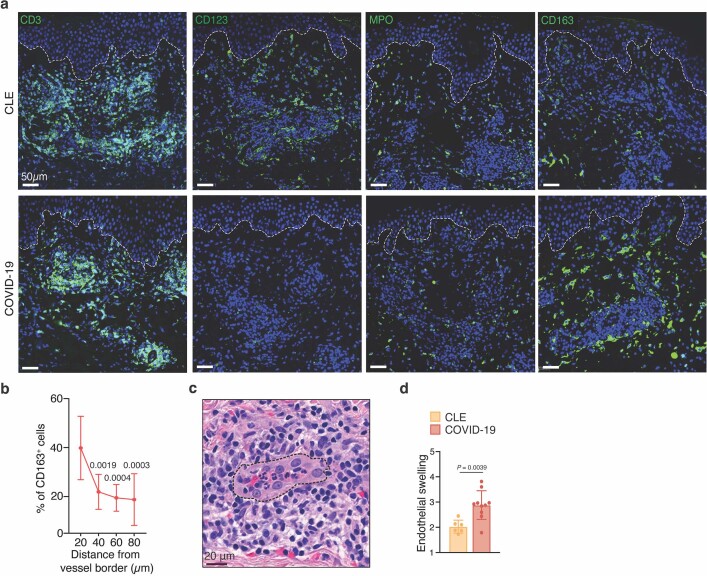
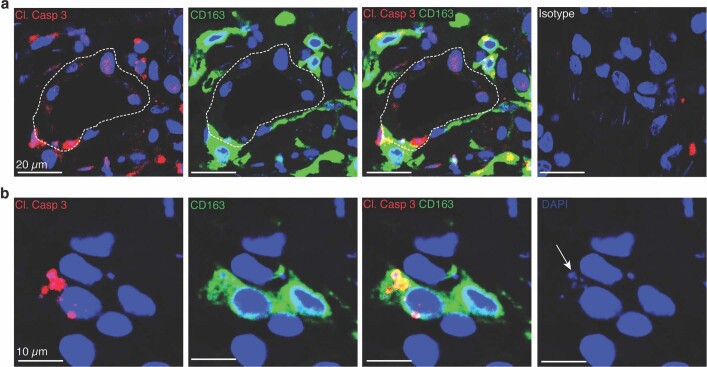
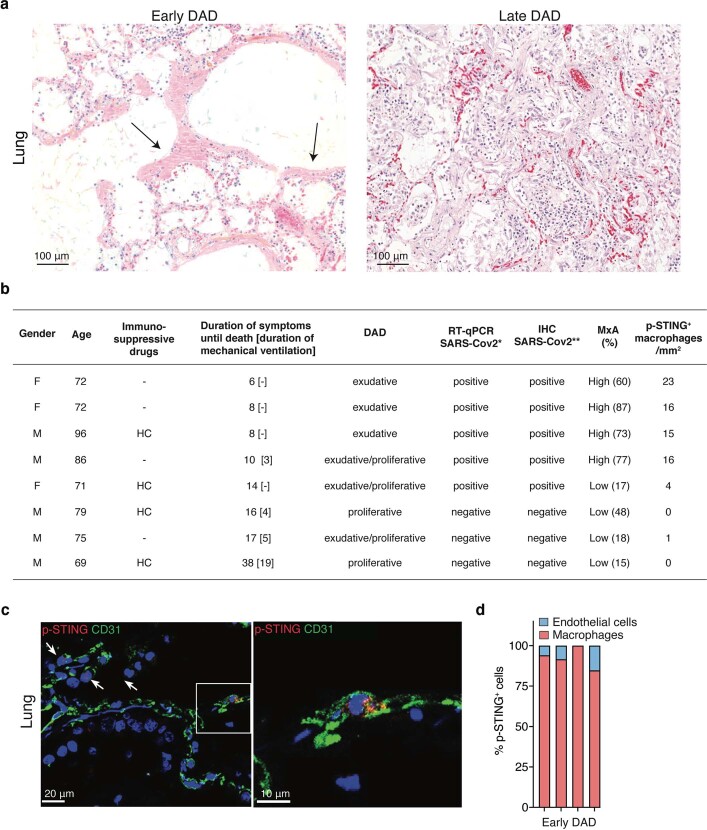
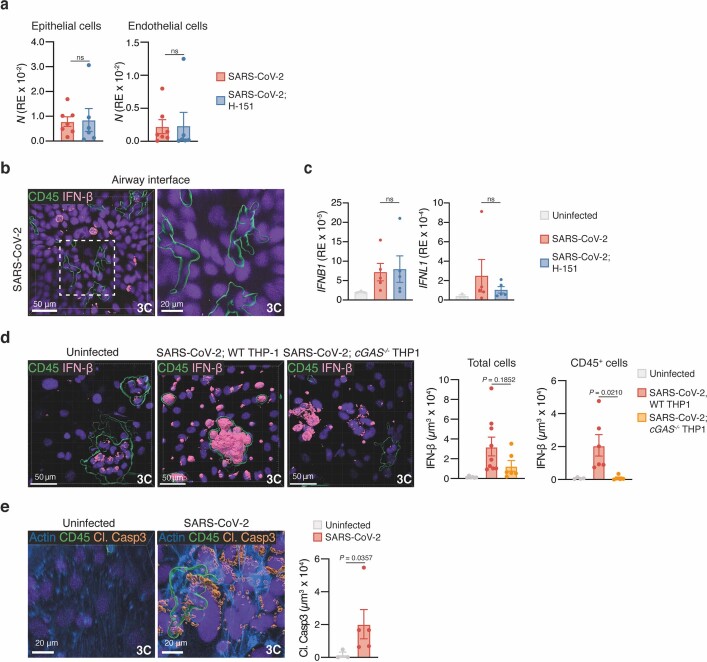
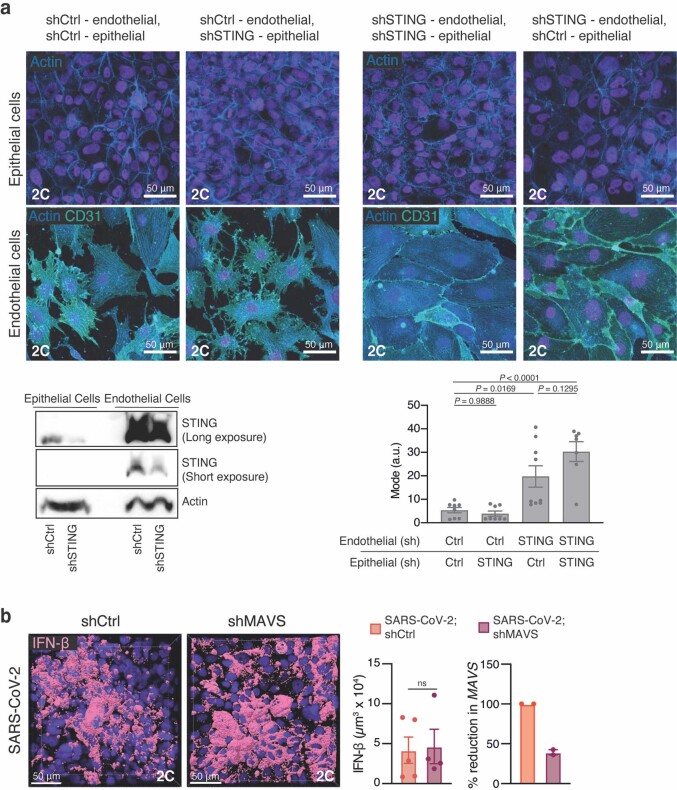
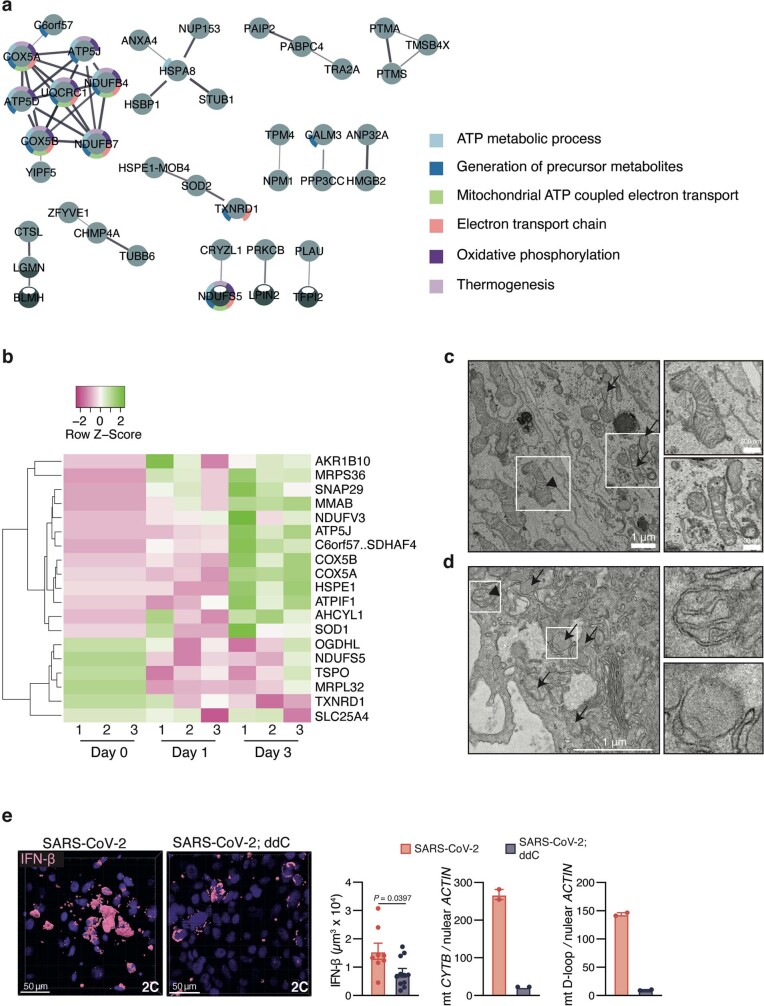
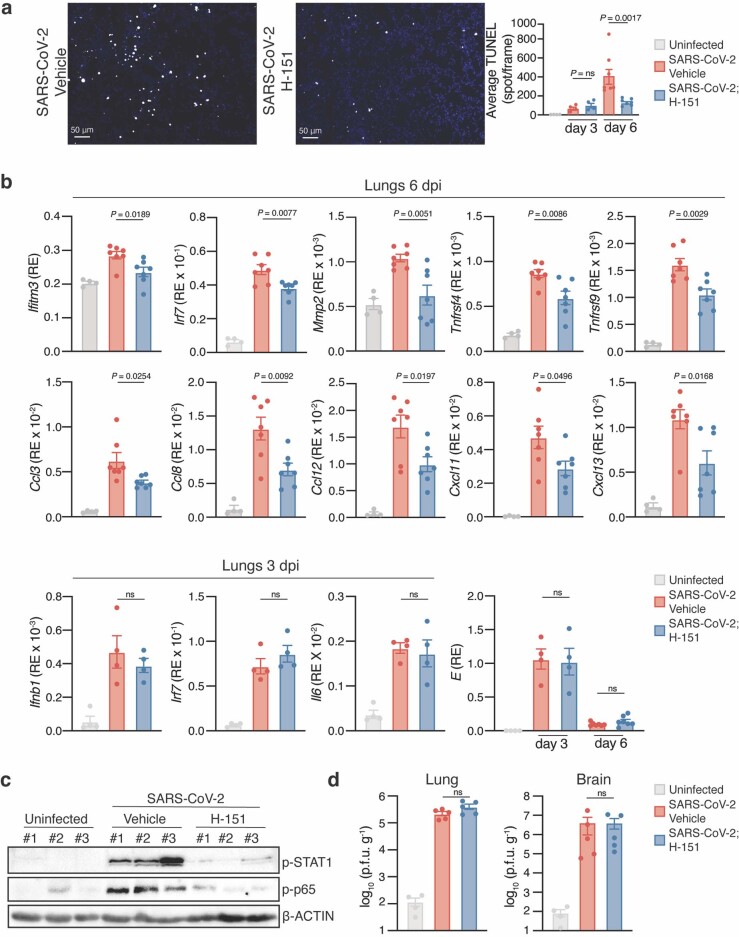
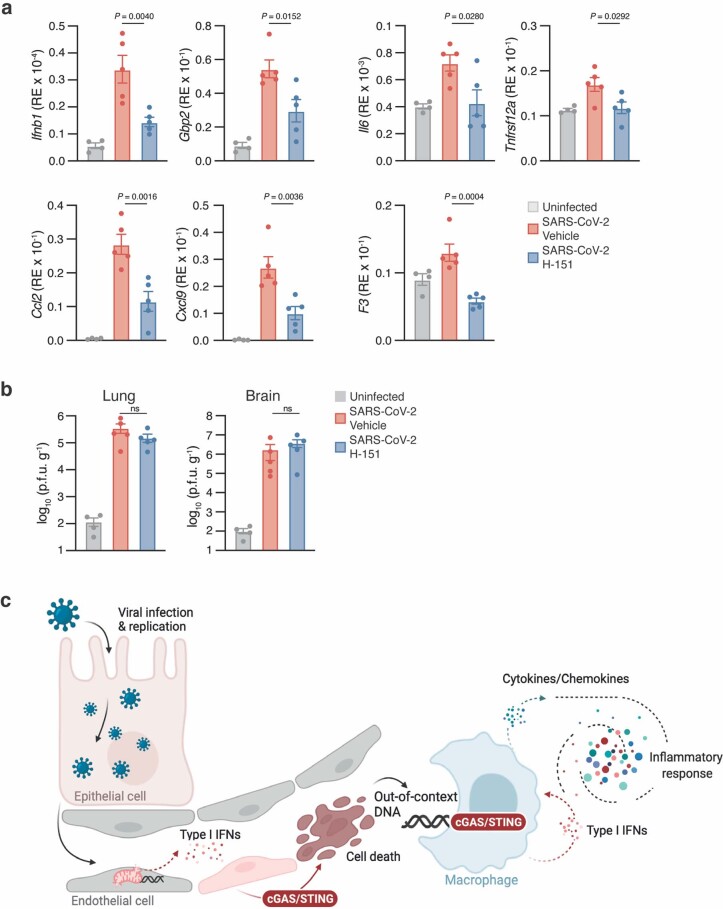
COVID-19, which is caused by infection with SARS-CoV-2, is characterized by lung pathology and extrapulmonary complications 1,2 . Type I interferons (IFNs) have an essential role in the pathogenesis of COVID-19 (refs 3–5 ). Although rapid induction of type I IFNs limits virus propagation, a sustained increase in the levels of type I IFNs in the late phase of the infection is associated with aberrant inflammation and poor clinical outcome 5–17 . Here we show that the cyclic GMP-AMP synthase (cGAS)–stimulator of interferon genes (STING) pathway, which controls immunity to cytosolic DNA, is a critical driver of aberrant type I IFN responses in COVID-19 (ref. 18 ). Profiling COVID-19 skin manifestations, we uncover a STING-dependent type I IFN signature that is primarily mediated by macrophages adjacent to areas of endothelial cell damage. Moreover, cGAS–STING activity was detected in lung samples from patients with COVID-19 with prominent tissue destruction, and was associated with type I IFN responses. A lung-on-chip model revealed that, in addition to macrophages, infection with SARS-CoV-2 activates cGAS–STING signalling in endothelial cells through mitochondrial DNA release, which leads to cell death and type I IFN production. In mice, pharmacological inhibition of STING reduces severe lung inflammation induced by SARS-CoV-2 and improves disease outcome. Collectively, our study establishes a mechanistic basis of pathological type I IFN responses in COVID-19 and reveals a principle for the development of host-directed therapeutics.
Overview
The claims and statistics of this paper haven’t been checked yet.
Run the check — free, no account needed. It reads the open-access text and checks the sources it cites.
Integrity signals
Registry
Cites
Statistics
Figures
Verification
Claims the paper makes
The claims and statistics of this paper haven’t been checked yet.
Run the check — free, no account needed. It reads the open-access text and checks the sources it cites.
Claims other papers make about this one
Each is checked against this paper’s own text: does it say what the citing paper says it does?
In the citing paper
“Targeting of the cGAS–STING axis, which induces type I interferons and other SASP factors, with the small-molecule STING inhibitor H-151 had a SASP-suppressing, senomorphic effect28,121,128,129 and led to reduced lung pathology and prolonged survival in a human ACE2-transgenic mouse model of COVID-19 (ref.59).”
From COVID-19 and cellular senescence (2023) · cites this paper as [59]
Self-check
Percentages, sums and reported differences re-computed from the paper’s own numbers.
The self-check needs the paper’s full text.
Citations
Cites
Clinical features of patients infected with 2019 novel coronavirus in Wuhan, China
Huang, C., Wang, Y., Li, X., Ren, L., Zhao, J., Hu, Y., Zhang, L., Fan, G., Xu, J., Gu, X., et al. (2020) · The Lancet · doi:10.1016/s0140-6736(20)30183-5 · Cited by 48,884
Robinson, M. D., McCarthy, D. J., & Smyth, G. K. (2010) · Bioinformatics · doi:10.1093/bioinformatics/btp616 · Cited by 41,364
limma powers differential expression analyses for RNA-sequencing and microarray studies
Ritchie, M. E., Phipson, B., Wu, D., Hu, Y., Law, C. W., Shi, W., & Smyth, G. K. (2015) · Nucleic Acids Research · doi:10.1093/nar/gkv007 · Cited by 40,458
Virological assessment of hospitalized patients with COVID-2019
Wölfel, R., Corman, V. M., Guggemos, W., Seilmaier, M., Zange, S., Müller, M. A., Niemeyer, D., Jones, T. C., Vollmar, P., Rothe, C., et al. (2020) · Nature · doi:10.1038/s41586-020-2196-x · Cited by 6,661
Endothelial cell infection and endotheliitis in COVID-19
Varga, Z., Flammer, A. J., Steiger, P., Haberecker, M., Andermatt, R., Zinkernagel, A. S., Mehra, M. R., Schuepbach, R. A., Ruschitzka, F., & Moch, H. (2020) · The Lancet · doi:10.1016/s0140-6736(20)30937-5 · Cited by 6,358
Rappsilber, J., Mann, M., & Ishihama, Y. (2007) · Nature Protocols · doi:10.1038/nprot.2007.261 · Cited by 4,641
Extrapulmonary manifestations of COVID-19
Gupta, A., Madhavan, M. V., Sehgal, K., Nair, N., Mahajan, S., Sehrawat, T. S., Bikdeli, B., Ahluwalia, N., Ausiello, J. C., Wan, E. Y., et al. (2020) · Nature Medicine · doi:10.1038/s41591-020-0968-3 · Cited by 3,185
Impaired type I interferon activity and inflammatory responses in severe COVID-19 patients
Hadjadj, J., Yatim, N., Barnabei, L., Corneau, A., Boussier, J., Smith, N., Péré, H., Charbit, B., Bondet, V., Chenevier-Gobeaux, C., et al. (2020) · Science · doi:10.1126/science.abc6027 · Cited by 2,984
Single-cell landscape of bronchoalveolar immune cells in patients with COVID-19
Liao, M., Liu, Y., Yuan, J., Wen, Y., Xu, G., Zhao, J., Cheng, L., Li, J., Wang, X., Wang, F., et al. (2020) · Nature Medicine · doi:10.1038/s41591-020-0901-9 · Cited by 2,614
MSFragger: ultrafast and comprehensive peptide identification in mass spectrometry–based proteomics
Kong, A. T., Leprevost, F. D. V., Avtonomov, D. M., Mellacheruvu, D., & Nesvizhskii, A. I. (2017) · Nature Methods · doi:10.1038/nmeth.4256 · Cited by 2,406
Cited by
Sorted by citations
Items 401–500 of 541
Martínez-Orellana, P., Manzati, M., Pozzi, D., Xiao, Y., Clemente, A. D., Mearelli, M., Kalebić, C., Perrera, V., Ferrarini, D., Carletti, T., et al. (2025) · Journal of NeuroVirology · doi:10.1007/s13365-025-01283-6 · Cited by 4
Sensing of viral lung infections by cGAS-STING
Fang, L., & Roth, M. (2022) · Exploration of Immunology · doi:10.37349/ei.2022.00052 · Cited by 3
Role of cGAS-STING signaling pathway in cardiometabolic diseases.
Ding, H., Zhou, Y., Yin, Z., & Tai, S. (2023) · PubMed Central · doi:10.11817/j.issn.1672-7347.2023.230028 · Cited by 3
Reece, A. S., & Hulse, G. K. (2023) · Frontiers in Psychiatry · doi:10.3389/fpsyt.2023.1182536 · Cited by 3
Petcharat, K., Munkong, N., Thongboontho, R., Chartarrayawadee, W., & Thim-uam, A. (2023) · Journal of Experimental Pharmacology · doi:10.2147/jep.s433181 · Cited by 4
Sun, J., Wang, Z., Duan, Y., Liu, C., Zhao, S., & Deng, J. (2024) · Frontiers in Bioscience-Landmark · doi:10.31083/j.fbl2907274 · Cited by 4
Gupta, P., Dev, K., & Kaur, G. (2024) · Phytotherapy Research · doi:10.1002/ptr.8302 · Cited by 3
Non-invasive SARS-CoV-2 RNA detection and human transcriptome analysis using skin surface lipids
Kuwano, T., Kanno, T., Tobiume, M., Hirata, Y., Katano, H., Koga, M., Nagai, H., Tsutsumi, T., Yoshikawa, N., Yotsuyanagi, H., et al. (2024) · Scientific Reports · doi:10.1038/s41598-024-77862-0 · Cited by 3
Mao, Y.-Q., Jahanshahi, S., Malty, R. H., Ommen, D. A. J. V., Wan, Y., Morey, T. M., Chuang, S. H. W., Pavlova, V., Ahmed, C., Dahal, S., et al. (2024) · Communications Biology · doi:10.1038/s42003-024-07143-z · Cited by 3
Yan, L., Yuan, C., Zhou, R., Zhong, L., To, K. K., Liu, N., Diao, X., Xie, G., Zhao, H., Hai-jiang, W., et al. (2025) · Analytica Chimica Acta · doi:10.1016/j.aca.2025.344227 · Cited by 3
Antiviral innate immunity is diminished in the upper respiratory tract of severe COVID-19 patientsPreprint
Ramos-Benítez, M. J., Strich, J. R., Alehashemi, S., Stein, S. R., Rastegar, A. T., de Jesus, A. A., Bhuyan, F., Ramelli, S. C., Babyak, A. L., Valencia, L. P., et al. (2022) · medRxiv · doi:10.1101/2022.11.08.22281846 · Cited by 2
Chloride Homeostasis Regulates cGAS-STING SignalingPreprint
Morse, J., Wang, D., Mei, S., Whitham, D., Hladun, C., Darie, C. C., Sintim, H. O., Wang, M., & Leung, K. (2024) · bioRxiv (Cold Spring Harbor Laboratory) · doi:10.1101/2024.04.08.588475 · Cited by 3
Impact of SARS-CoV-2 Wuhan and Omicron Variant Proteins on Type I Interferon Response
Janevska, M., Naessens, E., & Verhasselt, B. (2025) · Viruses · doi:10.3390/v17040569 · Cited by 2
Fernández‐Rojas, M. A., Salazar, A. M., Ostrosky‐Wegman, P., Flisser, A., & Mendlovic, F. (2025) · Archives of Virology · doi:10.1007/s00705-025-06383-6 · Cited by 2
A biosafe mouse model for SARS-CoV-2 infection that more realistically simulates COVID-19 symptoms
Huang, X., Li, Y., Deng, J., Tan, X., Yang, S., Liu, J., Wu, Z., Shi, P., Zhou, L., & Chen, Y. (2026) · Signal Transduction and Targeted Therapy · doi:10.1038/s41392-026-02640-5 · Cited by 3
Bojková, D., Steinhorst, K., Bechtel, M., Zöller, N. N., Doll, M., Ott, M., Rothweiler, F., Rothenburger, T., Riecken, K., Fehse, B., et al. (2026) · Cell Death Discovery · doi:10.1038/s41420-026-03006-0 · Cited by 2
Tsuji, S., Nakano, S., Ito, K., Minami, S., Uemura, K., Konishi, Y., Wakita, M., Okumura, Y., Kawamoto, S., Matsuki, A., et al. (2026) · EMBO Reports · doi:10.1038/s44319-026-00769-6 · Cited by 2
Endothelial mitochondrial homeostasis in the development and progression of atherosclerosis
Remex, N. S., Miah, M. S., Islam, T., Aishwarya, R., Sinha, M. H., Dhar, P., Dhaou, C. B., Orr, A. W., & Bhuiyan, M. S. (2026) · Frontiers in Cardiovascular Medicine · doi:10.3389/fcvm.2026.1813122 · Cited by 2
Stoking inflammasome fires in the COVID-19 neighborhood
Labzin, L. I., & Schroder, K. (2023) · Cell Host & Microbe · doi:10.1016/j.chom.2023.01.008 · Cited by 2
Loops Mediate Agonist-Induced Activation of the Stimulator of Interferon Genes Protein
Li, R., Chen, L., He, X., Cao, D., Zhang, Z., Jiang, H., Chen, K., & Cheng, X. (2023) · Journal of Chemical Information and Modeling · doi:10.1021/acs.jcim.3c00984 · Cited by 2
Panaxadiol acts as an HIF-1α inhibitor to suppress H9N2-induced inflammation
Xu, J., Tao, L., Zhang, M., & Wang, S. (2025) · Veterinary Microbiology · doi:10.1016/j.vetmic.2025.110695 · Cited by 2
The domiNO effect turns macrophage activation deadly
Robertson, S. J., & Best, S. M. (2022) · Immunity · doi:10.1016/j.immuni.2022.02.010 · Cited by 2
Potential role of AIM2 inflammasome in SARS‐CoV ‐2 infection
Uresti‐Rivera, E. E., & García-Hernández, M. H. (2022) · Scandinavian Journal of Immunology · doi:10.1111/sji.13239 · Cited by 2
Inflammation durably imprints memory CD4+ T cellsPreprint
Gray-Gaillard, S. L., Solis, S. M., Chen, H. M., Monteiro, C., Ciabattoni, G. O., Samanovic, M. I., Cornelius, A. R., Williams, T., Geesey, E., Rodriguez, M., et al. (2022) · bioRxiv (Cold Spring Harbor Laboratory) · doi:10.1101/2022.11.15.516351 · Cited by 2
Deng, L., Cao, C., Cai, Z., Wang, Z., Leng, B., Chen, Z., Kong, F., Zhou, Z., He, J., Nie, X., et al. (2024) · bioRxiv (Cold Spring Harbor Laboratory) · doi:10.1101/2024.02.20.578386 · Cited by 2
Fonseca, B. F., Wong-Ng, J., Connor, M. G., Mary, H., Kim, M. H., Yim, R., Bondet, V., Michel, V., Strick‐Marchand, H., Santo, J. P. D., et al. (2025) · bioRxiv (Cold Spring Harbor Laboratory) · doi:10.1101/2025.03.31.644992 · Cited by 3
Song, X., Ling, X., Liu, H., Zhao, Q., Li, X., Lai, W., & Wang, H. (2024) · Chemical Research in Chinese Universities · doi:10.1007/s40242-024-4120-7 · Cited by 1
Hu, T., Liu, Y., Fleck, J., King, C. R., Schalk, E., Zhang, Z., Mehle, A., & Smith, J. A. (2024) · Frontiers in Immunology · doi:10.3389/fimmu.2024.1358462 · Cited by 2
Potential interactions between STING pathway and the complement system in immune regulation
Zhang, B., Chen, Y., Wang, C., Gou, W., Li, Y., Hou, W., & Zhou, F. (2025) · Expert Review of Clinical Immunology · doi:10.1080/1744666x.2025.2522264 · Cited by 1
Skin manifestations of SARS-CoV-2 infection and its vaccination
Saidoune, F., Yatim, A., Domizio, J. D., & Gilliet, M. F. (2025) · Current Opinion in Immunology · doi:10.1016/j.coi.2025.102656 · Cited by 1
Self-citationMitochondria-lysosome crosstalk in microbial infections
He, Q., Huang, T., Chen, Z., Sha, Z., & Wu, H. (2025) · Science China Life Sciences · doi:10.1007/s11427-024-3037-1 · Cited by 2
Zhao, C., Liu, P., Kong, K., Chen, X., Wu, J., Wu, W., Wang, X., & Wang, L. (2025) · Cell Death Discovery · doi:10.1038/s41420-025-02776-3 · Cited by 2
Chen, S.-M., Yao, Q., Ma, Z., Wang, R.-L., Wang, Y., Wen, X.-R., Wang, X., Li, C., Zheng, C.-H., Xiao, X., et al. (2025) · World Journal of Traditional Chinese Medicine · doi:10.4103/wjtcm.wjtcm_40_25 · Cited by 1
S-nitrosation in endothelium: different outcomes of NRF2 and GSNOR loss
Kopacz, A., Klóska, D., Kraszewska, I., Targosz‐Korecka, M., Kubisiak, A., Jankowska, U., Skupień-Rabian, B., Grochot‐Przeczek, A., & Józkowicz, A. (2025) · Free Radical Biology and Medicine · doi:10.1016/j.freeradbiomed.2025.11.037 · Cited by 1
García-Mouton, C., Mishra, R., Collada, A., Hoos, M., Sharma, K., Nass, T., Sommer, M., Pérez‐Gil, J., & Thacker, V. V. (2026) · American Journal of Respiratory Cell and Molecular Biology · doi:10.1093/ajrcmb/aanag197 · Cited by 1
Self-citationGuo, J., Su, Q., Chai, H., Cui, X., Zhu, J., Yang, J., & Zhang, S. (2026) · International Immunopharmacology · doi:10.1016/j.intimp.2025.116137 · Cited by 1
Li, W., Sun, Y., Guan, Y., & Zhi, X. (2026) · Nanomedicine · doi:10.1080/17435889.2026.2614568 · Cited by 1
STING-ERO1 signaling exacerbates PARylation-mediated parthanatos in sepsis
Li, X., Zhou, Q., Zhang, X., Li, Y., Yang, Y., Jie, W., Liu, Q., Liu, P., Jiang, H., Liu, J., et al. (2026) · Cell Communication and Signaling · doi:10.1186/s12964-026-02791-6 · Cited by 1
Møhlenberg, M., Jørgensen, S. E., van der Sluis, R. M., Zillinger, T., Hinke, D. M., Hollensen, A. K., Hansen, A. L., Effort, C. H. G., COVID-19 DNABR Group, French COVID Cohort Study Group, et al. (2026) · Proceedings of the National Academy of Sciences · doi:10.1073/pnas.2522111123 · Cited by 1
A Decade of cGAS Discovery: Point of Convergence in Oral Diseases
Sun, L., Gao, P., Xiao, P., Li, S., & Liu, D. (2026) · International Dental Journal · doi:10.1016/j.identj.2025.109382 · Cited by 1
Chiu, H.-P., Yeo, Y. Y., Lai, T. Y., Hung, C.-T., Kowdle, S., Haas, G. D., Jiang, S., Sun, W., & Lee, B. (2026) · Journal of General Virology · doi:10.1099/jgv.0.002233 · Cited by 1
Implications of metabolic dysfunction associated fatty liver disease in COVID-19
Chakraborty, R., Sharma, D. K., Kapoor, D., Dwivedi, A., Khabiya, R., & Sen, S. (2023) · World Journal of Clinical Cases · doi:10.12998/wjcc.v11.i6.1275 · Cited by 1
Exploring COVID-19 causal genes through disease-specific Cis-eQTLs
Zhang, S., Wang, P., Shi, L., Wang, C., Zhu, Z., Qi, C., Xie, Y., Yuan, S., Cheng, L., Yin, X., et al. (2024) · Virus Research · doi:10.1016/j.virusres.2024.199341 · Cited by 1
Diagnosis and management of COVID toes in outpatients: a case report
Pouxe, M., Abdulkarim, A., Vallière, S. D., Seremet, T., Favrat, B., & Kokkinakis, I. (2024) · Journal of Medical Case Reports · doi:10.1186/s13256-024-04626-9 · Cited by 1
Liu, X., Xie, J., Xiao, H., Zhang, C., Li, W., Zhou, M., Zeng, Y., Zhang, J., Yang, M., Yang, Y., et al. (2025) · ACS Nano · doi:10.1021/acsnano.4c18553 · Cited by 1
Cross‐Species Transmission of SARS‐CoV‐2 From Dogs to Hamsters and Pathological Changes in the Brain
Kim, D., Kim, K., Kim, J., Lim, K., Jeon, M., Lee, J., Park, S., Song, C., Lee, S., Lee, D., et al. (2025) · Journal of Medical Virology · doi:10.1002/jmv.70496 · Cited by 1
Dai, X., Zhou, X., Shao, R., Zhao, R., Yanamandra, A. K., Xing, Z., Ding, M., Wang, J., Zhang, H., Wang, Y. N., et al. (2021) · bioRxiv (Cold Spring Harbor Laboratory) · doi:10.1101/2021.10.22.465498 · Cited by 1
SARS-CoV-2 impacts the transcriptome and epigenome at the maternal-fetal interface in pregnancyPreprint
Gao, L., Mathur, V., Tam, S. K. M., Zhou, X., Cheung, M. F., Chan, L. Y., Estrada‐Gutiérrez, G., Leung, B. W., Moungmaithong, S., Wang, C. C., et al. (2022) · bioRxiv (Cold Spring Harbor Laboratory) · doi:10.1101/2022.05.31.494153 · Cited by 1
Lei, I., & Tang, P. C. Y. (2023) · Journal of Thoracic and Cardiovascular Surgery · doi:10.1016/j.jtcvs.2023.03.011 · Cited by 1
The assembly of neutrophil inflammasomes during COVID-19 is mediated by type I interferonsPreprint
Cabrera, L. E., Jokiranta, S. T., Mäki, S., Miettinen, S., Kant, R., Kareinen, L., Sironen, T. A., Pietilä, J.-P., Kantele, A., Kekäläinen, E., et al. (2023) · medRxiv · doi:10.1101/2023.09.07.23295190 · Cited by 1
cGAMP-Dependent PKG1 Activation in Perspective
Förstermann, U. (2023) · Circulation · doi:10.1161/circulationaha.123.066073 · Cited by 1
Dysregulation of innate immunity and cellular metabolism through virus-induced deISGylationPreprint
Zhu, J., Liu, G., Xu, J., Li, K., Goins, C. M., Yu, H., Sayyad, Z., Zhou, Y., White, E., Fiehn, O., et al. (2025) · bioRxiv (Cold Spring Harbor Laboratory) · doi:10.1101/2025.09.08.674928 · Cited by 1
動作マージンを確保可能なディジタル LSI の製造後クロック調整手法の提案
Susa, T., 村川, 正., 高橋, 栄., 古谷, 立., 樋口, 哲., 古市, 愼., 上田, 佳., & 和田, 淳. (2009) · 情報処理学会論文誌数理モデル化と応用(TOM)
The 6th international cell senescence association conference
Kawamoto, S., Matsumoto, T., Takasugi, M., & Hara, E. (2022) · Genes to Cells · doi:10.1111/gtc.12970
Cell dichotomous role of STING in pulmonary hypertensionPreprint
Pham, A. T., Oliveira, A. C. D. S., Fu, C., Alves, M. D., Dupee, Z., Mukhsinova, L., Ebrahimi, E., Patel, H., Patel, R., Nguyen, A., et al. (2022) · bioRxiv (Cold Spring Harbor Laboratory) · doi:10.1101/2022.11.29.518422
Chauhan, N. R., Kundu, S., Bal, R., Chattopadhyay, D., Mehto, S., Sahu, R., Yadav, R., Krishna, S., Jena, K. K., Satapathy, S., et al. (2022) · bioRxiv (Cold Spring Harbor Laboratory) · doi:10.1101/2022.12.17.520843
Some Aspects of Pathology and Pathogenesis of Coronavirus Infection
Zinserling, V. A., Semenova, N. Y., & Murashova, L. A. (2023) · BENTHAM SCIENCE PUBLISHERS eBooks · doi:10.2174/9789815123371123030008
Aragão, G. F., Feitosa, S. G., Veras, H. N., FILHO, C. G. A. P. D. L., Assunção, K. D. S., Arrais, L. M., & Teixeira, S. L. M. (2023) · Exploration of Immunology · doi:10.37349/ei.2023.00089
Cunha, J. B., Leix, K., Sherman, E. J., Mirabelli, C., Kennedy, A. A., Lauring, A. S., Tai, A. W., Wobus, C. E., & Emmer, B. T. (2023) · bioRxiv (Cold Spring Harbor Laboratory) · doi:10.1101/2023.02.28.530557
Meeting Proceedings from ICBS 2022 – Uncovering Solutions for Diseases
Syphers, J. L., Xue, L., Yi, X., Wang, R. E., & Haubrich, B. A. (2023) · ACS Chemical Biology · doi:10.1021/acschembio.3c00205
Yu, X.-J., Jiang, Z., Min, C., Yan, L., Zhang, W., Li, B., Xu, J., Zhao, Z., Zhou, C., & Han, H. (2023) · Research Square · doi:10.21203/rs.3.rs-3180657/v1
STING/RANTES Pathway in Airway Epithelium Stimulates Sensitization to Der p1 in an Asthma ModelPreprint
Tsuji, M., Kondo, M., Nishiyama, A., Tamura, T., Nakamura‐Ishizu, A., & Tagaya, E. (2023) · bioRxiv (Cold Spring Harbor Laboratory) · doi:10.1101/2023.07.30.550251
Xu, F., Tian, X., Zhu, Q., Feng, Z., Li, H. J., Dai, W., Zhou, Y.-L., You, Q., & Xu, X. (2023) · Current Drug Targets · doi:10.2174/1389450124666230831160820
Hong, S., Luo, Y., Niu, M., Liu, Y., Zhang, M., Deng, Y., Mu, D., & Xu, J. (2023) · Research Square · doi:10.21203/rs.3.rs-3213446/v1
Sun, J., Wang, Z., Zheng, C., Duan, Y., Liu, C., Zhao, S., & Deng, J. (2023) · Research Square · doi:10.21203/rs.3.rs-3321598/v1
Cabrera, L. E., Jokiranta, S. T., Mäki, S., Miettinen, S., Kant, R., Kareinen, L., Sironen, T. A., Pietilä, J.-P., Kantele, A., Kekäläinen, E., et al. (2023) · SSRN Electronic Journal · doi:10.2139/ssrn.4564670
Lee, J. (2023) · Research Square · doi:10.21203/rs.3.rs-3238261/v1
Tartour, É., Benhamouda, N., Besbes, A., Bauer, R., Mabrouk, N., Gadouas, G., Desaint, C., Chevrier, L., Lefebvre, M., Radenne, A., et al. (2023) · Research Square · doi:10.21203/rs.3.rs-3359568/v1
Shi, Y., Yu, C., Yu, Z., Shang, J., Yang, Q., Liang, Y., Lai, C., Feng, T., Yao, Y., Zeng, F., et al. (2023) · IntechOpen eBooks · doi:10.5772/intechopen.1002641
Stimulator of Interferon Genes, the Missing Link in the Pathogenesis of COVID-19
Rezaei, M. S., Mirahmadi, A., Bineshfar, N., Marjani, M., & Mansouri, D. (2023) · Biomedical and Biotechnology Research Journal (BBRJ) · doi:10.4103/bbrj.bbrj_233_23
Transcriptome Heterogeneity in COVID-19-induced Acute Respiratory Distress SyndromePreprint
Nishii, M., Honzawa, H., Oki, H., Matsumura, R., Sakai, K., Saji, R., Ban, T., Tamura, T., & Takeuchi, I. (2024) · Research Square · doi:10.21203/rs.3.rs-3908055/v1
The role of USP22 in nucleic acid sensing pathways and interferon-induced necroptotic cell death
Karlowitz, R. (2024) · Publication Server of Goethe University Frankfurt am Main (Goethe University Frankfurt) · doi:10.21248/gups.81916
(2024) · Frontiers research topics · doi:10.3389/978-2-8325-4975-9
Virus-specific T cell response in SARS-CoV-2 infection and vaccinations
Bertoletti, A., Qui, M., & Lim, J. M. E. (2025) · Elsevier eBooks · doi:10.1016/b978-0-443-19170-1.00038-3
Mechanism and significance of cell senescence induced by viral infection
Chang, Y., Wu, X., Deng, L., Wang, S., & Mao, G. (2025) · Journal of Zhejiang University (Medical Sciences) · doi:10.3724/zdxbyxb-2024-0213 · Cited by 1
Krishna, D. V., Chandan, P. B., Venkat, D. S., & Sankar, M. R. (2025) · Wiley eBooks · doi:10.1002/9781394287659.ch18
Nathwani, V., Weeratunga, P. N., Woo, J., Denney, L., Vuppusetty, C., Hu, T., Zulfikar, S., Achaiah, A., Parker, H., Chuang, H.-W., et al. (2025) · medRxiv · doi:10.1101/2025.05.09.25326523
Emerging Human Choroid Plexus Organoid Models for Blood-CSF Barrier Research
Qiao, H., & Zhao, Z. (2025) · Neuromethods · doi:10.1007/978-1-0716-4474-4_4
Type I Interferons in SARS-CoV-2 Cutaneous Infection: Is There a Role in Antiviral Defense?
Yendo, T. M., Orfali, R. L., Pereira, N. V., Pereira, N. Z., Ramos, Y. Á. L., Kawakami, J. T., Duarte‐Neto, A. N., Sotto, M. N., da Silva, L. F. F., Duarte, A. J. D. S., et al. (2025) · International Journal of Molecular Sciences · doi:10.3390/ijms26136049
Hao, Y., Fan, C., Wen, W., Li, R., Gao, Y., Hou, X., Lu, L., & Shen, Y. (2025) · Gene · doi:10.1016/j.gene.2025.149660
Advanced Cancer Immunotherapy via SMARCAL1 Blockade Using a Glucose‐Responsive CRISPR Nanovaccine
Li, Y., Zhang, Y., Li, C., Chen, G., Muhammad, P., Yao, Y., Gao, L., Liu, Z., & Wang, Y. (2025) · Advanced Science · doi:10.1002/advs.202502929
Reece, A. S., & Hulse, G. K. (2025) · Elsevier eBooks · doi:10.1016/b978-0-443-13492-0.00027-x
Kernizan, F., Dave, H., Rossetti, V., Frey, C., & Richmond, J. M. (2025) · Frontiers in Lupus · doi:10.3389/flupu.2025.1645416
A pain from the nose to the head: neurological commitment during long COVID
Corrêa-Dias, L. C., Lopes-Ribeiro, Á., Mendes, G. E. R., Marques-Ferreira, G., Teixeira, C. W., Clarindo, F. A., Rocha, V. D. M., Martuchele-Félix, M. E., Retes, H. M., Santos, T. A. P., et al. (2025) · Inflammation Research · doi:10.1007/s00011-025-02085-6
Human coronavirus 3CL protease manipulates host protein STIM1 to facilitate immune evasion
Lee, Y. Y., Lee, A. R., Seo, S., Park, U., Kim, T., Lee, S. K., Jeong, H., Jeong, S. J., Kweon, Y. C., Park, G. E., et al. (2025) · Proceedings of the National Academy of Sciences · doi:10.1073/pnas.2503436122
Boroujeni, S. F., Rodriguez, G. M., Galpin, K. J. C., Yakubovich, E., Murshed, H., Ibrahim, D., Asif, S., & Vanderhyden, B. C. (2024) · Figshare · doi:10.6084/m9.figshare.26646244
Boroujeni, S. F., Rodriguez, G. M., Galpin, K. J. C., Yakubovich, E., Murshed, H., Ibrahim, D., Asif, S., & Vanderhyden, B. C. (2024) · Figshare · doi:10.6084/m9.figshare.26646238
Boroujeni, S. F., Rodriguez, G. M., Galpin, K. J. C., Yakubovich, E., Murshed, H., Ibrahim, D., Asif, S., & Vanderhyden, B. C. (2024) · Figshare · doi:10.6084/m9.figshare.26646241
Liu, X., Likai, J., Cheng, Y., Kong, L., Xie, S., Yang, J., Chen, J., Wang, Z., Ma, J., Wang, H., et al. (2024) · Figshare · doi:10.6084/m9.figshare.26735298
Liu, X., Ji, L., Cheng, Y., Kong, L., Xie, S., Yang, J., Chen, J., Wang, Z., Ma, J., Wang, H., et al. (2024) · Figshare · doi:10.6084/m9.figshare.26054598
Liu, X., Ji, L., Cheng, Y., Kong, L., Xie, S., Yang, J., Chen, J., Wang, Z., Ma, J., Wang, H., et al. (2024) · Figshare · doi:10.6084/m9.figshare.26735292
Liu, X., Ji, L., Cheng, Y., Kong, L., Xie, S., Yang, J., Chen, J., Wang, Z., Ma, J., Wang, H., et al. (2024) · Figshare · doi:10.6084/m9.figshare.26735295
Boroujeni, S. F., Rodriguez, G. M., Galpin, K. J. C., Yakubovich, E., Murshed, H., Ibrahim, D., Asif, S., & Vanderhyden, B. C. (2024) · Figshare · doi:10.6084/m9.figshare.26646226
Boroujeni, S. F., Rodriguez, G. M., Galpin, K. J. C., Yakubovich, E., Murshed, H., Ibrahim, D., Asif, S., & Vanderhyden, B. C. (2024) · Figshare · doi:10.6084/m9.figshare.26646232
Boroujeni, S. F., Rodriguez, G. M., Galpin, K. J. C., Yakubovich, E., Murshed, H., Ibrahim, D., Asif, S., & Vanderhyden, B. C. (2024) · Figshare · doi:10.6084/m9.figshare.26646235
Liu, X., Ji, L., Cheng, Y., Kong, L., Xie, S., Yang, J., Chen, J., Wang, Z., Ma, J., Wang, H., et al. (2024) · Figshare · doi:10.6084/m9.figshare.26735289
Boroujeni, S. F., Rodriguez, G. M., Galpin, K. J. C., Yakubovich, E., Murshed, H., Ibrahim, D., Asif, S., & Vanderhyden, B. C. (2024) · Figshare · doi:10.6084/m9.figshare.26646229
Liu, X., Ji, L., Cheng, Y., Kong, L., Xie, S., Yang, J., Chen, J., Wang, Z., Ma, J., Wang, H., et al. (2024) · Figshare · doi:10.6084/m9.figshare.26054783
Liu, K., Yan, J. C., Chi, F., Wang, W., Zhang, M., Hou, Y., & Bai, G. (2026) · Chinese Medicine · doi:10.1186/s13020-025-01281-0
Suspène, R., O'Hora, B., d’Aertrycke, C. D. M., Couturier, L., Defresne, T., Khalfi, P., Li, X., & Vartanian, J. (2026) · NAR Molecular Medicine · doi:10.1093/narmme/ugag012
Metadata
- Authors
- Domizio, J. D., Gulen, M. F., Saidoune, F., Thacker, V. V., Yatim, A., Sharma, K., Nass, T., Guenova, E., Schaller, M., Conrad, C., Goepfert, C., de Leval, L., Garnier, C. V., Berezowska, S., Dubois, A., Gilliet, M., & Ablasser, A.
- Affiliations
- École Polytechnique Fédérale de Lausanne (CH)
- Centre Hospitalier Universitaire Vaudois (CH)
- University of Tübingen (DE)
- University of Bern (CH)
- Corresponding author
- Gilliet, Michel
- Ablasser, Andrea
- ORCID
- Venue
- Nature
- Published
- 2022-01-19
- Volume
- 603
- Issue
- 7899
- Pages
- 145-151
- ISSN
- 0028-0836 (ISSN-L)
- 1476-4687
- PMC
- PMC8891013
- OpenAlex
- W4205252391
- Cited by
- 538
- References
- 60
- Citations by year
- 2026: 63 · 2025: 98 · 2024: 136 · 2023: 141 · 2022: 98
- FWCI
- 45.46
- Type
- journal article
- Language
- en
- Open access
- hybrid
- doi.org
- Locations
- Nature (publishedVersion, cc-by)
- PubMed Central (publishedVersion, cc-by)
- PubMed (publishedVersion)
- SERVAL (Université de Lausanne) (publishedVersion, cc-by)
- RePEc: Research Papers in Economics (submittedVersion)
- BORIS (University Library Bern) (submittedVersion, cc-by)
- Infoscience (Ecole Polytechnique Fédérale de Lausanne) (submittedVersion, cc-by-nc-nd)
- IRIS (submittedVersion, cc-by)
- Open Access CRIS of the University of Bern
- Funders
- Novartis Foundation
- Fondation Acteria
- European Commission (HORIZON2020, COVID-19)
- Novartis Stiftung für Medizinisch-Biologische Forschung
- Fondation Leenaards
- Université de Lausanne
- Centre Hospitalier Universitaire Vaudois
- H2020 European Research Council (804933)
- Topics
- Life Sciences › Immunology and Microbiology › Immunology › interferon and immune responses
- Health Sciences › Medicine › Infectious Diseases › SARS-CoV-2 and COVID-19 Research
- Health Sciences › Medicine › Infectious Diseases › COVID-19 Clinical Research Studies
- Keywords
- COVID-19 pandemic, SARS-CoV-2, cGAS-STING pathway, type I interferon, immunopathology, cytosolic DNA sensing, macrophages, endothelial cells, mitochondrial DNA release, lung inflammation, STING inhibition, host-directed therapeutics, cutaneous manifestations
- MeSH terms
- COVID-19, SARS-CoV-2, STING Protein, Cyclic Guanosine Monophosphate-Adenosine Monophosphate Synthase, Animals, Cells, Cultured, Disease Models, Animal, DNA, Mitochondrial, Female, Gene Expression Regulation, Humans, Immunity, Innate, Interferon Type I, Lung, Macrophages, Membrane Proteins, Mice, Inbred C57BL, Nucleotidyltransferases, Pneumonia, Skin, Signal Transduction, Disease Progression, Endothelial Cells, Mice
About these checks
Registry, retraction, Cites and statistics results are computed, not judged, with one exception: a printed reference that no index lists is read once by a model before it counts as a citation error. Claims are extracted by a model and kept only when their quote appears verbatim in the text; each cited source is then checked, with a model’s help, for whether it says what the claim relies on. Those verdicts can be wrong — read the claim’s quote and the cited source before relying on one.
Statistics and arithmetic are recomputed, not judged.
Confidence bands are shown only for fields calibrated on our annotated test set. None is calibrated yet, so no band is shown.
What counts as a claim ›How we measure confidence ›How we check this ›
Are you an author, or do you see a problem with this page? Request a review
