

The DOI matches its Crossref record; 14 of the 14 references it cites were found in a registry or an index.
Genetic insights into the social organization of Neanderthals
Abstract
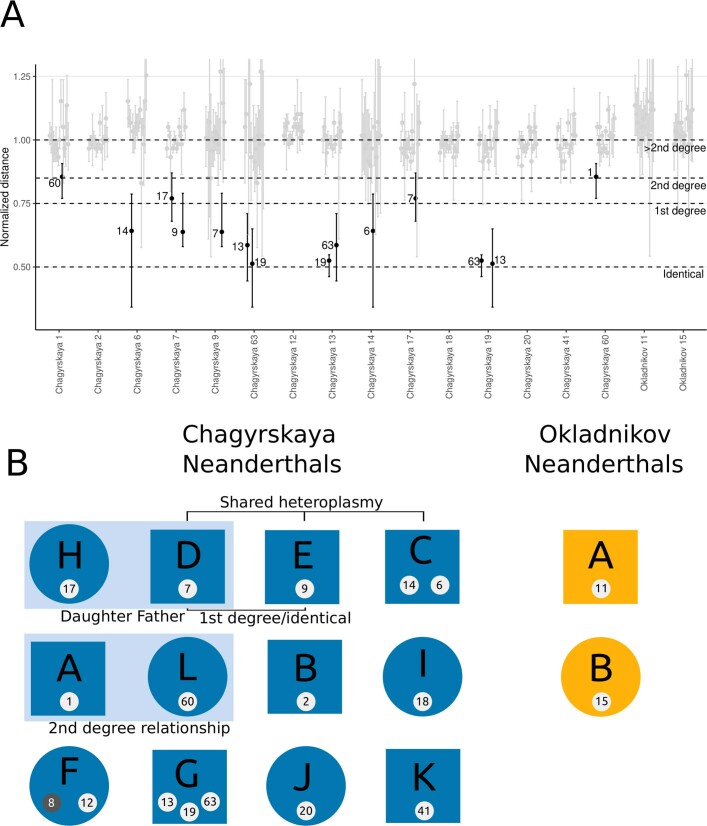
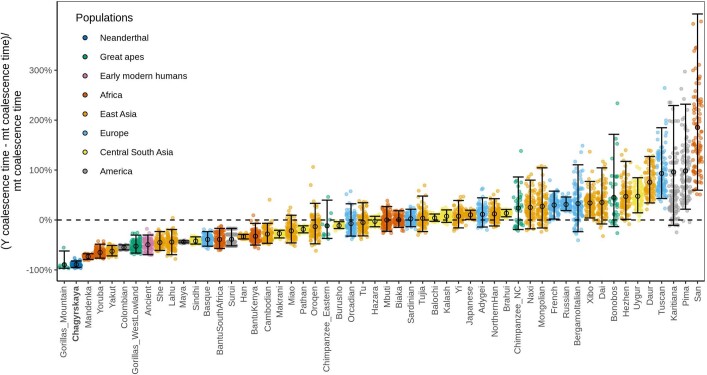
Genomic analyses of Neanderthals have previously provided insights into their population history and relationship to modern humans 1–8 , but the social organization of Neanderthal communities remains poorly understood. Here we present genetic data for 13 Neanderthals from two Middle Palaeolithic sites in the Altai Mountains of southern Siberia: 11 from Chagyrskaya Cave 9,10 and 2 from Okladnikov Cave 11 —making this one of the largest genetic studies of a Neanderthal population to date. We used hybridization capture to obtain genome-wide nuclear data, as well as mitochondrial and Y-chromosome sequences. Some Chagyrskaya individuals were closely related, including a father–daughter pair and a pair of second-degree relatives, indicating that at least some of the individuals lived at the same time. Up to one-third of these individuals’ genomes had long segments of homozygosity, suggesting that the Chagyrskaya Neanderthals were part of a small community. In addition, the Y-chromosome diversity is an order of magnitude lower than the mitochondrial diversity, a pattern that we found is best explained by female migration between communities. Thus, the genetic data presented here provide a detailed documentation of the social organization of an isolated Neanderthal community at the easternmost extent of their known range.
Overview
The claims and statistics of this paper haven’t been checked yet.
Run the check — free, no account needed. It reads the open-access text and checks the sources it cites.
Integrity signals
Registry
Cites
Statistics
Figures
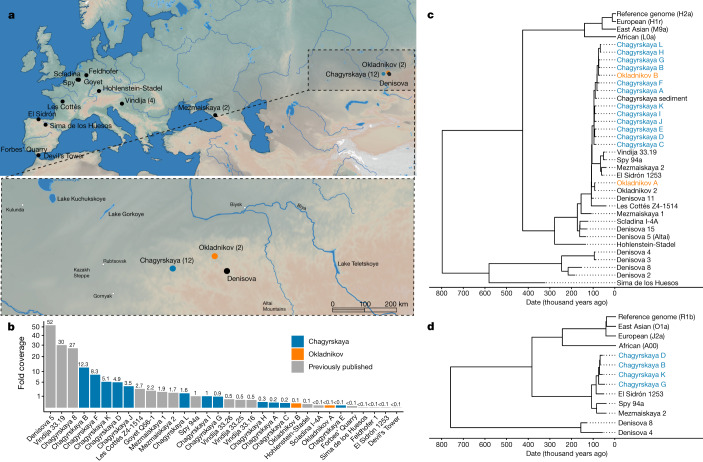
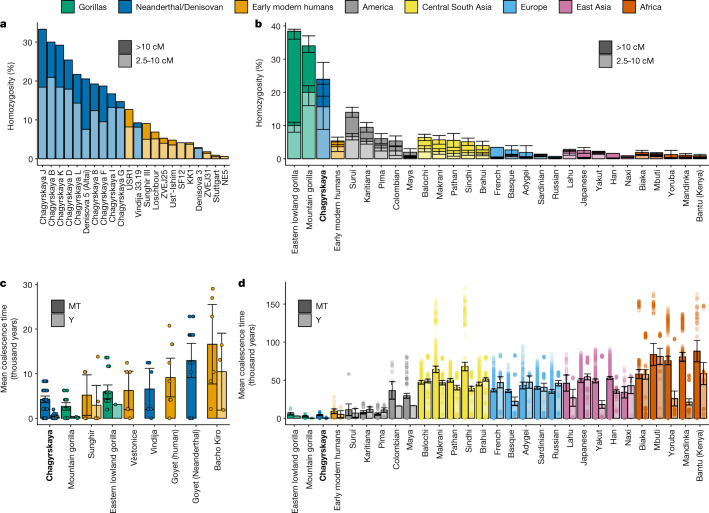
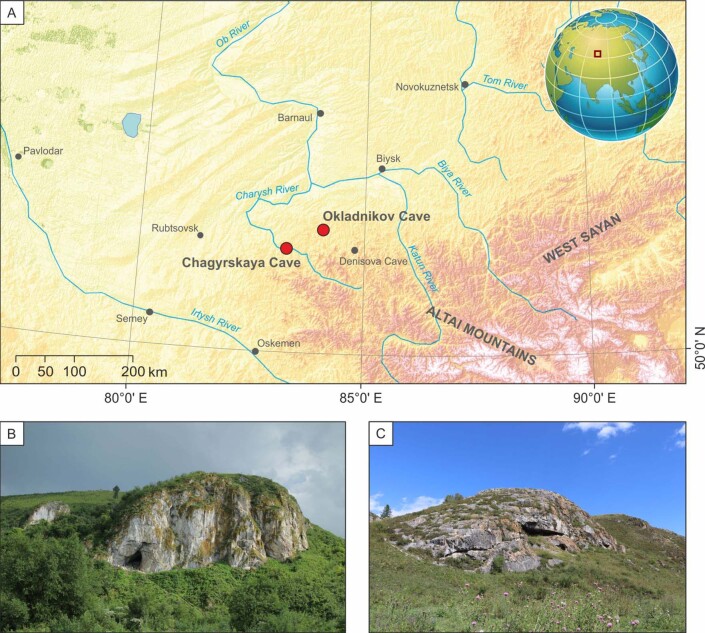
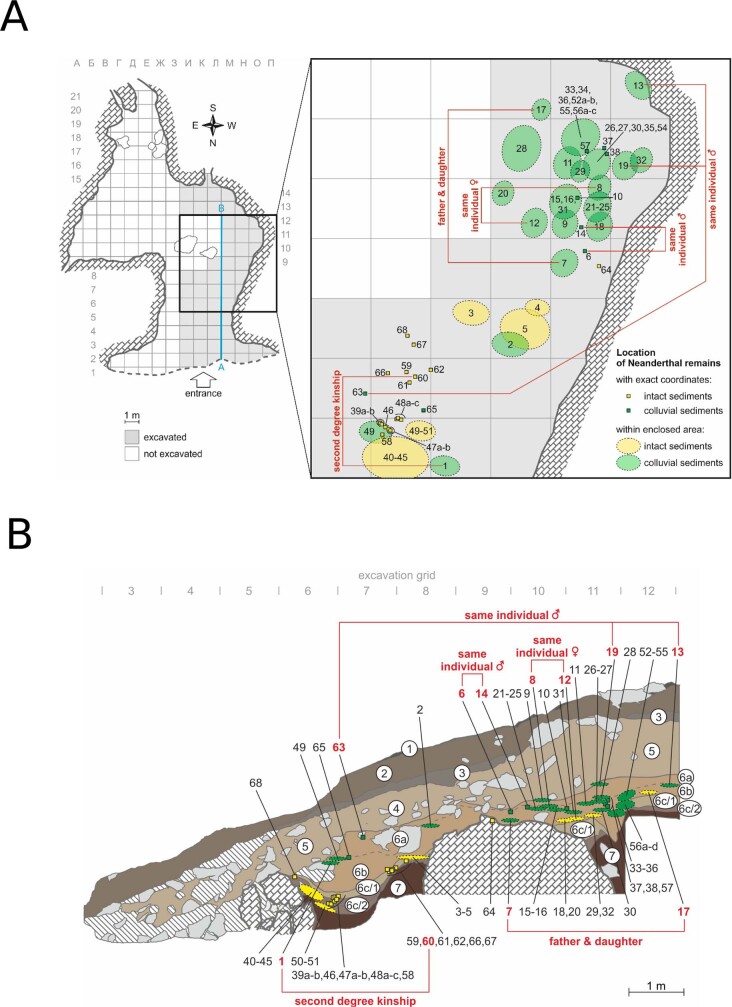
Verification
Claims the paper makes
The claims and statistics of this paper haven’t been checked yet.
Run the check — free, no account needed. It reads the open-access text and checks the sources it cites.
Claims other papers make about this one
Each is checked against this paper’s own text: does it say what the citing paper says it does?
In the citing paper
“They are within the range of values used in the literature ([5.3−10.3] × 10−10 mutations/nucleotide/year for the Y chromosome, and [1.30−2.74] × 10−8 mutations/nucleotide/year for mtDNA, according to SI Table 8.2 in ref. 98, giving a summary of mutation rates used in the literature).”
From Patrilineal segmentary systems provide a peaceful explanation for the post-Neolithic Y-chromosome bottleneck (2024) · cites this paper as [98]
Self-check
Percentages, sums and reported differences re-computed from the paper’s own numbers.
The self-check needs the paper’s full text.
Citations
Cites
The complete genome sequence of a Neanderthal from the Altai Mountains
Prüfer, K., Racimo, F., Patterson, N., Jay, F., Sankararaman, S., Sawyer, S., Heinze, A., Renaud, G., Sudmant, P. H., de Filippo, C., et al. (2014) · Nature · doi:10.1038/nature12886 · Cited by 2,254
Self-citationA high-coverage genome sequence from an archaic denisovan individual
Meyer, M., Kircher, M., Gansauge, M.-T., Li, H., Racimo, F., Mallick, S., Schraiber, J. G., Jay, F., Prüfer, K., de Filippo, C., et al. (2012) · Science · doi:10.1126/science.1224344 · Cited by 1,967
Self-citationThe Simons Genome Diversity Project: 300 genomes from 142 diverse populations
Mallick, S., Li, H., Lipson, M., Mathieson, I., Gymrek, M., Racimo, F., Zhao, M., Chennagiri, N., Nordenfelt, S., Tandon, A., et al. (2016) · Nature · doi:10.1038/nature18964 · Cited by 1,584
Self-citationRuns of homozygosity: windows into population history and trait architecture
Ceballos, F. C., Joshi, P. K., Clark, D. W., Ramsay, M., & Wilson, J. F. (2018) · Nature Reviews Genetics · doi:10.1038/nrg.2017.109 · Cited by 1,006 · cited 1×
“Long segments of homozygosity (greater than 10 cM) in an individual imply that their parents shared a very recent common ancestor around ten generations ago and were, therefore, probably part of a small community 5,36 .”
Nuclear DNA sequences from the Middle Pleistocene Sima de los Huesos hominins
Meyer, M., Arsuaga, J.-L., de Filippo, C., Nagel, S., Aximu-Petri, A., Nickel, B., Martínez, I., Gracia, A., de Castro, J. M. B., Carbonell, E., et al. (2016) · Nature · doi:10.1038/nature17405 · Cited by 584
Self-citationA mitochondrial genome sequence of a hominin from Sima de los Huesos
Meyer, M., Fu, Q., Aximu-Petri, A., Glocke, I., Nickel, B., Arsuaga, J.-L., Martínez, I., Gracia, A., de Castro, J. M. B., Carbonell, E., et al. (2014) · Nature · doi:10.1038/nature12788 · Cited by 534
Self-citationSeparating endogenous ancient DNA from modern day contamination in a Siberian Neandertal
Skoglund, P., Northoff, B. H., Shunkov, M. V., Derevianko, A. P., Pääbo, S., Krause, J., & Jakobsson, M. (2014) · Proceedings of the National Academy of Sciences · doi:10.1073/pnas.1318934111 · Cited by 499
A recent bottleneck of Y chromosome diversity coincides with a global change in culture
Karmin, M., Saag, L., Vicente, M., Sayres, M. A. W., Järve, M., Talas, U. G., Rootsi, S., Ilumäe, A.-M., Mägi, R., Mitt, M., et al. (2015) · Genome Research · doi:10.1101/gr.186684.114 · Cited by 485
Mountain gorilla genomes reveal the impact of long-term population decline and inbreeding
Xue, Y., Prado-Martinez, J., Sudmant, P. H., Narasimhan, V., Ayub, Q., Szpak, M., Frandsen, P., Chen, Y., Yngvadottir, B., Cooper, D. N., et al. (2015) · Science · doi:10.1126/science.aaa3952 · Cited by 473
Ivanov, P. L., Wadhams, M. J., Roby, R. K., Holland, M. M., Weedn, V. W., & Parsons, T. J. (1996) · Nature Genetics · doi:10.1038/ng0496-417 · Cited by 348
Research works printed but not linked: 38
- Green, R. E. et al. A draft sequence of the Neandertal genome. Science 328, 710–722 (2010). · DOI · Paper page
- Prüfer, K. et al. A high-coverage Neandertal genome from Vindija Cave in Croatia. Science 358, 655–658 (2017). · DOI · Paper page
- Hajdinjak, M. et al. Reconstructing the genetic history of late Neanderthals. Nature 555, 652–656 (2018). · DOI
- Bokelmann, L. et al. A genetic analysis of the Gibraltar Neanderthals. Proc. Natl Acad. Sci. USA 116, 15610–15615 (2019). · DOI
- Derevianko, A. P. et al. Multidisciplinary Studies of Chagyrskaya Cave–A Middle Paleolithic Site in Altai (Russian Academy of Sciences Siberian Branch Institute of Archaeology And Ethnography, 2018). · DOI
- Kolobova, K. A. et al. Archaeological evidence for two separate dispersals of Neanderthals into southern Siberia. Proc. Natl Acad. Sci. USA 117, 2879–2885 (2020). · DOI
- Arsuaga, J. L. et al. Neandertal roots: cranial and chronological evidence from Sima de los Huesos. Science 344, 1358–1363 (2014). · DOI · Paper page
- Higham, T. et al. The timing and spatiotemporal patterning of Neanderthal disappearance. Nature 512, 306–309 (2014). · DOI · Paper page
- Kappeler, P. M. & van Schaik, C. P. Evolution of primate social systems. Int. J. Primatol. 23, 707–740 (2002). · DOI
- Duveau, J., Berillon, G., Verna, C., Laisné, G. & Cliquet, D. The composition of a Neandertal social group revealed by the hominin footprints at Le Rozel (Normandy, France). Proc. Natl Acad. Sci. USA 116, 19409–19414 (2019). · DOI · Paper page
- Mayoral, E. et al. Tracking late Pleistocene Neandertals on the Iberian coast. Sci. Rep. 11, 4103 (2021). · DOI
- Vallverdú, J. et al. Sleeping activity area within the site structure of archaic human groups. Curr. Anthropol. 51, 137–145 (2010). · DOI
- Lalueza-Fox, C. et al. Genetic evidence for patrilocal mating behavior among Neandertal groups. Proc. Natl Acad. Sci. USA 108, 250–253 (2011). · DOI
- Vigilant, L. & Langergraber, K. E. Inconclusive evidence for patrilocality in Neandertals. Proc. Natl Acad. Sci. USA 108, E87 (2011). · DOI
- Derevianko, A. P., Markin, S. V. & Shunkov, M. V. The Sibiryachikha facies of the Middle Paleolithic of the Altai. Archaeol. Ethnol. Anthropol. Euras. 41, 89–103 (2013). · DOI
- Higham, T. F. G. Removing contaminants: a restatement of the value of isolating single compounds for AMS dating. Antiquity 93, 1072–1075 (2019). · DOI
- Slon, V. et al. The genome of the offspring of a Neanderthal mother and a Denisovan father. Nature 561, 113–116 (2018). · DOI · Paper page
- Petr, M. et al. The evolutionary history of Neanderthal and Denisovan Y chromosomes. Science 369, 1653–1656 (2020). · DOI
- Stewart, J. B. & Chinnery, P. F. The dynamics of mitochondrial DNA heteroplasmy: implications for human health and disease. Nat. Rev. Genet. 16, 530–542 (2015). · DOI
- Vernot, B. et al. Unearthing Neanderthal population history using nuclear and mitochondrial DNA from cave sediments. Science 372, eabf1667 (2021). · DOI
- Stewart, N. A., Gerlach, R. F., Gowland, R. L., Gron, K. J. & Montgomery, J. Sex determination of human remains from peptides in tooth enamel. Proc. Natl Acad. Sci. USA 114, 13649–13654 (2017). · DOI · Paper page
- Douka, K. et al. Age estimates for hominin fossils and the onset of the Upper Palaeolithic at Denisova Cave. Nature 565, 640–644 (2019). · DOI · Paper page
- Peter, B. M. 100,000 years of gene flow between Neandertals and Denisovans in the Altai mountains. Preprint at bioRxiv https://doi.org/10.1101/2020.03.13.990523 (2020). · DOI
- Zavala, E. I. et al. Pleistocene sediment DNA reveals hominin and faunal turnovers at Denisova Cave. Nature 595, 399–403 (2021). · DOI
- Jacobs, Z. et al. Timing of archaic hominin occupation of Denisova Cave in southern Siberia. Nature 565, 594–599 (2019). · DOI
- Robbins, M. M. & Robbins, A. M. Variation in the social organization of gorillas: life history and socioecological perspectives. Evol. Anthropol. 27, 218–233 (2018). · DOI
- Vigilant, L. et al. Reproductive competition and inbreeding avoidance in a primate species with habitual female dispersal. Behav. Ecol. Sociobiol. 69, 1163–1172 (2015). · DOI
- Langergraber, K. E. et al. How old are chimpanzee communities? Time to the most recent common ancestor of the Y-chromosome in highly patrilocal societies. J. Hum. Evol. 69, 1–7 (2014). · DOI
- Andrews, R. et al. Reanalysis and revision of the Cambridge reference sequence for human mitochondrial DNA. Nat. Genet. 23, 147 (1999). · DOI · Paper page
- Briggs, A. W. et al. Targeted retrieval and analysis of five Neandertal mtDNA genomes. Science 325, 318–321 (2009). · DOI
- Brown, S. et al. Identification of a new hominin bone from Denisova Cave, Siberia using collagen fingerprinting and mitochondrial DNA analysis. Sci. Rep. 6, 23559 (2016). · DOI · Paper page
- Douka, K. et al. Age estimates for hominin fossils and the onset of the Upper Palaeolithic at Denisova Cave. Nature 565, 640–644 (2019). · DOI · Paper page
- Sawyer, S. et al. Nuclear and mitochondrial DNA sequences from two Denisovan individuals. Proc. Natl Acad. Sci. USA. 112, 15696–15700 (2015). · DOI
- Krause, J. et al. The complete mitochondrial DNA genome of an unknown hominin from southern Siberia. Nature 464, 894–897 (2010). · DOI
- Slon, V. et al. A fourth Denisovan individual. Sci. Adv. 3, e1700186 (2017). · DOI
- Skaletsky, H. et al. The male-specific region of the human Y chromosome is a mosaic of discrete sequence classes. Nature 423, 825–837 (2003). · DOI
- Mendez, F. L. et al. An African American paternal lineage adds an extremely ancient root to the human Y chromosome phylogenetic tree. Am. J. Hum. Genet. 92, 454–459 (2013); erratum 92, 637 (2013). · DOI
- Viola, B. New Hominid Remains from Central Asia and Siberia: The Easternmost Neanderthals? PhD thesis, Vienna Univ. (2009).
Cited by
Guyon, L., Guez, J., Toupance, B., Heyer, E., & Chaix, R. (2024) · Nature Communications · doi:10.1038/s41467-024-47618-5 · Cited by 28
Enrichment of a subset of Neanderthal polymorphisms in autistic probands and siblings
Pauly, R., Johnson, L., Feltus, F. A., & Casanova, E. L. (2024) · Molecular Psychiatry · doi:10.1038/s41380-024-02593-7 · Cited by 11
Metadata
- Authors
- Skov, L., Peyrégne, S., Popli, D., Iasi, L. N. M., Devièse, T., Slon, V., Zavala, E. I., Hajdinjak, M., Sümer, A. P., Grote, S., Bossoms Mesa, A., López Herráez, D., Nickel, B., Nagel, S., Richter, J., Essel, E., Gansauge, M., Schmidt, A., Korlević, P., Comeskey, D., Derevianko, A. P., Kharevich, A., Markin, S. V., Talamo, S., Douka, K., Krajcarz, M. T., Roberts, R. G., Higham, T., Viola, B., Krivoshapkin, A. I., Kolobova, K. A., Kelso, J., Meyer, M., Pääbo, S., & Peter, B. M.
- Venue
- Nature
- Published
- 2022-10-19
- Volume
- 610
- Issue
- 7932
- Pages
- 519-525
- ISSN
- 0028-0836
- 1476-4687
- PMC
- PMC9581778
- Cited by
- 106
- References
- 14
- Language
- en
About these checks
Registry, retraction, Cites and statistics results are computed, not judged, with one exception: a printed reference that no index lists is read once by a model before it counts as a citation error. Claims are extracted by a model and kept only when their quote appears verbatim in the text; each cited source is then checked, with a model’s help, for whether it says what the claim relies on. Those verdicts can be wrong — read the claim’s quote and the cited source before relying on one.
Statistics and arithmetic are recomputed, not judged.
Confidence bands are shown only for fields calibrated on our annotated test set. None is calibrated yet, so no band is shown.
What counts as a claim ›How we measure confidence ›How we check this ›
Are you an author, or do you see a problem with this page? Request a review
