

The DOI matches its Crossref record; 78 of the 78 references it cites were found in a registry or an index.
Targeted protein degradation via intramolecular bivalent glues
Open accessPublished version of a preprint
Abstract
Targeted protein degradation is a pharmacological modality that is based on the induced proximity of an E3 ubiquitin ligase and a target protein to promote target ubiquitination and proteasomal degradation. This has been achieved either via proteolysis-targeting chimeras (PROTACs)—bifunctional compounds composed of two separate moieties that individually bind the target and E3 ligase, or via molecular glues that monovalently bind either the ligase or the target 1–4 . Here, using orthogonal genetic screening, biophysical characterization and structural reconstitution, we investigate the mechanism of action of bifunctional degraders of BRD2 and BRD4, termed intramolecular bivalent glues (IBGs), and find that instead of connecting target and ligase in trans as PROTACs do, they simultaneously engage and connect two adjacent domains of the target protein in cis . This conformational change ‘glues’ BRD4 to the E3 ligases DCAF11 or DCAF16, leveraging intrinsic target–ligase affinities that do not translate to BRD4 degradation in the absence of compound. Structural insights into the ternary BRD4–IBG1–DCAF16 complex guided the rational design of improved degraders of low picomolar potency. We thus introduce a new modality in targeted protein degradation, which works by bridging protein domains in cis to enhance surface complementarity with E3 ligases for productive ubiquitination and degradation.
Overview
The claims and statistics of this paper haven’t been checked yet.
Run the check — free, no account needed. It reads the open-access text and checks the sources it cites.
Integrity signals
Registry
Cites
Statistics
Figures
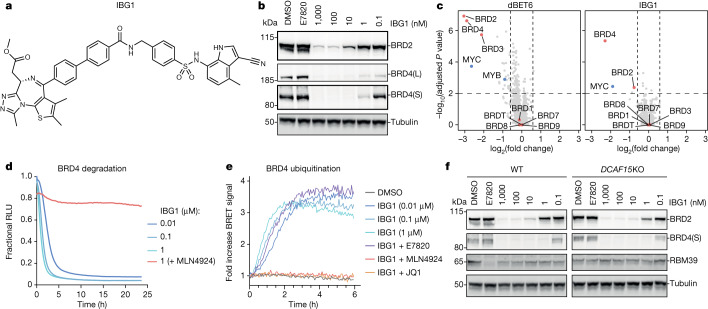
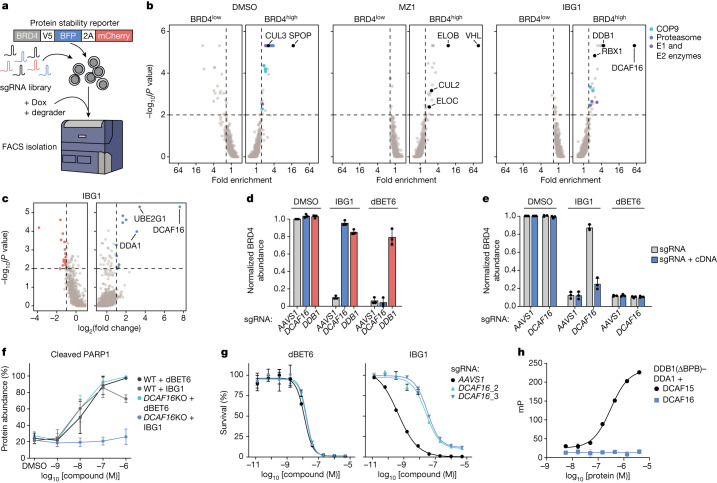
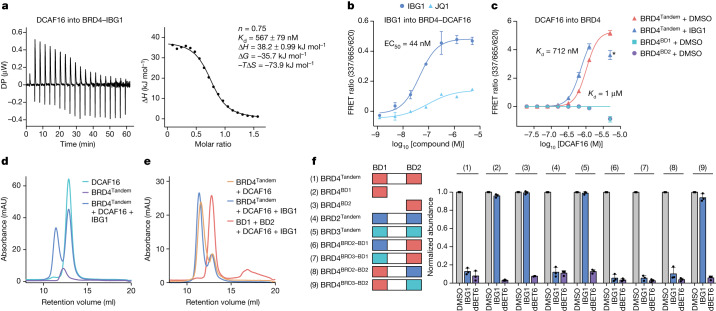
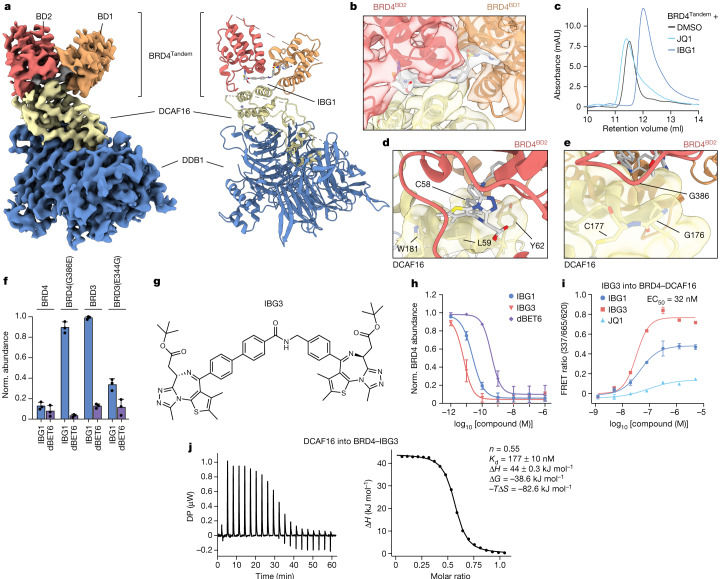
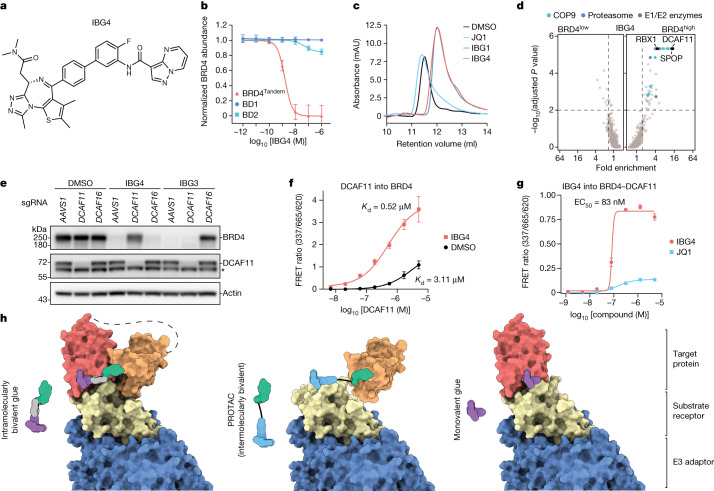
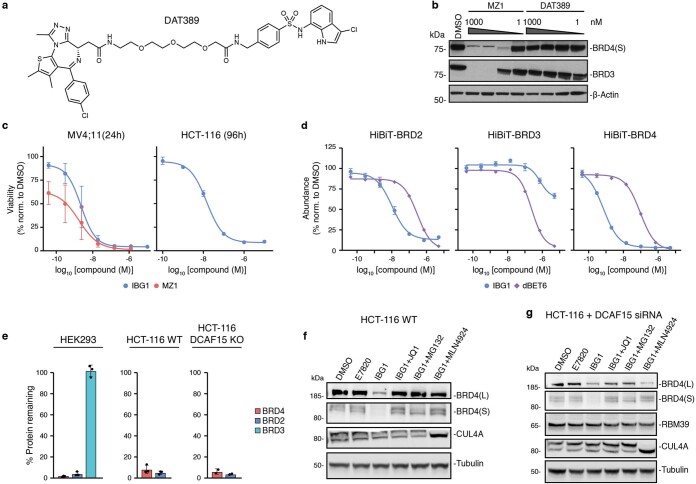
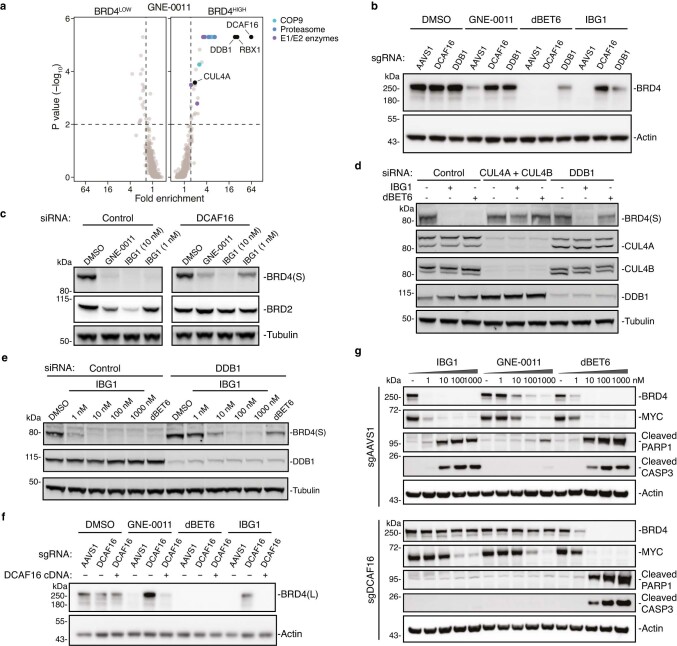
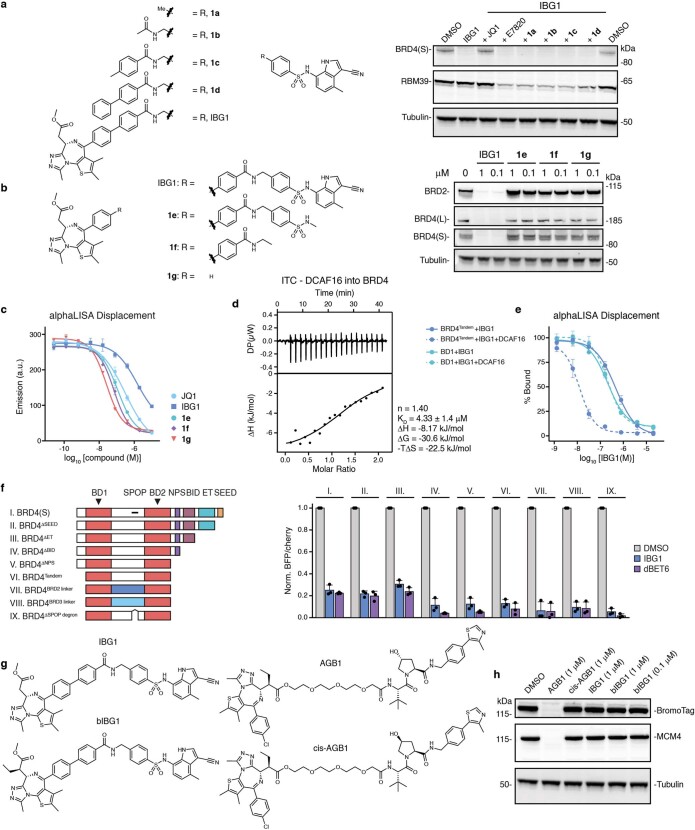
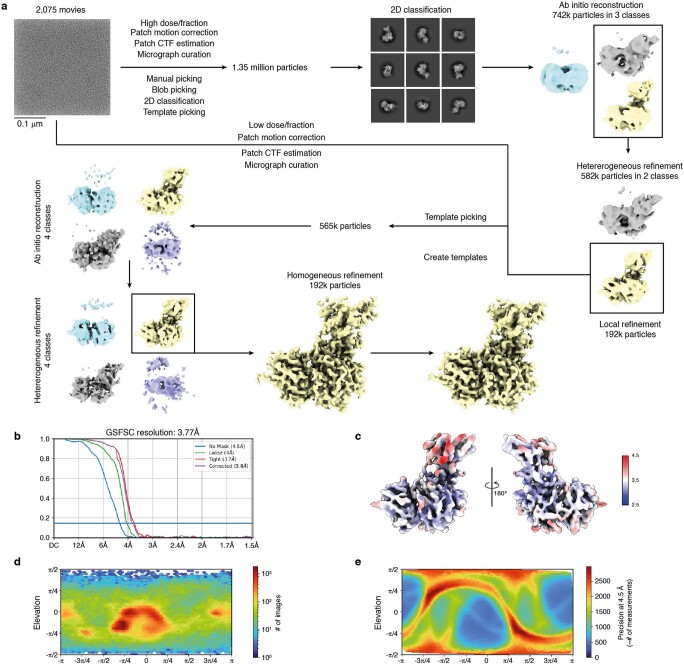
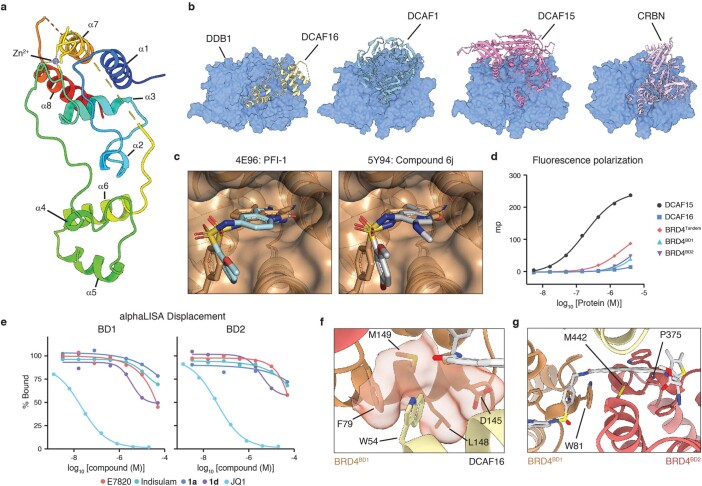
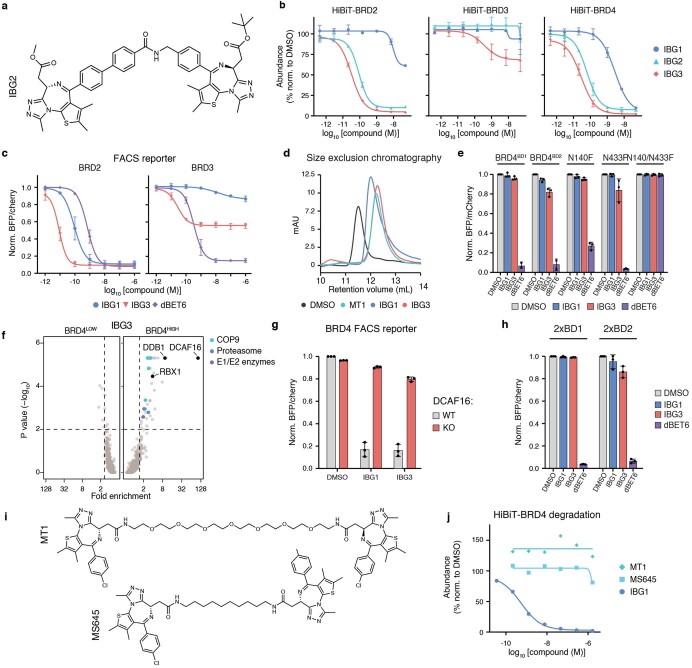
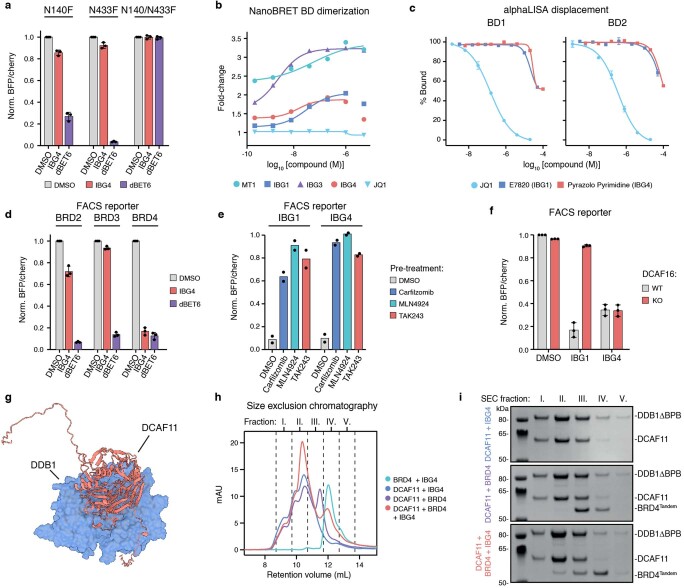
Verification
Claims the paper makes
The claims and statistics of this paper haven’t been checked yet.
Run the check — free, no account needed. It reads the open-access text and checks the sources it cites.
Claims other papers make about this one
Each is checked against this paper’s own text: does it say what the citing paper says it does?
The source backs part of the claim, not all of it — or backs it for a different population, condition or comparison.
In the citing paper
“Similarly, tR-FRet and fluorescence polarization (FP) assays offer robust scalable formats for detecting molecular glue-induced interactions in vitro (Simonetta et al. 2019;wang et al. 2021;Hsia et al. 2024;Kozicka et al. 2024).”
From From serendipity to strategy: molecular glue degraders in cancer therapeutics (2025) · cites this paper as Hsia et al. 2024
Experimental — accuracy not yet measuredThe source backs part of the claim, not all of it — or backs it for a different population, condition or comparison.
In the citing paper
“techniques using NanoBit®, NanoBRet® and HiBit® technologies enable sensitive detection of ternary complex formation and/or target degradation, both in live cells and cell extracts, making them particularly well-suited for identifying glue-induced degradation events (Bell et al. 2024;Hsia et al. 2024;ismail et al. 2024).”
From From serendipity to strategy: molecular glue degraders in cancer therapeutics (2025) · cites this paper as Hsia et al. 2024
Experimental — accuracy not yet measured
Self-check
Percentages, sums and reported differences re-computed from the paper’s own numbers.
The self-check needs the paper’s full text.
Citations
Cites
Highly accurate protein structure prediction with AlphaFold
Jumper, J., Evans, R., Pritzel, A., Green, T., Figurnov, M., Ronneberger, O., Tunyasuvunakool, K., Bates, R., Žídek, A., Potapenko, A., et al. (2021) · Nature · doi:10.1038/s41586-021-03819-2 · Cited by 43,764
Coot : model-building tools for molecular graphics
Emsley, P., & Cowtan, K. (2004) · Acta Crystallographica Section D Biological Crystallography · doi:10.1107/s0907444904019158 · Cited by 30,571
cryoSPARC: algorithms for rapid unsupervised cryo-EM structure determination
Punjani, A., Rubinstein, J. L., Fleet, D. J., & Brubaker, M. A. (2017) · Nature Methods · doi:10.1038/nmeth.4169 · Cited by 11,626
UCSF ChimeraX : Structure visualization for researchers, educators, and developers
Pettersen, E. F., Goddard, T. D., Huang, C. C., Meng, E. C., Couch, G. S., Croll, T. I., Morris, J. H., & Ferrin, T. E. (2020) · Protein Science · doi:10.1002/pro.3943 · Cited by 9,521
ColabFold - Making protein folding accessible to all
Mirdita, M., Schütze, K., Moriwaki, Y., Heo, L., Ovchinnikov, S., & Steinegger, M. (2021) · doi:10.1101/2021.08.15.456425 · Cited by 9,391
Universal sample preparation method for proteome analysis
Wiśniewski, J. R., Zougman, A., Nagaraj, N., & Mann, M. (2009) · Nature Methods · doi:10.1038/nmeth.1322 · Cited by 8,352
Liebschner, D., Afonine, P. V., Baker, M. L., Bunkóczi, G., Chen, V. B., Croll, T. I., Hintze, B., Hung, L.-W., Jain, S., McCoy, A. J., et al. (2019) · Acta Crystallographica Section D Structural Biology · doi:10.1107/s2059798319011471 · Cited by 7,953
The PRIDE database resources in 2022: a hub for mass spectrometry-based proteomics evidences
Perez-Riverol, Y., Bai, J., Bandla, C., García-Seisdedos, D., Hewapathirana, S., Kamatchinathan, S., Kundu, D. J., Prakash, A., Frericks-Zipper, A., Eisenacher, M., et al. (2022) · Nucleic Acids Research · doi:10.1093/nar/gkab1038 · Cited by 6,125
Optimized sgRNA design to maximize activity and minimize off-target effects of CRISPR-Cas9
Doench, J. G., Fusi, N., Sullender, M., Hegde, M., Vaimberg, E. W., Donovan, K. F., Smith, I., Tothova, Z., Wilen, C., Orchard, R., et al. (2016) · Nature Biotechnology · doi:10.1038/nbt.3437 · Cited by 4,637
Selective inhibition of BET bromodomains
Filippakopoulos, P., Qi, J., Picaud, S., Shen, Y., Smith, W. B., Fedorov, O., Morse, E. M., Keates, T., Hickman, T. T., Felletar, I., et al. (2010) · Nature · doi:10.1038/nature09504 · Cited by 4,262
Cited by
Sorted by citations
Items 101–200 of 222
Deng, L., Tian, E., Ma, T., Liang, S., Hu, S., Li, L., & Li, J. (2025) · Results in Chemistry · doi:10.1016/j.rechem.2025.102670 · Cited by 7
Molecular glues: A new path to the world of the unattainable
Khaledian, M., Sheikh, H., Babaei, F., Divsalar, A., Gharshasbi, M., Ottmann, C., Haertlé, T., Saboury, A. A., & Rasouli, M. (2025) · International Journal of Biological Macromolecules · doi:10.1016/j.ijbiomac.2025.148861 · Cited by 7
Gray, J. L., Xiao, Z., Rogga, V. V., Zhang, X., & Tate, E. W. (2026) · Journal of the American Chemical Society · doi:10.1021/jacs.5c12299 · Cited by 5
Proximity Binding Assay for PROTAC Ternary Complex Analysis
Ponzo, I., Soldà, A., Crowe, C., Dahl, G., Jahodová, T., Heerwig, A., Geschwindner, S., Ciulli, A., & Rant, U. (2026) · ACS Sensors · doi:10.1021/acssensors.5c04944 · Cited by 7
Self-citationDual E3 ligase recruitment by monovalent degraders for tunable SMARCA 2/4 degradation
Spiteri, V. A., Segal, D., Correa-Sáez, A., Iso, K., Casement, R., Ordoño, M. M. I., Nakasone, M. A., Sathe, G. J., Schätz, C., Peters, H. E., et al. (2026) · Nature Chemical Biology · doi:10.1038/s41589-026-02224-y · Cited by 16
Self-citationMethods to Study the Molecular Mechanism and Drive the Design of Protein Degraders
Crowe, C., & Ciulli, A. (2026) · Chemical Reviews · doi:10.1021/acs.chemrev.5c00800 · Cited by 6
Self-citationSite-resolved assessment of targeted protein degradation
Moreno-Ballesteros, R., Pembridge, T., Beniwal, G., & Virdee, S. (2025) · Cell chemical biology · doi:10.1016/j.chembiol.2025.06.002 · Cited by 5
Unlocking DCAFs To Catalyze Degrader Development: An Arena for Innovative Approaches
Miao, Q., Kadam, V. D., Mukherjee, A., Tan, Z., & Teng, M. (2023) · Journal of Medicinal Chemistry · doi:10.1021/acs.jmedchem.3c01209 · Cited by 7
Synthetic modification of protein surfaces to mediate induced-proximity pharmacology
Jones, L. H. (2024) · RSC Medicinal Chemistry · doi:10.1039/d4md00388h · Cited by 6
DET1 dynamics underlie cooperative ubiquitination by CRL4 DET1-COP1 complexes
Burgess, A. E., Loughran, T. A., Turk, L. S., Nyvall, H. G., Dunlop, J. L., Jamieson, S. A., Curry, J. R., Burke, J. E., Filipčík, P., Brown, S. H. J., et al. (2025) · Science Advances · doi:10.1126/sciadv.adq4187 · Cited by 5
Boosting bioavailability of PROTACs for ovarian cancer: From chemistry to clinical translation
Rejili, M. S., Hussain, M. S., Haouala, F., Khan, Y., Maqbool, M., & Gupta, G. (2025) · Bioorganic Chemistry · doi:10.1016/j.bioorg.2025.109097 · Cited by 6
BRD4 as an emerging epigenetic therapeutic target for inflammatory bowel disease
Ma, Z., Bolinger, A. A., Pinchuk, I. V., Tian, B., & Zhou, J. (2024) · Advances in pharmacology · doi:10.1016/bs.apha.2024.10.008 · Cited by 5
BromoCatch: a self-labelling tag platform for protein analysis and live cell imagingPreprint
Rodriguez-Rios, M., Craigon, C., Nakasone, M. A., Bond, A. G., Dorward, M., Edmonds, A. K., Norley, M. C., Arnold, R. E., Wood, P. M., Reynolds, S., et al. (2025) · bioRxiv (Cold Spring Harbor Laboratory) · doi:10.1101/2025.04.07.647551 · Cited by 5
Self-citationZollman, D., & McAulay, K. (2024) · Nature Chemical Biology · doi:10.1038/s41589-024-01757-4 · Cited by 4
Liu, C., Chen, G., Liao, J., Wu, D., Chen, X., & Wang, N. (2025) · Journal of Gastroenterology and Hepatology · doi:10.1111/jgh.70015 · Cited by 4
Design of conditional and tumor-activated PROTACs for selective degradation in lung cancer
Lin, L., Zheng, F., Wei, H., Wu, X., Yan, H., & Ding, Y. (2025) · European Journal of Medicinal Chemistry · doi:10.1016/j.ejmech.2025.118432 · Cited by 4
Targeted protein degradation: species, diseases and efficient utilization
Yue, T., He, J., & Hou, J. (2025) · Journal of Translational Medicine · doi:10.1186/s12967-025-07610-z · Cited by 5
Zhang, Y., Li, L., Xu, J., Che, C.-C., Jia, J., Lu, H., You, Q., & Xu, X. (2026) · Molecules · doi:10.3390/molecules31030459 · Cited by 4
Targeted degradation of BRD4 by PROTACs: advances in cancer therapy
Hong, Y., Liu, X., Li, Y., Yu, M., Wang, C., Nie, C., & Xu, S. (2026) · Chemical Communications · doi:10.1039/d5cc05563f · Cited by 5
Sung, J., Seo, Y., & Lee, J.-Y. (2026) · Molecular Therapy · doi:10.1016/j.ymthe.2026.05.031 · Cited by 4
Zhang, R., Zheng, Y., Xiang, F., & Zhou, J. (2024) · European Journal of Medicinal Chemistry · doi:10.1016/j.ejmech.2024.116756 · Cited by 5
Liu, Y., Wang, H., Wang, R., Yu, J. H., Shi, J., Chen, R.-Y., Yang, G., & Chen, J. (2024) · International Journal of Biological Macromolecules · doi:10.1016/j.ijbiomac.2024.138099 · Cited by 5
Hughes, S. J., Stec, W. J., Davies, C. T. R., McGarry, D. J., Williams, A., Barrantes, I. D. B., Harris, R., Owens, D. D. G., Fawcett, A., Hellicar, J., et al. (2025) · bioRxiv (Cold Spring Harbor Laboratory) · doi:10.1101/2024.12.31.630899 · Cited by 4
Self-citationA Glutathione S-Transferase Pi Molecular Glue Tethers Splicing Factors and Remodels Cell Metabolism
Leace, D. M., Ware, M. L., Murtagh, O. L., Tsai, H.-K., Chang, C., & Hsu, K. (2025) · Journal of the American Chemical Society · doi:10.1021/jacs.5c06951 · Cited by 3
Bai, X., Wang, Y., Zhang, X., Niu, C., Yang, G., Yuan, D., Wei, Y., Zheng, L., Song, X., Bao, Y., et al. (2025) · Cell Reports Physical Science · doi:10.1016/j.xcrp.2025.102866 · Cited by 3
Responsive Plasmonic Reporters Decrypt Nanoparticle-Induced Single Membrane Protein Degradation
Wang, J., Tan, J. Y., Zhang, Z., Wang, X., Zhao, J., Li, J., & Wang, C. (2025) · Journal of the American Chemical Society · doi:10.1021/jacs.5c12343 · Cited by 3
Hu, Y., Didi, K., Cribbs, A. P., & Sun, J. (2025) · Computational and Structural Biotechnology Journal · doi:10.1016/j.csbj.2025.10.028 · Cited by 3
Diversified design strategies for small-molecule PROTACs: How do we select?
Chen, Q., & Liang, J.-H. (2026) · European Journal of Medicinal Chemistry · doi:10.1016/j.ejmech.2026.118593 · Cited by 3
Molecular glue degraders: Rational design, specificity engineering, and advanced delivery
Ma, L., Wang, N., Zhu, J., Wu, L., He, S., & Zhang, B. (2026) · Acta Pharmaceutica Sinica B · doi:10.1016/j.apsb.2026.02.020 · Cited by 5
Meng, S., Meng, Y., Yang, X., Yu, W., Li, B., Liu, T., Zhang, J., Ren, X., & Zhang, L. (2025) · BMC Biology · doi:10.1186/s12915-025-02153-7 · Cited by 3
Multivalent nucleosome scaffolding by bromodomain and extraterminal domain tandem bromodomains
Olp, M. D., Bursch, K. L., Wynia‐Smith, S. L., Nuñez, R., Goetz, C. J., Jackson, V. E., & Smith, B. C. (2025) · Journal of Biological Chemistry · doi:10.1016/j.jbc.2025.108289 · Cited by 3
Proximity Biosensor Assay for PROTAC Ternary Complex AnalysisPreprint
Ponzo, I., Soldà, A., Crowe, C., Dahl, G., Geschwindner, S., Ciulli, A., & Rant, U. (2024) · ChemRxiv · doi:10.26434/chemrxiv-2024-8w4zb · Cited by 2
Self-citationAnsari, M. S., Chauhan, V., Singh, A., Akhtar, A., Chaudhary, N., Tyagi, R., Divya, Husain, K., Sharma, S., Alam, R., et al. (2025) · bioRxiv (Cold Spring Harbor Laboratory) · doi:10.1101/2025.06.12.658477 · Cited by 3
Insights from human NF-κB knockouts
Pfisterer, M., Dreute, J., & Schmitz, M. L. (2025) · EMBO Reports · doi:10.1038/s44319-025-00500-x · Cited by 2
Disruption of the SAGA CORE triggers collateral degradation of KAT2A
Batty, P., Beneder, H., Schätz, C., Onea, G., Zaczek, M., Kutschat, A. P., Abele, M., Müller, S., Superti‐Furga, G., Winter, G. E., et al. (2026) · Nature Communications · doi:10.1038/s41467-026-71613-7 · Cited by 2
Self-citationChromatin Regulatory Targets for Anticancer Therapeutics
Barta, P. A., Carter, T. R., & Erb, M. A. (2025) · Chemical Reviews · doi:10.1021/acs.chemrev.5c00231 · Cited by 2
Jiang, F., Li, H., Sun, Q., Huang, J., Chen, X., Liang, Q., Luo, X., Zhang, W., He, D., & Shen, X. (2025) · European Journal of Medicinal Chemistry · doi:10.1016/j.ejmech.2025.118524 · Cited by 3
Zhang, J., Huang, L., Li, S., Li, Y., Tan, Y., Liu, T., & Li, Z. (2026) · Journal of Medicinal Chemistry · doi:10.1021/acs.jmedchem.6c00889 · Cited by 4
Su, G., Wang, Y., & Yao, L. (2026) · Pharmaceuticals · doi:10.3390/ph19070988 · Cited by 2
Chen, H., Fu, R., & Wu, Z. (2026) · Acta Pharmacologica Sinica · doi:10.1038/s41401-026-01877-8 · Cited by 3
DCAF11-dependent molecular glue degrader activated by glutathionylation
Yoon, H., Wachter, F., Barrett, K., Jin, C., Rodríguez-Pöhnlein, A., Rutter, J. C., Lumpkin, R. J., Metivier, R. J., Donovan, K. A., Baek, K., et al. (2026) · Nature · doi:10.1038/s41586-026-10873-1 · Cited by 3
Emerging pharmacology of targeted protein degraders
Barghout, S. H., & Eldeeb, M. A. (2025) · Journal of Pharmacology and Experimental Therapeutics · doi:10.1016/j.jpet.2025.103694 · Cited by 2
Engineering CRBN for rapid identification of next generation bindersPreprint
Bailey, H., Eisert, J., Vollrath, J., Leibrock, E.-M., Kondratov, I. S., Matviiuk, T., Tolmachova, N. A., Langer, J. D., Wegener, A. A., Sorrell, F. J., et al. (2024) · bioRxiv (Cold Spring Harbor Laboratory) · doi:10.1101/2024.01.18.576231 · Cited by 3
Making transient complexes stick
Wang, Y., Mouli, M. S. S. V., Ma, M., & Ferguson, F. M. (2024) · Nature Chemical Biology · doi:10.1038/s41589-024-01649-7 · Cited by 1
Molecular Glues and Molecular Glue Degraders: Mechanisms, Design, and Therapeutic Applications
Shi, H. (2024) · Transactions on Materials Biotechnology and Life Sciences · doi:10.62051/r1m5q711 · Cited by 1
Computational approaches to aid PROTAC drug discovery
Chakraborti, S., & McAulay, K. (2025) · Elsevier eBooks · doi:10.1016/b978-0-443-29808-0.00004-2 · Cited by 1
Yang, Y., Zhu, R., Liang, J., Yan, H., Zhang, H., Tian, J., Zhang, R., Liu, X., Liu, Y., Li, H., et al. (2026) · JACS Au · doi:10.1021/jacsau.5c01404 · Cited by 1
Wang, X., Deng, X., Qiu, L., Liu, J., Shen, H., Du, H., Li, W., Song, L., Deng, W., Dong, X., et al. (2026) · Nature Communications · doi:10.1038/s41467-026-68454-9 · Cited by 1
Arylidene-Thiazoldione Scaffold Acts as the E3 Ligand of DCAF11 for PROTAC Design
Liang, J., Liu, Y., Zhao, M., Chen, L., Qin, J., Ma, W., Wang, Y., Wu, H., Tian, R., Wei, T., et al. (2026) · Journal of Medicinal Chemistry · doi:10.1021/acs.jmedchem.5c02188 · Cited by 1
PROTAC-based protein degradation: a window of opportunity for melanoma therapy
Gentile, G., D’Aguanno, S., Martile, M. D., Petricca, A., Valentini, E., Scalera, S., & Bufalo, D. D. (2026) · Journal of Biomedical Science · doi:10.1186/s12929-026-01225-2 · Cited by 1
Pan, Y., Hua, S., Yang, R., He, Q., Xu, Y., Jiang, Z., Gong, X., Zhang, S., Wang, X., Yu, H., et al. (2026) · British Journal of Pharmacology · doi:10.1111/bph.70434 · Cited by 1
Chang, X., Yu, M., Wei, P., Cheng, J., & Wu, Y. (2026) · Materials Today Bio · doi:10.1016/j.mtbio.2026.103162 · Cited by 1
Arji, S., Shen, Z., Welch, S., ElMahdaoui, F., Bahadur, A., Lee, E., Lee, H., Wu, S.-C. P., Konshina, E., Ayubali, B., et al. (2026) · Biomarker Research · doi:10.1186/s40364-026-00911-5 · Cited by 1
Pham, J. A., Thaingtamtanha, T., McLeish, W., Lefebvre, D., Uguccioni, S. M., Filip, R., Gentile, F., & Pezacki, J. P. (2026) · Journal of the American Chemical Society · doi:10.1021/jacs.5c22859 · Cited by 1
Balıkçı, E., & Akıl, C. (2026) · Sensors · doi:10.3390/s26103105 · Cited by 2
Al-Karmalawy, A. A., Attia, M. I., Yousef, T. A., Al-Qazzan, M. B., Al-Akeedi, M., Khatib, A. O. A., & Hawas, S. S. (2026) · Archiv der Pharmazie · doi:10.1002/ardp.70261 · Cited by 1
Nisar, A., Khan, S., Li, W., (56049), X. Z., & He, Y. (2026) · Pharmacology & Therapeutics · doi:10.1016/j.pharmthera.2026.109055 · Cited by 1
Rouhimoghadam, M., Kang, C., Gartman, J. A., Senaweera, S., Zoi, I., Jiu, A. Y., Ronau, J. A., Shergalis, A. G., Tang, H., McLoughlin, S. M., et al. (2026) · Cell chemical biology · doi:10.1016/j.chembiol.2026.05.019 · Cited by 1
Survey of the human proteostasis network: the ubiquitin-proteasome system
Elsasser, S., Powers, E. T., Stoeger, T., Sui, X., Kurtzbard, R. D., Martínez-Botía, P., Wangeline, M. A., Gama, A. R., Huttlin, E. L., Elia, L. P., et al. (2026) · Autophagy · doi:10.64898/2026.03.13.711689 · Cited by 11
Back in Person: Frontiers in Medicinal Chemistry 2023
Gehringer, M., Pape, F., Méndez, M. M., Barbie, P., Lopez, A. U., Lefranc, J., Klingler, F., Heßler, G., Langer, T., Diamanti, E., et al. (2023) · ChemMedChem · doi:10.1002/cmdc.202300344 · Cited by 1
Proximity-inducing pharmacology
Winter, G. E., & Mayor‐Ruiz, C. (2023) · Nature Chemical Biology · doi:10.1038/s41589-023-01492-2 · Cited by 1
Self-citationGerhartz, J., & Nowak, R. P. (2024) · Cell chemical biology · doi:10.1016/j.chembiol.2024.05.014 · Cited by 1
Covalent Bifunctional Molecules (CBMs): Achievements and Challenges
Xin, Y., Chen, F., You, Q., Wang, L., & Zhang, Q. (2025) · Medicinal Research Reviews · doi:10.1002/med.70011 · Cited by 1
DET1 dynamics underlie co-operative ubiquitination by CRL4 DET1 -COP1 complexesPreprint
Burgess, A. E., Loughran, T. A., Turk, L. S., Dunlop, J. L., Jamieson, S. A., Curry, J. R., Filipčík, P., Brown, S. H. J., & Mace, P. D. (2024) · bioRxiv (Cold Spring Harbor Laboratory) · doi:10.1101/2024.06.08.598067 · Cited by 1
Shishikura, K., & Matthews, M. L. (2024) · ACS Central Science · doi:10.1021/acscentsci.4c01093 · Cited by 1
Bivalent ligands as a new universal chemotype of BCL6 degrader by inducing aggregationPreprint
Hu, R., Hu, X.-T., Yang, Y.-Y., Luo, P., Li, C., Liu, Z., Yu, L., & Wang, N. (2025) · bioRxiv (Cold Spring Harbor Laboratory) · doi:10.1101/2025.02.25.638777 · Cited by 1
Targeted Protein Degradation: From Basic Science to Therapeutic Applications
Zhu, R., Tang, X., & Zhang, H. (2025) · ACS Chemical Biology · doi:10.1021/acschembio.5c00067 · Cited by 1
Crowe, C., Salerno, A., Sathe, G. J., Marsh, G. P., Maple, H. J., & Ciulli, A. (2025) · bioRxiv (Cold Spring Harbor Laboratory) · doi:10.1101/2025.11.18.689129 · Cited by 1
Self-citationTargeting proteins with bivalent glues
Crunkhorn, S. (2024) · Nature Reviews Drug Discovery · doi:10.1038/d41573-024-00044-0
Covalency in PROTACs: Mechanisms and applications
Geiger, T. M., & Nowak, R. P. (2024) · Annual reports in medicinal chemistry · doi:10.1016/bs.armc.2024.10.001
Eliminating Aggressive Cancers via PROTAC-like Inducers of FerroptosisPreprint
Oknin-Vaisman, A., Panda, D., Novak, R., Bitman-Lotan, E., Pahor, N., Ahmed, Y. A., Kamnesky, G., Diefenbacher, M. E., Brik, A., & Orian, A. (2024) · bioRxiv (Cold Spring Harbor Laboratory) · doi:10.1101/2024.12.28.630572
Hales, L. T., Mountford, S. J., Takawy, M., Colledge, D., Maher, B. M., Shortt, J., Thompson, P. E., Greenall, S. A., & Warner, N. (2025) · RSC Medicinal Chemistry · doi:10.1039/d5md00118h
Rational Design of CDK12/13 and BRD4 Molecular Glue Degraders
Zhuang, Z., Byun, W. S., Kozicka, Z., Donovan, K. A., Dwyer, B. G., Thornhill, A. M., Jones, H. M., Jiang, Z., Zhu, X., Fischer, E. S., et al. (2025) · Angewandte Chemie · doi:10.1002/ange.202508427
Yadav, S. K., Maurya, M. K., Tyagi, C., Rai, R., Bhat, B., & Das, M. (2025) · Springer eBooks · doi:10.1007/978-981-96-6202-9_4
Degraders of proteins in epigenetic regulation
Li, T., Hu, J., Li, L., Kong, C., Han, N., Leng, F., Xu, Z., & Yan, Y. (2025) · Elsevier eBooks · doi:10.1016/b978-0-443-21816-3.00012-9
Yang, L., Duan, H., Mao, X., Li, B., Che, J., & Dong, X. (2025) · Elsevier eBooks · doi:10.1016/b978-0-443-21816-3.00004-x
PROTACs as New Tools to Study Platelet Function
Trory, J. S., May, C., & Hers, I. (2025) · Springer eBooks · doi:10.1007/978-3-031-96344-5_27
Inhibitors and degraders of epigenetic regulation in cancer
Gao, P., Kanıskan, H. Ü., & Jin, J. (2025) · Elsevier eBooks · doi:10.1016/b978-0-443-29808-0.00037-6
Progress on molecular glue degraders
Chen, J., Deng, Z., Li, H., & Liu, L. (2025) · Scientia Sinica Chimica · doi:10.1360/ssc-2025-0228
Schneider, L. A., Bendel, A. M., Baur, R., & Thomä, N. H. (2025) · Nature Chemical Biology · doi:10.1038/s41589-025-02059-z
Ferroptosis governs lymphatic vessel growth and regressionPreprint
Drekolia, M.-K., Wang, D., Chen, Y., Du, Y., Wittig, J., Xu, R., Schilling, D., Aliraj, B., Mettner, J., Gupta, L., et al. (2025) · bioRxiv (Cold Spring Harbor Laboratory) · doi:10.1101/2025.11.18.689033
Self-citationTargeting the Ubiquitin-Proteasome System in cancer
Spallek, R., McLaughlin, C., & Sapkota, G. P. (2025) · Elsevier eBooks · doi:10.1016/b978-0-443-29808-0.00078-9
Emerging Approaches for Targeted Protein Degradation
(2025) · Genetic Engineering & Biotechnology News · doi:10.1089/gen.45.03.10
CBL ubiquitin ligase targets translation as a degrader E3
Wicks, A. T., Buetow, L., Suzuki, T., Schmidt, T., Lilla, S., Macmillan-Jones, A. L., Turney, J., Gohlke, A., Bushell, M., Hock, A., et al. (2025) · Chemical Science · doi:10.1039/d5sc06141e
Sun, W., Hu, Y., Lan, T., Ma, Y., Wu, Y., Pan, C., Mai, L., & Lin, Z. (2026) · Discover Oncology · doi:10.1007/s12672-026-04471-w
Scalable insect cell expression and purification screening applied to CRL4-DCAF substrate receptors
(2026) · doi:10.1016/j.pep.2026.106907
Self-citationMolecular Glue Degraders Redefining Targeted Therapies From Discovery to Therapeutic Applications
Wen, J., Yu, J., Wen, W., & Jiang, B. (2026) · MedComm – Oncology · doi:10.1002/mog2.70058
Wang, K., Kenny, S., Chagan, Z., Li, L., Das, C., & Liu, X. (2026) · Structure · doi:10.1016/j.str.2026.02.015
Yamanaka, S., Nagaoka, K., Shoya, Y., Nishino, K., Mikura, Y., Tanaka, K., Konishi, K., Hasegawa, Y., Hijikata, A., Kosako, H., et al. (2026) · Molecular Cell · doi:10.1016/j.molcel.2026.03.004 · Cited by 1
A new 4-atom linker enables PROTAC development and imaging
Letsios, S., Carrasco, G., Lee, M., Wagiet, M., Madureira, M., Samways, M. L., Khan, Z., Brunton, V. G., Grubisha, O., & Hulme, A. N. (2026) · RSC Chemical Biology · doi:10.1039/d6cb00127k
Tewari, A., Pawar, A. B., & Roy, S. (2026) · In Silico Research in Biomedicine · doi:10.1016/j.insi.2026.100372 · Cited by 1
Wu, Y.-X., Wen, Y.-H., Li, Q.-H., & Zhang, L. (2026) · Translational research · doi:10.1016/j.trsl.2026.05.004
A Rapid Binder Discovery Workflow for Engineering Mini-Protein Degraders
Yang, J. K., Styles, M. J., Aphicho, K., Asada, H., Komatsu, S., Pineda, E., Hosseinibarkooie, S., Stein, B., Matsuzaki, J., Odunsi, K., et al. (2026) · Journal of the American Chemical Society · doi:10.1021/jacs.6c00146
Shen, M., Zhang, H., Chen, M., Yang, J., Yuchi, Z., 张华巍, & Liu, L. (2026) · Cell Reports · doi:10.1016/j.celrep.2026.117502
Cao, X., Huang, X., Song, C., Shi, S., Zhu, Y., Zheng, L., Liang, G., & Chen, L. (2026) · European Journal of Medicinal Chemistry · doi:10.1016/j.ejmech.2026.119034
Discovery of ferroptosis-inducing R4VP compounds for targeting aggressive cancers
Oknin-Vaisman, A., Panda, D., Novak, R., Kheshaiboun, G., Bitman-Lotan, E., Gandhesiri, S., Kazi, R. S., Pahor, N., zu Herrnsheim, V. V. H., Ahmad, Y. A., et al. (2026) · Oncogene · doi:10.1038/s41388-026-03829-2
Induced Estrogen Receptor SUMOylation drives SERD activityPreprint
Hinterndorfer, M., Schätz, C., Schmitt, S., Schoenlein, M., Hoi, D. M., Kręcioch, I., Frommelt, F., Shlei, M., Kater, L., Pačesa, M., et al. (2026) · bioRxiv (Cold Spring Harbor Laboratory) · doi:10.64898/2026.06.26.734426
Self-citationFan, X., Zhao, H., Wu, B., Lv, Y., Chen, W., Chen, Q., Hu, L., Yu, S., Wang, J., He, Y., et al. (2026) · Biochemical and Biophysical Research Communications · doi:10.1016/j.bbrc.2026.154207
Li, C., Wang, X., He, A., Bao, T., Zhuang, W., He, C., & Yang, Y. (2026) · Pharmaceutics · doi:10.3390/pharmaceutics18070887
O’Leary, K. M., Ślężak, T., Le, D. A., & Kossiakoff, A. A. (2026) · Journal of Molecular Biology · doi:10.1016/j.jmb.2026.169953
Metadata
- Authors
- Hsia, O., Hinterndorfer, M., Cowan, A. D., Iso, K., Ishida, T., Sundaramoorthy, R., Nakasone, M. A., Imrichova, H., Schätz, C., Rukavina, A., Husnjak, K., Wegner, M., Correa-Sáez, A., Craigon, C., Casement, R., Maniaci, C., Testa, A., Kaulich, M., Dikic, I., Winter, G. E., & Ciulli, A.
- Affiliations
- University of Dundee (GB)
- Austrian Academy of Sciences (AT)
- Goethe University Frankfurt (DE)
- Corresponding author
- Winter, Georg E.
- Ciulli, Alessio
- ORCID
- Hsia, Oliver
- Hinterndorfer, Matthias
- Cowan, Angus D.
- Iso, Kentaro
- Ishida, Tasuku
- Sundaramoorthy, Ramasubramanian
- Nakasone, Mark A.
- Imrichova, Hana
- Schätz, Caroline
- Rukavina, Andrea
- Husnjak, Koraljka
- Wegner, Martin
- Correa-Sáez, Alejandro
- Craigon, Conner
- Casement, Ryan
- Maniaci, Chiara
- Testa, Andrea
- Kaulich, Manuel
- Dikic, Ivan
- Winter, Georg E.
- Ciulli, Alessio
- Venue
- Nature
- Published
- 2024-02-21
- Volume
- 627
- Issue
- 8002
- Pages
- 204-211
- ISSN
- 0028-0836 (ISSN-L)
- 1476-4687
- PMC
- PMC10917667
- OpenAlex
- W4391994105
- Cited by
- 222
- References
- 78
- Citations by year
- 2026: 68 · 2025: 86 · 2024: 58
- FWCI
- 28.86
- Type
- journal article
- Language
- en
- Open access
- hybrid
- doi.org
- Locations
- Nature (publishedVersion, cc-by)
- bioRxiv (Cold Spring Harbor Laboratory) (acceptedVersion, cc-by)
- PubMed Central (publishedVersion, cc-by)
- PubMed (publishedVersion)
- RePEc: Research Papers in Economics (submittedVersion)
- Discovery Research Portal (University of Dundee) (submittedVersion, cc-by)
- Publication Server of Goethe University Frankfurt am Main (Goethe University Frankfurt) (submittedVersion, cc-by)
- Funders
- GlaxoSmithKline
- McGill University
- University of Dundee
- Wellcome Trust (223816/Z/21/Z)
- European Federation of Pharmaceutical Industries and Associations (FP7/20072013, 875510)
- Foghorn Therapeutics
- European Commission (223816, 2007–2013, FP7 2007-2013, HORIZON2020, H2020-MSCA-IF-2020, H2020, 101024945, FP7/2007, H2020‐MSCA‐IF, 875510, H2020-MSCA, 851478)
- European Synchrotron Radiation Facility (ID23-2)
- Österreichischen Akademie der Wissenschaften (IF-2020, P7909, P32125)
- Austrian Science Fund (P31690, P 32125, P7909)
- Universität Wien
- Eisai
- Medizinische Universität Wien
- Innovative Medicines Initiative (FP7/2007‐2013, 875510, H2020)
- Horizon 2020 Framework Programme (FP7/2007-2013, H2020-MSCA, H2020-MSCA-IF-2020, 875510)
- Medical Research Council
- H2020 Marie Skłodowska-Curie Actions (H2020-MSCA-IF-2020, H2020, H2020-MSCA-IF, MSCA-IF-2020, FP7/2007-2013, H2020-MSCA, HORIZON2020)
- Topics
- Life Sciences › Biochemistry, Genetics and Molecular Biology › Molecular Biology › Protein Degradation and Inhibitors
- Life Sciences › Biochemistry, Genetics and Molecular Biology › Molecular Biology › Ubiquitin and proteasome pathways
- Physical Sciences › Chemistry › Organic Chemistry › Chemical Synthesis and Analysis
- Keywords
- targeted protein degradation, PROTACs, molecular glues, BRD4, BRD2, E3 ubiquitin ligase, ubiquitination, proteasomal degradation, ternary complex structure, bromodomain proteins
- MeSH terms
- Protein Domains, Bromodomain Containing Proteins, Proteolysis Targeting Chimera, Nuclear Proteins, Protein Binding, Substrate Specificity, Transcription Factors, Drug Design, Cell Cycle Proteins, Ubiquitin-Protein Ligases, Proteasome Endopeptidase Complex, Ubiquitination, Proteolysis
About these checks
Registry, retraction, Cites and statistics results are computed, not judged, with one exception: a printed reference that no index lists is read once by a model before it counts as a citation error. Claims are extracted by a model and kept only when their quote appears verbatim in the text; each cited source is then checked, with a model’s help, for whether it says what the claim relies on. Those verdicts can be wrong — read the claim’s quote and the cited source before relying on one.
Statistics and arithmetic are recomputed, not judged.
Confidence bands are shown only for fields calibrated on our annotated test set. None is calibrated yet, so no band is shown.
What counts as a claim ›How we measure confidence ›How we check this ›
Are you an author, or do you see a problem with this page? Request a review
