

The DOI matches its Crossref record; 49 of the 49 references it cites were found in a registry or an index.
Lithium tantalate photonic integrated circuits for volume manufacturing
Open accessAbstract
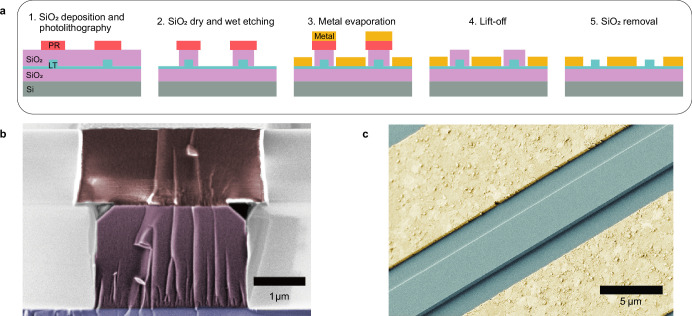
Abstract Electro-optical photonic integrated circuits (PICs) based on lithium niobate (LiNbO 3 ) have demonstrated the vast capabilities of materials with a high Pockels coefficient 1,2 . They enable linear and high-speed modulators operating at complementary metal–oxide–semiconductor voltage levels 3 to be used in applications including data-centre communications 4 , high-performance computing and photonic accelerators for AI 5 . However, industrial use of this technology is hindered by the high cost per wafer and the limited wafer size. The high cost results from the lack of existing high-volume applications in other domains of the sort that accelerated the adoption of silicon-on-insulator (SOI) photonics, which was driven by vast investment in microelectronics. Here we report low-loss PICs made of lithium tantalate (LiTaO 3 ), a material that has already been adopted commercially for 5G radiofrequency filters 6 and therefore enables scalable manufacturing at low cost, and it has equal, and in some cases superior, properties to LiNbO 3 . We show that LiTaO 3 can be etched to create low-loss (5.6 dB m −1 ) PICs using a deep ultraviolet (DUV) stepper-based manufacturing process 7 . We demonstrate a LiTaO 3 Mach–Zehnder modulator (MZM) with a half-wave voltage–length product of 1.9 V cm and an electro-optic bandwidth of up to 40 GHz. In comparison with LiNbO 3 , LiTaO 3 exhibits a much lower birefringence, enabling high-density circuits and broadband operation over all telecommunication bands. Moreover, the platform supports the generation of soliton microcombs. Our work paves the way for the scalable manufacture of low-cost and large-volume next-generation electro-optical PICs.
Overview
The claims and statistics of this paper haven’t been checked yet.
Run the check — free, no account needed. It reads the open-access text and checks the sources it cites.
Integrity signals
Registry
Cites
Statistics
Figures
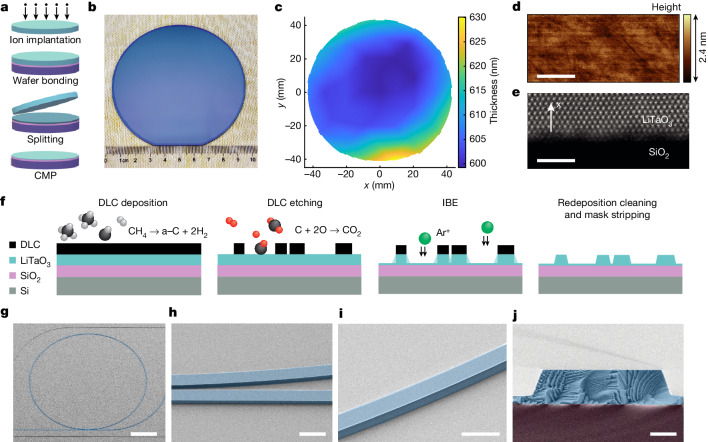
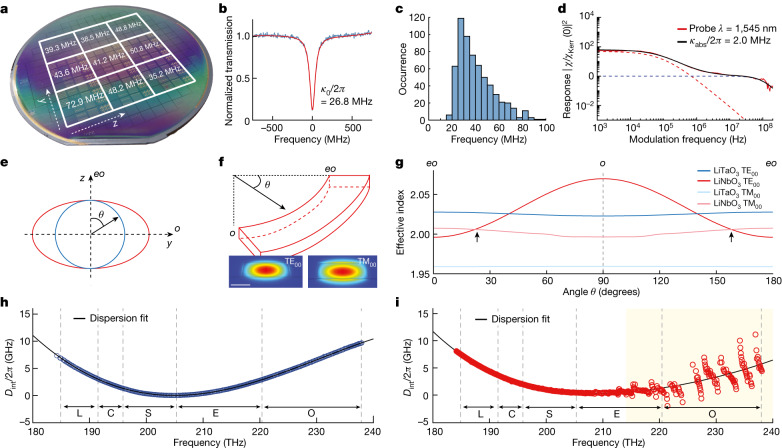
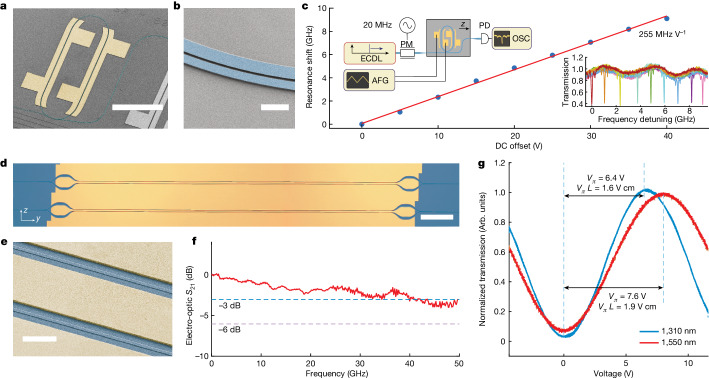
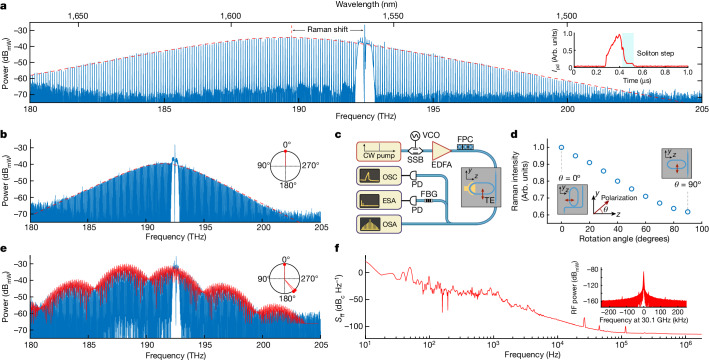
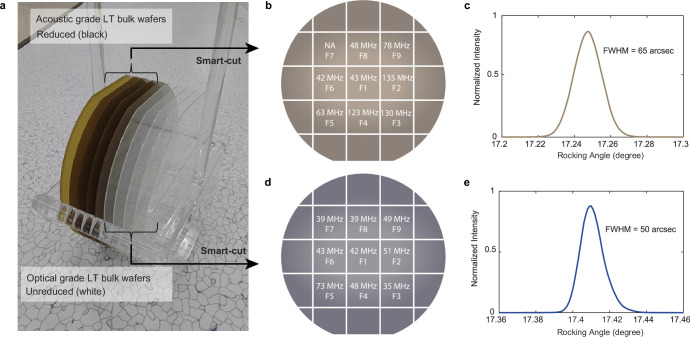
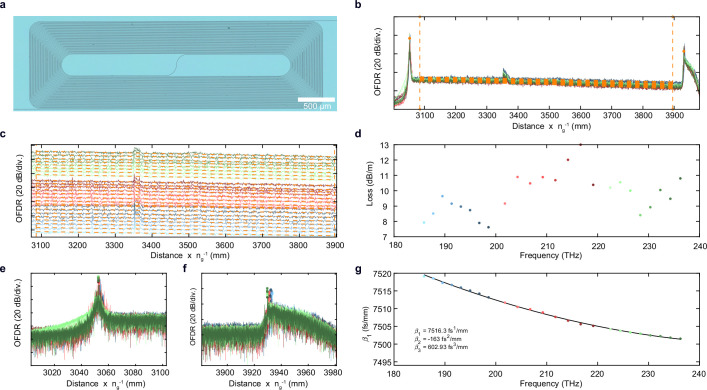
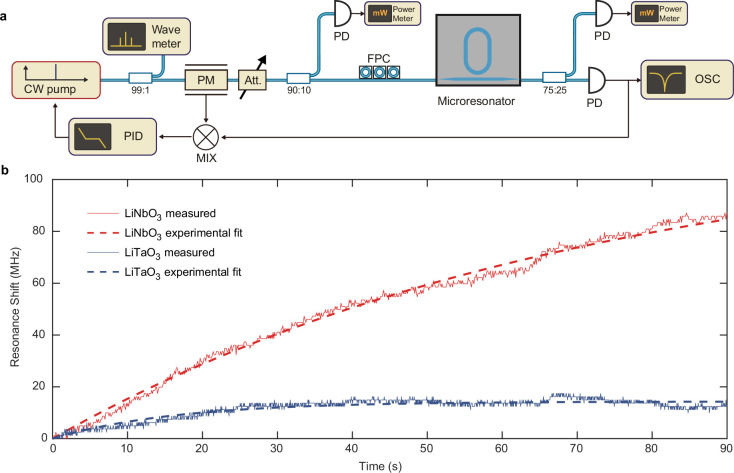
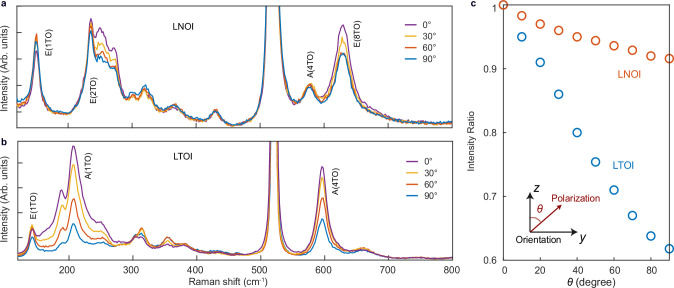
Verification
Claims the paper makes
The claims and statistics of this paper haven’t been checked yet.
Run the check — free, no account needed. It reads the open-access text and checks the sources it cites.
Claims other papers make about this one
Each is checked against this paper’s own text: does it say what the citing paper says it does?
The source backs part of the claim, not all of it — or backs it for a different population, condition or comparison.
In the citing paper
“Current trends in the field of photonics regarding the transition from bulk crystalbased devices to photonic integrated circuits (PICs), and, more specifically, to nonlinear integrated photonics, propel the utilisation of thin films based on stoichiometric complex oxides (such as lithium niobate, lithium tantalate, and barium titanate) since they simultaneously promise both ultrafast light control”
From Metal Oxide Thin Films for Advanced Photonic Applications (2026) · cites this paper as [165]
Experimental — accuracy not yet measured
Self-check
Percentages, sums and reported differences re-computed from the paper’s own numbers.
The self-check needs the paper’s full text.
Citations
Cites
Deep learning with coherent nanophotonic circuits
Shen, Y., Harris, N. C., Skirlo, S., Prabhu, M., Baehr-Jones, T., Hochberg, M., Sun, X., Zhao, S., Larochelle, H., Englund, D., et al. (2017) · Nature Photonics · doi:10.1038/nphoton.2017.93 · Cited by 3,340
Integrated lithium niobate electro-optic modulators operating at CMOS-compatible voltages
Wang, C., Zhang, M., Chen, X., Bertrand, M., Shams-Ansari, A., Chandrasekhar, S., Winzer, P., & Lončar, M. (2018) · Nature · doi:10.1038/s41586-018-0551-y · Cited by 2,593
Self-citationTemporal solitons in optical microresonators
Herr, T., Brasch, V., Jost, J. D., Wang, C. Y., Kondratiev, N. M., Gorodetsky, M. L., & Kippenberg, T. J. (2013) · Nature Photonics · doi:10.1038/nphoton.2013.343 · Cited by 2,135
Self-citationDissipative Kerr solitons in optical microresonators
Kippenberg, T. J., Gaeta, A. L., Lipson, M. F., & Gorodetsky, M. L. (2018) · Science · doi:10.1126/science.aan8083 · Cited by 1,831
Self-citationIntegrated photonics on thin-film lithium niobate
Zhu, D., Shao, L., Yu, M., Cheng, R., Desiatov, B., Xin, C. J., Hu, Y., Holzgrafe, J., Ghosh, S., Shams-Ansari, A., et al. (2021) · Advances in Optics and Photonics · doi:10.1364/aop.411024 · Cited by 1,516
Thomson, D., Zilkie, A., Bowers, J. E., Komljenovic, T., Reed, G. T., Vivien, L., Marris-Morini, D., Cassan, E., Virot, L., Fédéli, J.-M., et al. (2016) · Journal of Optics · doi:10.1088/2040-8978/18/7/073003 · Cited by 1,363
He, M., Xu, M., Ren, Y., Jian, J., Ruan, Z., Xu, Y., Gao, S., Sun, S., Wen, X., Zhou, L., et al. (2019) · Nature Photonics · doi:10.1038/s41566-019-0378-6 · Cited by 1,204
Broadband electro-optic frequency comb generation in a lithium niobate microring resonator
Zhang, M., Buscaino, B., Wang, C., Shams-Ansari, A., Reimer, C., Zhu, R., Kahn, J. M., & Lončar, M. (2019) · Nature · doi:10.1038/s41586-019-1008-7 · Cited by 980
Self-citationLithium niobate photonics: Unlocking the electromagnetic spectrum
Boes, A., Chang, L., Langrock, C., Yu, M., Zhang, M., Lin, Q., Lončar, M., Fejer, M. M., Bowers, J. E., & Mitchell, A. (2023) · Science · doi:10.1126/science.abj4396 · Cited by 671
Perspective on the future of silicon photonics and electronics
Margalit, N., Xiang, C., Bowers, S. M., Bjorlin, A., Blum, R., & Bowers, J. E. (2021) · Applied Physics Letters · doi:10.1063/5.0050117 · Cited by 641
Optically Induced Change of Refractive Indices in LiNbO3 and LiTaO3
Chen, F. S. (1969) · Journal of Applied Physics · doi:10.1063/1.1658195 · Cited by 575
Photonic microwave generation in the X- and K-band using integrated soliton microcombs
Liu, J., Lucas, E., Raja, A. S., He, J., Riemensberger, J., Wang, R. N., Karpov, M., Guo, H., Bouchand, R., & Kippenberg, T. J. (2020) · Nature Photonics · doi:10.1038/s41566-020-0617-x · Cited by 500
Self-citationLiu, J., Huang, G., Wang, R. N., He, J., Raja, A. S., Liu, T., Engelsen, N. J., & Kippenberg, T. J. (2021) · Nature Communications · doi:10.1038/s41467-021-21973-z · Cited by 494
Self-citationXu, M., Zhu, Y., Pittalà, F., Tang, J., He, M., Ng, W. C., Wang, J., Ruan, Z., Tang, X., Kuschnerov, M., et al. (2021) · Optica · doi:10.1364/optica.449691 · Cited by 366
Zhao, J., Ma, C., Rüsing, M., & Mookherjea, S. (2020) · Physical Review Letters · doi:10.1103/physrevlett.124.163603 · Cited by 362
Tunable Ultraviolet Radiation by Second-Harmonic Generation in Periodically Poled Lithium Tantalate
Meyn, J.-P., & Fejer, M. M. (1997) · Optics Letters · doi:10.1364/ol.22.001214 · Cited by 288
Frequency comb assisted diode laser spectroscopy for measurement of microcavity dispersion
Del’Haye, P., Arcizet, O., Gorodetsky, M. L., Holzwarth, R., & Kippenberg, T. J. (2009) · Nature Photonics · doi:10.1038/nphoton.2009.138 · Cited by 283
Self-citationIon-cut lithium niobate on insulator technology: Recent advances and perspectives
Jia, Y., Wang, L., & Chen, F. (2021) · Applied Physics Reviews · doi:10.1063/5.0037771 · Cited by 281
BRUEL, M., & AUBERTON-HERVE, B. A. A.-J. (1997) · Japanese Journal of Applied Physics · doi:10.1143/jjap.36.1636 · Cited by 264
Microwave-optical quantum frequency conversion
Han, X., Fu, W., Zou, C., Jiang, L., & Tang, H. X. (2021) · Optica · doi:10.1364/optica.425414 · Cited by 241
High-efficiency and broadband on-chip electro-optic frequency comb generators
Hu, Y., Yu, M., Buscaino, B., Sinclair, N. E., Zhu, D., Cheng, R., Shams‐Ansari, A., Shao, L., Zhang, M., Kahn, J. M., et al. (2022) · Nature Photonics · doi:10.1038/s41566-022-01059-y · Cited by 231
Thermal and Nonlinear Dissipative-Soliton Dynamics in Kerr-Microresonator Frequency Combs
Stone, J. R., Briles, T. C., Drake, T. E., Spencer, D. T., Carlson, D. R., Diddams, S. A., & Papp, S. B. (2018) · Physical Review Letters · doi:10.1103/physrevlett.121.063902 · Cited by 223
Wafer-scale low-loss lithium niobate photonic integrated circuits
Luke, K. J., Kharel, P., Reimer, C., He, L., Lončar, M., & Zhang, M. (2020) · Optics Express · doi:10.1364/oe.401959 · Cited by 200
Raman spectroscopy of lithium niobate and lithium tantalate. Force field calculations
Repelin, Y., HUSSON, E., Bennani, F., & Proust, C. (1999) · Journal of Physics and Chemistry of Solids · doi:10.1016/s0022-3697(98)00333-3 · Cited by 198
Optical properties of reduced lithium niobate single crystals
Dhar, A., & Mansingh, A. (1990) · Journal of Applied Physics · doi:10.1063/1.346951 · Cited by 190
Few-cycle vacuum squeezing in nanophotonics
Nehra, R., Sekine, R., Ledezma, L. M., Guo, Q., Gray, R. M., Roy, A., & Marandi, A. (2022) · Science · doi:10.1126/science.abo6213 · Cited by 177
High Density Lithium Niobate Photonic Integrated Circuits
Li, Z., Wang, R. N., Lihachev, G., Zhang, J., Tan, Z., Churaev, M., Kuznetsov, N., Siddharth, A., Bereyhi, M. J., Riemensberger, J., et al. (2023) · Nature Communications · doi:10.1038/s41467-023-40502-8 · Cited by 169
Self-citationReduced material loss in thin-film lithium niobate waveguides
Shams‐Ansari, A., Huang, G., He, L., Li, Z., Holzgrafe, J., Jankowski, M., Churaev, M., Kharel, P., Cheng, R., Zhu, D., et al. (2022) · APL Photonics · doi:10.1063/5.0095146 · Cited by 145
Self-citationA cryogenic electro-optic interconnect for superconducting devices
Youssefi, A., Shomroni, I., Joshi, Y. J., Bernier, N., Lukashchuk, A., Uhrich, P., Qiu, L., & Kippenberg, T. J. (2021) · Nature Electronics · doi:10.1038/s41928-021-00570-4 · Cited by 124
Self-citationJaverzac‐Galy, C., Plekhanov, K., Bernier, N., Tóth, L. D., Feofanov, A. K., & Kippenberg, T. J. (2016) · Physical Review A · doi:10.1103/physreva.94.053815 · Cited by 104
Self-citationFundamental mode hybridization in a thin film lithium niobate ridge waveguide
Pan, A., Hu, C., Zeng, C., & Xia, J. (2019) · Optics Express · doi:10.1364/oe.27.035659 · Cited by 92
Yan, Y., Huang, K., Zhou, H., Zhao, X., Li, W., Li, Z., Yi, A., Huang, H., Lin, J., Zhang, S., et al. (2019) · ACS Applied Electronic Materials · doi:10.1021/acsaelm.9b00351 · Cited by 83
Self-citationInnovative Smart Cut™ Piezo On Insulator (POI) Substrates for 5G acoustic filters
Butaud, E., Ballandras, S., Bousquet, M., Drouin, A., Tavel, B., Huyet, I., Clairet, A., Bertrand, I., Ghorbel, A., & Reinhardt, A. (2020) · Technical digest - International Electron Devices Meeting/Technical digest · doi:10.1109/iedm13553.2020.9372020 · Cited by 65
High-speed tunable microwave-rate soliton microcomb
He, Y., Lopez‐Rios, R., Javid, U. A., Ling, J., Li, M., Xue, S., Vahala, K. J., & Lin, Q. (2023) · Nature Communications · doi:10.1038/s41467-023-39229-3 · Cited by 63
The Optical Bandgap of Lithium Niobate (LiNbO3) and Its Dependence with Temperature
Zanatta, A. R. (2022) · Results in Physics · doi:10.1016/j.rinp.2022.105736 · Cited by 49
Urbach rule and optical properties of the LiNbO3and LiTaO3
Çabuk, S., & Mamedov, A. A. (1999) · Journal of Optics A Pure and Applied Optics · doi:10.1088/1464-4258/1/3/313 · Cited by 45
High optical damage threshold on-chip lithium tantalate microdisk resonator
Yan, X., Liu, Y., Ge, L., Zhu, B., Wu, J., Chen, Y., & Chen, X. (2020) · Optics Letters · doi:10.1364/ol.394171 · Cited by 44
Self-citationLu, C., Zhang, Y., Qiu, J., Tang, Y., Ding, T., Liu, S., Zheng, Y., & Chen, X. (2022) · Optics Letters · doi:10.1364/ol.449634 · Cited by 44
Performance of LiTaO3 Crystals and Thin Films and Their Application
Xiao, X., Liang, S., Si, J., Xu, Q., Zhang, H., Ma, L., Yang, C., & Zhang, X. (2023) · Crystals · doi:10.3390/cryst13081233 · Cited by 43
Ballandras, S., Courjon, E., Bernard, F., Laroche, T., Clairet, A., Radu, I., Huyet, I., Drouin, A., & Butaud, E. (2019) · Joint Conference of the European Frequency and Time Forum and IEEE International Frequency Control Symposium (EFTF/IFCS) · doi:10.1109/fcs.2019.8855991 · Cited by 37
Monolithic Kerr and electro-optic hybrid microcombs
Gong, Z., Shen, M., Lu, J., Surya, J. B., & Tang, H. X. (2022) · Optica · doi:10.1364/optica.462055 · Cited by 32
Gruber, M., Konetschnik, R., Popov, M., Spitaler, J., Supancic, P., Kiener, D., & Bermejo, R. (2018) · Acta Materialia · doi:10.1016/j.actamat.2018.03.020 · Cited by 31
Ultrahigh Q whispering gallery mode electro-optic resonators on a silicon photonic chip
Soltani, M., Ilchenko, V. S., Matsko, A. B., Savchenkov, A. A., Schlafer, J., Ryan, C. A., & Maleki, L. (2016) · Optics Letters · doi:10.1364/ol.41.004375 · Cited by 29
Characteristics of Coplanar Waveguide on Lithium Niobate Crystals as a Microwave Substrate
Yang, R.-Y., Su, Y.-K., Weng, M.-H., Hung, C.-Y., & Wu, H.-W. (2007) · Journal of Applied Physics · doi:10.1063/1.2402978 · Cited by 28
Jacob, M. V., Hartnett, J. G., Mazierska, J., Giordano, V., Krupka, J., & Tobar, M. E. (2004) · IEEE Transactions on Microwave Theory and Techniques · doi:10.1109/tmtt.2003.821911 · Cited by 27
Low loss optical waveguides fabricated in LiTaO3 by swift heavy ion irradiation
Tormo-Marquez, V., Díaz-Hijar, M., Carrascosa, M., Shur, V. Y., & Olivares, J. (2019) · Optics Express · doi:10.1364/oe.27.008696 · Cited by 13
High density lithium niobate photonic integrated circuits
Li, Z., Wang, R. N., Lihachev, G., Tan, Z., Churaev, M., Siddharth, A., Bereyhi, M. J., Riemensberger, J., & Kippenberg, T. J. (2023) · RePEc: Research Papers in Economics · doi:10.5281/zenodo.7966707 · Cited by 9
Self-citationChannel Waveguides in Lithium Niobate and Lithium Tantalate
Lu, Y., Johnston, B. F., Dekker, P., Withford, M. J., & Dawes, J. M. (2020) · Molecules · doi:10.3390/molecules25173925 · Cited by 8
Lithium tantalate photonic integrated circuits for volume manufacturing
Wang, C., & Kippenberg, T. J. (2023) · Infoscience (Ecole Polytechnique Fédérale de Lausanne) · doi:10.5281/zenodo.10215426 · Cited by 1
Self-citation
Research works printed but not linked: 1
- Wang, J., Chen, P., Dai, D. & Liu, L. Polarization coupling of X-cut thin film lithium niobate based waveguides. IEEE Photonics J.12, 2200310 (2020).
Cited by
Sorted by citations
Ultrabroadband thin-film lithium tantalate modulator for high-speed communications
Wang, C., Fang, D., Zhang, J., Kotz, A., Lihachev, G., Churaev, M., Li, Z., Schwarzenberger, A., Ou, X., Koos, C. G., et al. (2024) · Optica · doi:10.1364/optica.537730 · Cited by 85
Self-citationUltrabroadband integrated electro-optic frequency comb in lithium tantalate
Zhang, J., Wang, C., Denney, C., Riemensberger, J., Lihachev, G., Hu, J., Kao, W., Blésin, T., Kuznetsov, N., Li, Z., et al. (2025) · Nature · doi:10.1038/s41586-024-08354-4 · Cited by 79
Self-citationYi, J., Guo, C., Ruan, Z., Chen, G., Wei, H., Lu, L., Gong, S., Pan, X., Shen, X., Guan, X., et al. (2024) · Light Science & Applications · doi:10.1038/s41377-024-01506-1 · Cited by 58
DC-stable electro-optic modulators using thin-film lithium tantalate
Powell, K. B., Li, X., Assumpção, D., Magalhaes, L. S., Sinclair, N. E., & Lončar, M. (2024) · Optics Express · doi:10.1364/oe.538870 · Cited by 59
Integrated structured light manipulation
Wang, J., Li, K., & Quan, Z. (2024) · Photonics Insights · doi:10.3788/pi.2024.r05 · Cited by 53
Metadata
- Authors
- Wang, C., Li, Z., Riemensberger, J., Lihachev, G., Churaev, M., Kao, W., Ji, X., Zhang, J., Blesin, T., Davydova, A., Chen, Y., Huang, K., Wang, X., Ou, X., & Kippenberg, T. J.
- Affiliations
- Chinese Academy of Sciences (CN)
- École Polytechnique Fédérale de Lausanne (CH)
- Corresponding author
- Ou, Xin
- Kippenberg, Tobias J.
- ORCID
- Venue
- Nature
- Published
- 2024-05-08
- Volume
- 629
- Issue
- 8013
- Pages
- 784-790
- ISSN
- 0028-0836 (ISSN-L)
- 1476-4687
- PMC
- PMC11111398
- OpenAlex
- W4396732481
- Cited by
- 248
- References
- 49
- Citations by year
- 2026: 106 · 2025: 105 · 2024: 35
- FWCI
- 39.00
- Type
- journal article
- Language
- en
- Open access
- hybrid
- doi.org
- Locations
- Nature (publishedVersion, cc-by)
- PubMed Central (publishedVersion, cc-by)
- PubMed (publishedVersion)
- arXiv (Cornell University) (submittedVersion, cc-by)
- Infoscience (Ecole Polytechnique Fédérale de Lausanne) (submittedVersion, cc-by-nc-nd)
- RePEc: Research Papers in Economics (submittedVersion)
- Figshare (submittedVersion, public-domain)
- arXiv (Cornell University) (cc-by)
- Funders
- École Polytechnique Fédérale de Lausanne
- Schweizerischer Nationalfonds zur Förderung der Wissenschaftlichen Forschung (201923)
- National Natural Science Foundation of China (2019-23, 62293521)
- China Scholarship Council
- HORIZON EUROPE Framework Programme
- Shanghai Institute of Microsystem and Information Technology, Chinese Academy of Sciences
- H2020 European Research Council (835329)
- HORIZON EUROPE European Innovation Council (101113260)
- Topics
- Physical Sciences › Physics and Astronomy › Atomic and Molecular Physics, and Optics › Photorefractive and Nonlinear Optics
- Physical Sciences › Engineering › Electrical and Electronic Engineering › Photonic and Optical Devices
- Physical Sciences › Physics and Astronomy › Atomic and Molecular Physics, and Optics › Optical and Acousto-Optic Technologies
- Keywords
- lithium tantalate, photonic integrated circuits, electro-optic modulator, Mach-Zehnder modulator, low-loss waveguides, high-volume manufacturing, soliton microcombs, birefringence, electro-optic bandwidth, lithium niobate comparison, telecom band
About these checks
Registry, retraction, Cites and statistics results are computed, not judged, with one exception: a printed reference that no index lists is read once by a model before it counts as a citation error. Claims are extracted by a model and kept only when their quote appears verbatim in the text; each cited source is then checked, with a model’s help, for whether it says what the claim relies on. Those verdicts can be wrong — read the claim’s quote and the cited source before relying on one.
Statistics and arithmetic are recomputed, not judged.
Confidence bands are shown only for fields calibrated on our annotated test set. None is calibrated yet, so no band is shown.
What counts as a claim ›How we measure confidence ›How we check this ›
Are you an author, or do you see a problem with this page? Request a review
