Student or educator? Sign up with your school email and get 6 months of Pro free.
CoChat

The DOI matches its Crossref record; 122 of the 127 references it cites were found in a registry or an index; 21 of the 43 sources its claims cite were checked for support.

Adversarial testing of global neuronal workspace and integrated information theories of consciousness

Open access

Abstract

Abstract Different theories explain how subjective experience arises from brain activity 1,2 . These theories have independently accrued evidence, but have not been directly compared 3 . Here we present an open science adversarial collaboration directly juxtaposing integrated information theory (IIT) 4,5 and global neuronal workspace theory (GNWT) 6–10 via a theory-neutral consortium 11–13 . The theory proponents and the consortium developed and preregistered the experimental design, divergent predictions, expected outcomes and interpretation thereof 12 . Human participants ( n = 256) viewed suprathreshold stimuli for variable durations while neural activity was measured with functional magnetic resonance imaging, magnetoencephalography and intracranial electroencephalography. We found information about conscious content in visual, ventrotemporal and inferior frontal cortex, with sustained responses in occipital and lateral temporal cortex reflecting stimulus duration, and content-specific synchronization between frontal and early visual areas. These results align with some predictions of IIT and GNWT, while substantially challenging key tenets of both theories. For IIT, a lack of sustained synchronization within the posterior cortex contradicts the claim that network connectivity specifies consciousness. GNWT is challenged by the general lack of ignition at stimulus offset and limited representation of certain conscious dimensions in the prefrontal cortex. These challenges extend to other theories of consciousness that share some of the predictions tested here 14–17 . Beyond challenging the theories, we present an alternative approach to advance cognitive neuroscience through principled, theory-driven, collaborative research and highlight the need for a quantitative framework for systematic theory testing and building.

Overview

CoChat Summary

TL;DR

In a preregistered adversarial collaboration, 256 participants viewed suprathreshold visual stimuli while fMRI, MEG and iEEG measured neural activity to directly test integrated information theory (IIT) and global neuronal workspace theory (GNWT). Results aligned with some predictions of both theories but substantially challenged key tenets of each, especially sustained posterior synchronization for IIT and offset ignition/PFC content representation for GNWT.

Key findings

  • Category decoding occurred in both posterior and prefrontal ROIs across modalities: iEEG posterior face–object decoding exceeded 95% cross-task accuracy, whereas PFC decoding was approximately 70% and restricted to approximately 0.2–0.4 s; fMRI showed approximately 75% posterior and approximately 60% PFC decoding. Orientation decoding was robust in posterior ROIs (iEEG approximately 95%, fMRI approximately 45%, MEG approximately 75%) but mostly absent in PFC (iEEG BF01 = 5.11–8.65; fMRI BF01 = 3–71.5 in 34–55% of PFC voxels). Adding PFC ROIs did not improve decoding, with strong Bayesian evidence against improvement (for example, face–object iEEG BF01 = 1.94 × 10⁴; MEG BF01 = 3.05).
  • For maintenance, 25 of 657 posterior iEEG electrodes showed sustained activity tracking stimulus duration, but only 15% (8 of 53) of face-selective electrodes did so; PFC showed 99 non-selective and 24 category-selective onset responses, yet none of 655 PFC electrodes showed the GNWT-predicted onset-and-offset profile (BF01 > 3 for all PFC electrodes). Cross-temporal RSA revealed sustained face–object representation in posterior cortex and transient onset-only representation in PFC, not offset.
  • For connectivity, the preregistered pairwise phase consistency metric supported neither theory. Exploratory dynamic functional connectivity in iEEG showed brief object-selective V1/V2 connectivity, predominantly in gamma, and PFC connectivity with both face- and object-selective areas in the GNWT-predicted window; fMRI generalized psychophysiological interaction showed FFA content-selective connectivity with V1/V2, inferior frontal gyrus and intraparietal sulcus, but no object-selective PFC/V1/V2 connectivity (62–94% of PFC voxels showed BF01 = 3–7.75 for the null).

Methods

  • Preregistered adversarial collaboration with theory-neutral teams; 256 participants total (fMRI n = 120, MEG n = 102, iEEG n = 34), with reported replication analyses on MEG n = 65, fMRI n = 73 and iEEG n = 29 for decoding. Participants viewed single suprathreshold stimuli varying in category (faces, objects, letters, false fonts), identity, orientation (front, left, right) and duration (0.5, 1.0, 1.5 s), with task relevance manipulated across blocks.
  • Multimodal design combined fMRI, MEG and iEEG; for MEG and fMRI, one-third of data were used for analysis optimization and two-thirds for preregistered replication testing, whereas iEEG used a different strategy due to data rarity. Analyses included cross-task decoding, linear mixed models of duration tracking, cross-temporal representational similarity analysis, pairwise phase consistency, dynamic functional connectivity, generalized psychophysiological interaction and Bayesian tests.

Limitations

  • Stated in the paper: residual task engagement with category cannot be entirely ruled out; the approach falls short of encompassing full phenomenal richness; and the data lack single-unit recordings. The paper also notes sparse iEEG sampling of V1/V2 (12 electrodes versus 472 in PFC), possible MEG signal leakage from posterior regions, and that phase estimation from macroscopic recordings is susceptible to noise.
  • Evident from the text: the biological focus means theorists could respond to challenges by modifying proposed biological implementations while retaining the mathematical or computational core, and some predictions overlap with other theories, so the results may not isolate IIT or GNWT uniquely.

Model-written summary. Check it against the paper before relying on it.

Integrity signals

Registry

Crossref · 10.1038/s41586-025-08888-1

Cites

122 of 122 references verified0 citation errors · 0 not checkable

Statistics

Nothing to recompute.

Figures

Fig. 1 Predictions and experimental design. a, Predictions of IIT and GNWT. For prediction 1 (decoding of conscious content), IIT predicts maximal decoding of conscious content in posterior brain areas, whereas GNWT emphasizes a necessary role for the PFC. For prediction 2 (maintenance of conscious content), IIT posits that conscious content is actively maintained in the posterior cortex, whereas GNWT predicts brief content-specific ignition (approximately 0.3–0.5 s) in the PFC at stimulus onset and offset, with content stored in a non-conscious silent state between these events. Waveforms (left) and temporal generalization matrices (right) illustrate the predicted amplitude-based and information-based temporal profiles: coloured rectangles indicate the three stimulus durations for PFC (GNWT) and posterior cortex (IIT; left); the arrows mark stimulus onset (brown) and offset (red), whereas predicted temporal generalization is depicted in green (GNWT) and blue (IIT; right). For prediction 3 (interareal connectivity supporting consciousness), the stars and arrows on the brain diagram illustrate predicted synchrony patterns, with green representing GNWT and blue representing IIT. Brain surface is from Freesurfer. b, Conscious experience is multifaceted. For instance, viewing the Mona Lisa involves experiencing it as occupying a specific spatial location, categorizing it as a face, recognizing an identity and noting its leftward orientation, with this complex experience maintained over time. c, To manipulate conscious content, stimuli varied across four dimensions: category (faces, objects, letters and false fonts), identity (different exemplars within each category), orientation (left, right and front views) and duration (0.5 s, 1.0 s and 1.5 s). Example stimuli are shown. d, Experimental paradigm. Participants detected predefined targets (for example, a specific face and object or a letter and false font) in sequences of single, high-contrast stimuli. Each trial contained three stimulus types: targets (red; coloured frames for illustration only), task-relevant stimuli (orange-red; same categories as targets) and task-irrelevant stimuli (purple; other categories). Blank intervals between stimuli are not depicted. Object stimulus images in panels c,d are courtesy of Michael J. Tarr, Carnegie Mellon University, http://www.tarrlab.org/; face stimuli were created using FaceGen Modeler 3.1.
Fig. 1 Predictions and experimental design. a, Predictions of IIT and GNWT. For prediction 1 (decoding of conscious content), IIT predicts maximal decoding of conscious content in posterior brain areas, whereas GNWT emphasizes a necessary role for the PFC. For prediction 2 (maintenance of conscious content), IIT posits that conscious content is actively maintained in the posterior cortex, whereas GNWT predicts brief content-specific ignition (approximately 0.3–0.5 s) in the PFC at stimulus onset and offset, with content stored in a non-conscious silent state between these events. Waveforms (left) and temporal generalization matrices (right) illustrate the predicted amplitude-based and information-based temporal profiles: coloured rectangles indicate the three stimulus durations for PFC (GNWT) and posterior cortex (IIT; left); the arrows mark stimulus onset (brown) and offset (red), whereas predicted temporal generalization is depicted in green (GNWT) and blue (IIT; right). For prediction 3 (interareal connectivity supporting consciousness), the stars and arrows on the brain diagram illustrate predicted synchrony patterns, with green representing GNWT and blue representing IIT. Brain surface is from Freesurfer. b, Conscious experience is multifaceted. For instance, viewing the Mona Lisa involves experiencing it as occupying a specific spatial location, categorizing it as a face, recognizing an identity and noting its leftward orientation, with this complex experience maintained over time. c, To manipulate conscious content, stimuli varied across four dimensions: category (faces, objects, letters and false fonts), identity (different exemplars within each category), orientation (left, right and front views) and duration (0.5 s, 1.0 s and 1.5 s). Example stimuli are shown. d, Experimental paradigm. Participants detected predefined targets (for example, a specific face and object or a letter and false font) in sequences of single, high-contrast stimuli. Each trial contained three stimulus types: targets (red; coloured frames for illustration only), task-relevant stimuli (orange-red; same categories as targets) and task-irrelevant stimuli (purple; other categories). Blank intervals between stimuli are not depicted. Object stimulus images in panels c,d are courtesy of Michael J. Tarr, Carnegie Mellon University, http://www.tarrlab.org/; face stimuli were created using FaceGen Modeler 3.1.CC BY · PubMed Central
Fig. 2 Prediction 1: decoding of conscious content. a, Spatial coverage of intracranial electrodes (npatients = 29) on a standard inflated cortical surface map (top), and within theory-defined ROIs (bottom): posterior (blue; nelectrodes = 583) and prefrontal (green; nelectrodes = 576). b, iEEG cross-task temporal generalization of decoding of high-gamma signal. Pattern classifiers were trained to discriminate stimulus category (faces–objects) in the task-irrelevant condition at each time point and tested in the task-relevant condition across all time-points. Columns denote stimulus durations (0.5 s (left), 1.0 s (centre) and 1.5 s (right)), and rows indicate theory ROIs (posterior (top) and prefrontal (bottom)). Contoured red-shaded regions depict significant above-chance (50%) decoding. Here and below, significance was evaluated through a non-parametric cluster-based permutation test (P < 0.05; two-sided). c, MEG average cross-task decoding of stimulus category (n = 65) from task-relevant to task-irrelevant stimuli (purple) and vice versa (orange), separately for the posterior (top) and prefrontal (bottom) ROIs, depicted on inflated cortical surfaces (posterior in blue and prefrontal in green), across durations, using pseudotrial aggregation. Underlying lines indicate significance. The shading depicts 95% CI across participants. d, fMRI searchlight cross-task decoding of stimulus category (n = 73), collapsed across durations, from task-relevant stimuli to task-irrelevant stimuli (left; purple) or vice versa (right; orange). The outlined coloured regions on the inflated cortical surfaces (left–right lateral views; right–left medial views (bottom)) indicate significant above-chance decoding. e, iEEG ROIs significant cross-task decoding of stimulus category, collapsed across durations. Conventions are as in panel d, displayed from a left lateral (top left), posterior (top right) and left medial (bottom) views. f, iEEG average decoding of stimulus orientation (left, right and front) within posterior (top) and prefrontal (bottom) ROIs, collapsed across durations. Underlying lines indicate above-chance (33%) decoding. The shading depicts 95% CI estimated across cross-validation folds. g, fMRI searchlight decoding of face orientation (left, right and front). Regions with significantly above-chance (33%) decoding accuracies are outlined in blue. h, iEEG ROIs decoding of face orientation (left, right and front). Conventions are as in panel g. i, MEG ROIs average decoding of face orientation (left, right and front). Conventions are as in panel f. Brain surfaces in panels a,c–e,g,h are from Freesurfer.
Fig. 2 Prediction 1: decoding of conscious content. a, Spatial coverage of intracranial electrodes (npatients = 29) on a standard inflated cortical surface map (top), and within theory-defined ROIs (bottom): posterior (blue; nelectrodes = 583) and prefrontal (green; nelectrodes = 576). b, iEEG cross-task temporal generalization of decoding of high-gamma signal. Pattern classifiers were trained to discriminate stimulus category (faces–objects) in the task-irrelevant condition at each time point and tested in the task-relevant condition across all time-points. Columns denote stimulus durations (0.5 s (left), 1.0 s (centre) and 1.5 s (right)), and rows indicate theory ROIs (posterior (top) and prefrontal (bottom)). Contoured red-shaded regions depict significant above-chance (50%) decoding. Here and below, significance was evaluated through a non-parametric cluster-based permutation test (P < 0.05; two-sided). c, MEG average cross-task decoding of stimulus category (n = 65) from task-relevant to task-irrelevant stimuli (purple) and vice versa (orange), separately for the posterior (top) and prefrontal (bottom) ROIs, depicted on inflated cortical surfaces (posterior in blue and prefrontal in green), across durations, using pseudotrial aggregation. Underlying lines indicate significance. The shading depicts 95% CI across participants. d, fMRI searchlight cross-task decoding of stimulus category (n = 73), collapsed across durations, from task-relevant stimuli to task-irrelevant stimuli (left; purple) or vice versa (right; orange). The outlined coloured regions on the inflated cortical surfaces (left–right lateral views; right–left medial views (bottom)) indicate significant above-chance decoding. e, iEEG ROIs significant cross-task decoding of stimulus category, collapsed across durations. Conventions are as in panel d, displayed from a left lateral (top left), posterior (top right) and left medial (bottom) views. f, iEEG average decoding of stimulus orientation (left, right and front) within posterior (top) and prefrontal (bottom) ROIs, collapsed across durations. Underlying lines indicate above-chance (33%) decoding. The shading depicts 95% CI estimated across cross-validation folds. g, fMRI searchlight decoding of face orientation (left, right and front). Regions with significantly above-chance (33%) decoding accuracies are outlined in blue. h, iEEG ROIs decoding of face orientation (left, right and front). Conventions are as in panel g. i, MEG ROIs average decoding of face orientation (left, right and front). Conventions are as in panel f. Brain surfaces in panels a,c–e,g,h are from Freesurfer.CC BY · PubMed Central
Fig. 3 Prediction 2: maintenance of conscious content. a, Intracranial electrode localization on the MNI template, for posterior (left; blue; npatients = 31 and nelectrodes = 657) and prefrontal (right; green; npatients = 31 and nelectrodes = 655) ROIs. Electrodes are colour coded by response type based on model comparison (see Methods): sustained non-category-selective activation (light blue; n = 12), sustained category-selective activation (dark blue; n = 5), sustained face-selective activation (purple; n = 8), biphasic onset–offset activation in posterior areas (green; n = 11) and in PFC (black; n = 1), and onset-responsive activation in PFC (grey; n = 99). Brain surfaces are from Freesurfer. b, Posterior ROI activation. Time-series plots depict average high gamma (HG), separated by stimulus duration (0.5 s (dark), 1 s (medium) and 1.5 s (light)) for non-selective (left) and face-selective (middle) electrodes. The shading here and in panel c depicts standard error of the mean across electrodes and trials. The barplots (right) depict the average HG signal across sustained face-selective electrodes (n = 8) in 1.5-s trials, separated by category (faces in dark blue, objects in orange, letters in turquoise and false fonts in dark red) and theory-defined time windows (x axis). Raster plots show single-trial (n = 320) HG of individual electrodes during task-irrelevant trials: a sustained non-selective (left), sustained face-selective (middle) and onset–offset (right) electrode. The rows depict single trials, sorted per duration (from top: 0.5, 1.0 and 1.5 s), and then category (from top: false fonts, letters, objects and faces). c, Prefrontal ROI activation. Time-series plots (top left) depict the average HG response per stimulus duration (shades of grey) for onset-responsive electrodes (n = 99) in task-irrelevant trials (n = 320). Average HG response per stimulus duration for a single electrode exhibiting onset–offset responses, with an earlier-than-predicted offset (top right). Raster plots for example onset (bottom left) and onset–offset (bottom right) responses are also shown. Conventions are as in panel b. d, Cross-temporal RSA matrices in posterior (npatients = 28 and nelectrodes = 583) and prefrontal (npatients = 28 and nelectrodes = 576) ROIs. Titles indicate the compared contrasts, and subtitles denote the ROIs. Matrix values represent z-scored, within-class-corrected correlation distances derived from a label shuffle null distribution. Contours denote significance (cluster-based permutation tests, P < 0.05, upper tail).
Fig. 3 Prediction 2: maintenance of conscious content. a, Intracranial electrode localization on the MNI template, for posterior (left; blue; npatients = 31 and nelectrodes = 657) and prefrontal (right; green; npatients = 31 and nelectrodes = 655) ROIs. Electrodes are colour coded by response type based on model comparison (see Methods): sustained non-category-selective activation (light blue; n = 12), sustained category-selective activation (dark blue; n = 5), sustained face-selective activation (purple; n = 8), biphasic onset–offset activation in posterior areas (green; n = 11) and in PFC (black; n = 1), and onset-responsive activation in PFC (grey; n = 99). Brain surfaces are from Freesurfer. b, Posterior ROI activation. Time-series plots depict average high gamma (HG), separated by stimulus duration (0.5 s (dark), 1 s (medium) and 1.5 s (light)) for non-selective (left) and face-selective (middle) electrodes. The shading here and in panel c depicts standard error of the mean across electrodes and trials. The barplots (right) depict the average HG signal across sustained face-selective electrodes (n = 8) in 1.5-s trials, separated by category (faces in dark blue, objects in orange, letters in turquoise and false fonts in dark red) and theory-defined time windows (x axis). Raster plots show single-trial (n = 320) HG of individual electrodes during task-irrelevant trials: a sustained non-selective (left), sustained face-selective (middle) and onset–offset (right) electrode. The rows depict single trials, sorted per duration (from top: 0.5, 1.0 and 1.5 s), and then category (from top: false fonts, letters, objects and faces). c, Prefrontal ROI activation. Time-series plots (top left) depict the average HG response per stimulus duration (shades of grey) for onset-responsive electrodes (n = 99) in task-irrelevant trials (n = 320). Average HG response per stimulus duration for a single electrode exhibiting onset–offset responses, with an earlier-than-predicted offset (top right). Raster plots for example onset (bottom left) and onset–offset (bottom right) responses are also shown. Conventions are as in panel b. d, Cross-temporal RSA matrices in posterior (npatients = 28 and nelectrodes = 583) and prefrontal (npatients = 28 and nelectrodes = 576) ROIs. Titles indicate the compared contrasts, and subtitles denote the ROIs. Matrix values represent z-scored, within-class-corrected correlation distances derived from a label shuffle null distribution. Contours denote significance (cluster-based permutation tests, P < 0.05, upper tail).CC BY · PubMed Central
Fig. 4 Prediction 3: interareal connectivity. a, iEEG DFC analysis of task-irrelevant trials revealed significant content-selective synchrony only for object-selective electrodes in V1/V2 (for example, top row; face-selective: npatients = 4 and nelectrodes = 30; object-selective: npatients= 4 and nelectrodes= 21), while showing significant content-selective synchrony for both categories in the PFC ROI (bottom row; face selective: npatients = 19 and nelectrodes = 81; object selective: npatients = 14 and nelectrodes = 57). Here and in panel b, significance was assessed using a cluster-based permutation analysis (P < 0.05, two-sided) and the colour bars represent the average change in the DFC between conditions. b, MEG DFC analysis of task-irrelevant trials (n = 65) revealed significant content-selective synchrony below 25 Hz for the face-selective GED filter in both V1/V2 (top left) and PFC (bottom left), but not for the object-selective GED filter (right panels). c, fMRI generalized psychophysiological interaction (gPPI; n = 70) on task-relevant and task-irrelevant trials combined revealed significant content-selective connectivity when FFA is used as the analysis seed. Various significant regions showing task-related connectivity with the FFA seed were observed including V1/V2, right intraparietal sulcus (IPS) and right inferior frontal gyrus (IFG). LH, left hemisphere; RH, right hemisphere. d, Analysis of iEEG face-selective DFC synchrony across tasks is shown at the single-electrode level in PFC (top) and V1/V2 (bottom) ROIs. Electrodes showing significant synchrony (tested using a permutation test, FDR-corrected, P < 0.05) in relevant (orange-red), irrelevant (purple) or combined relevant and irrelevant (black) trials are shown (averaged over 70–120 Hz and 0–0.5-s time window). DFC synchrony was observed in both tasks, but restricted to IFG for the GNWT analysis and V2 regions for the IIT analysis, consistent with the fMRI gPPI analysis shown in panel c. Brain surfaces in panels c,d are from Freesurfer.
Fig. 4 Prediction 3: interareal connectivity. a, iEEG DFC analysis of task-irrelevant trials revealed significant content-selective synchrony only for object-selective electrodes in V1/V2 (for example, top row; face-selective: npatients = 4 and nelectrodes = 30; object-selective: npatients= 4 and nelectrodes= 21), while showing significant content-selective synchrony for both categories in the PFC ROI (bottom row; face selective: npatients = 19 and nelectrodes = 81; object selective: npatients = 14 and nelectrodes = 57). Here and in panel b, significance was assessed using a cluster-based permutation analysis (P < 0.05, two-sided) and the colour bars represent the average change in the DFC between conditions. b, MEG DFC analysis of task-irrelevant trials (n = 65) revealed significant content-selective synchrony below 25 Hz for the face-selective GED filter in both V1/V2 (top left) and PFC (bottom left), but not for the object-selective GED filter (right panels). c, fMRI generalized psychophysiological interaction (gPPI; n = 70) on task-relevant and task-irrelevant trials combined revealed significant content-selective connectivity when FFA is used as the analysis seed. Various significant regions showing task-related connectivity with the FFA seed were observed including V1/V2, right intraparietal sulcus (IPS) and right inferior frontal gyrus (IFG). LH, left hemisphere; RH, right hemisphere. d, Analysis of iEEG face-selective DFC synchrony across tasks is shown at the single-electrode level in PFC (top) and V1/V2 (bottom) ROIs. Electrodes showing significant synchrony (tested using a permutation test, FDR-corrected, P < 0.05) in relevant (orange-red), irrelevant (purple) or combined relevant and irrelevant (black) trials are shown (averaged over 70–120 Hz and 0–0.5-s time window). DFC synchrony was observed in both tasks, but restricted to IFG for the GNWT analysis and V2 regions for the IIT analysis, consistent with the fMRI gPPI analysis shown in panel c. Brain surfaces in panels c,d are from Freesurfer.CC BY · PubMed Central
Extended Data Fig. 1 Prediction1 Complementary results for decoding of conscious content. a, fMRI searchlight decoding accuracies (letters-falsefonts), collapsed across durations. Pattern classifiers trained on relevant stimuli and tested on irrelevant stimuli (left, purple) or vice versa (right, orange): Outlined colored regions on the inflated cortical surfaces (top: lateral views; bottom: medial views) indicate significant above-chance (50%) decoding. Here and below, significance was evaluated through a cluster-based permutation test (p < 0.05; two-sided). Sample sizes as reported in Fig. 2. b, iEEG ROIs decoding accuracies (letters-falsefonts) collapsed across durations. Conventions as in a. The results are displayed on inflated surface maps from a left lateral (top left), posterior (top right) and left medial (bottom) views. c, MEG cross-task decoding of category (letters-falsefonts) when classifiers were trained on relevant stimuli and tested on irrelevant stimuli (purple); or vice versa (orange), separately for the whole posterior (left) and prefrontal (right) ROIs. Underlying lines indicate significantly above-chance (50%) decoding. Error bars depict 95% CI across participants. d, iEEG cross-task temporal generalization of category decoding (letters-falsefonts) classifiers trained on task-relevant stimuli and tested on task-irrelevant stimuli. Columns: stimulus durations (left: 0.5 s; center: 1.0 s; right: 1.5 s). Rows: theory ROIs (top: posterior; bottom: prefrontal). Contoured red-shaded regions depict significant above-chance (50%) decoding. e, iEEG cross-task temporal generalization of category decoding (faces-objects), classifiers were trained on task-relevant stimuli and tested on task-irrelevant ones. Conventions as in d. f, iEEG cross-task temporal generalization of category decoding (faces-objects) from task-irrelevant to task-relevant stimuli, yet using pseudotrial aggregation to boost decoding accuracy. Conventions as in d. g, iEEG ROI decoding accuracies (faces-objects) using pseudotrials. Conventions as in b. Brain surfaces in panels a, b, g are from Freesurfer.
Extended Data Fig. 1 Prediction1 Complementary results for decoding of conscious content. a, fMRI searchlight decoding accuracies (letters-falsefonts), collapsed across durations. Pattern classifiers trained on relevant stimuli and tested on irrelevant stimuli (left, purple) or vice versa (right, orange): Outlined colored regions on the inflated cortical surfaces (top: lateral views; bottom: medial views) indicate significant above-chance (50%) decoding. Here and below, significance was evaluated through a cluster-based permutation test (p < 0.05; two-sided). Sample sizes as reported in Fig. 2. b, iEEG ROIs decoding accuracies (letters-falsefonts) collapsed across durations. Conventions as in a. The results are displayed on inflated surface maps from a left lateral (top left), posterior (top right) and left medial (bottom) views. c, MEG cross-task decoding of category (letters-falsefonts) when classifiers were trained on relevant stimuli and tested on irrelevant stimuli (purple); or vice versa (orange), separately for the whole posterior (left) and prefrontal (right) ROIs. Underlying lines indicate significantly above-chance (50%) decoding. Error bars depict 95% CI across participants. d, iEEG cross-task temporal generalization of category decoding (letters-falsefonts) classifiers trained on task-relevant stimuli and tested on task-irrelevant stimuli. Columns: stimulus durations (left: 0.5 s; center: 1.0 s; right: 1.5 s). Rows: theory ROIs (top: posterior; bottom: prefrontal). Contoured red-shaded regions depict significant above-chance (50%) decoding. e, iEEG cross-task temporal generalization of category decoding (faces-objects), classifiers were trained on task-relevant stimuli and tested on task-irrelevant ones. Conventions as in d. f, iEEG cross-task temporal generalization of category decoding (faces-objects) from task-irrelevant to task-relevant stimuli, yet using pseudotrial aggregation to boost decoding accuracy. Conventions as in d. g, iEEG ROI decoding accuracies (faces-objects) using pseudotrials. Conventions as in b. Brain surfaces in panels a, b, g are from Freesurfer.CC BY · PubMed Central
Extended Data Fig. 2 Within-task temporal generalization of decoding of stimulus category. a, iEEG within-task temporal generalization decoding of category (faces-objects) for pattern classifiers trained and tested on task-relevant stimuli. As in Fig. 2b, columns represent stimulus durations (left: 0.5 s; center: 1.0 s; right: 1.5 s) and rows represent theory ROIs (top: posterior; bottom: prefrontal). Contoured red-shaded regions depict significant above-chance (50%) decoding. Here and below, significance was evaluated through a cluster-based permutation test (p < 0.05; two-sided). Sample size as in Fig. 2. b, iEEG within-task temporal generalization decoding of category for task-irrelevant stimuli. Conventions as in a. c, MEG within-task average decoding of category (faces-objects), for the task-relevant (orange) and the task-irrelevant (purple) conditions, in posterior (left) and prefrontal (right) ROIs. Underlying lines depict significantly above-chance (50%) decoding assessed by cluster-based permutation test (p < 0.05). Error bars depict 95% CI estimated across participants. d, MEG within-task decoding of category (letters-falsefonts). Conventions as in c. e, fMRI searchlight decoding of category (faces-objects), collapsed across durations, for the task-relevant (left, orange) and task-irrelevant (right, purple) conditions. Outlined colors indicate regions on the inflated cortical surfaces showing significantly above-chance (50%) decoding (top: left/right lateral views; bottom: right/left medial views). f, iEEG ROIs decoding accuracies, collapsed across durations, within the task-relevant (left, orange) and the task-irrelevant (right, purple) stimuli. Same conventions as in e, with maps from a left lateral (top left), posterior (top right) and left medial (bottom) views. Brain surfaces in panels e,f are from Freesurfer.
Extended Data Fig. 2 Within-task temporal generalization of decoding of stimulus category. a, iEEG within-task temporal generalization decoding of category (faces-objects) for pattern classifiers trained and tested on task-relevant stimuli. As in Fig. 2b, columns represent stimulus durations (left: 0.5 s; center: 1.0 s; right: 1.5 s) and rows represent theory ROIs (top: posterior; bottom: prefrontal). Contoured red-shaded regions depict significant above-chance (50%) decoding. Here and below, significance was evaluated through a cluster-based permutation test (p < 0.05; two-sided). Sample size as in Fig. 2. b, iEEG within-task temporal generalization decoding of category for task-irrelevant stimuli. Conventions as in a. c, MEG within-task average decoding of category (faces-objects), for the task-relevant (orange) and the task-irrelevant (purple) conditions, in posterior (left) and prefrontal (right) ROIs. Underlying lines depict significantly above-chance (50%) decoding assessed by cluster-based permutation test (p < 0.05). Error bars depict 95% CI estimated across participants. d, MEG within-task decoding of category (letters-falsefonts). Conventions as in c. e, fMRI searchlight decoding of category (faces-objects), collapsed across durations, for the task-relevant (left, orange) and task-irrelevant (right, purple) conditions. Outlined colors indicate regions on the inflated cortical surfaces showing significantly above-chance (50%) decoding (top: left/right lateral views; bottom: right/left medial views). f, iEEG ROIs decoding accuracies, collapsed across durations, within the task-relevant (left, orange) and the task-irrelevant (right, purple) stimuli. Same conventions as in e, with maps from a left lateral (top left), posterior (top right) and left medial (bottom) views. Brain surfaces in panels e,f are from Freesurfer.CC BY · PubMed Central
Extended Data Fig. 3 Control analyses for the decoding prediction. a, Left: iEEG ROIs decoding results of orientation (left/right/front view) over time as in Fig. 2, but using pseudotrials akin to the MEG analysis. Right: Regions with electrodes showing significant above-chance (33%) accuracies are indicated in outlined blue on the inflated surfaces (left: left lateral view; middle: posterior view; right: left medial view). Here and below, error bars depict 95% CI. Significance assessed using a cluster-based permutation test (p < 0.05, two-sided). Sample size as in Fig. 2. b, Two analyses were performed to evaluate potential leakage in MEG decoding, using independent data from the optimization phase (N = 32). Top: averaged stimulus-evoked response in face task-relevant trials, combined across durations, at different latencies, projected on the inflated surfaces. Activity in posterior areas (blue ellipse) showed the highest peak ~0.1-0.2 s, while prefrontal areas showed a later highest peak ~0.2-0.3 s. This challenges the leakage interpretation. Bottom: Analysis of face-object decoding in task-relevant trials across durations, separately within parcels in parietal and PFC. Left: Average decoding accuracy in an early time window (0.25-0.5 s) projected on two differently inflated surfaces to better depict gyri and sulci. Right: Time-resolved decoding of these parcels. Decoding is highest in posterior areas and lowest in anterior areas, with fairly similar time courses, suggesting a posterior-to-anterior gradient consistent with leakage. c, ROIs used in the decoding analysis including (blue) and excluding (red) PFC areas. d, iEEG decoding of faces-objects (left), letters-falsefonts (middle) and face orientation (right), with and without PFC (blue and red). Underlying lines indicate significantly worse decoding when including PFC. e, MEG decoding results, same conventions as in d. f, fMRI decoding of faces-objects. Histogram shows the differences in classification including and excluding frontal areas. fMRI accuracies including PFC show 1.2% increase compared to excluding PFC, observed in 56% of the participants. Notably, this slight increase was observed only in the combined features analysis and not the combined models’ analysis (see Methods). Brain surfaces in panels a-c are from Freesurfer.
Extended Data Fig. 3 Control analyses for the decoding prediction. a, Left: iEEG ROIs decoding results of orientation (left/right/front view) over time as in Fig. 2, but using pseudotrials akin to the MEG analysis. Right: Regions with electrodes showing significant above-chance (33%) accuracies are indicated in outlined blue on the inflated surfaces (left: left lateral view; middle: posterior view; right: left medial view). Here and below, error bars depict 95% CI. Significance assessed using a cluster-based permutation test (p < 0.05, two-sided). Sample size as in Fig. 2. b, Two analyses were performed to evaluate potential leakage in MEG decoding, using independent data from the optimization phase (N = 32). Top: averaged stimulus-evoked response in face task-relevant trials, combined across durations, at different latencies, projected on the inflated surfaces. Activity in posterior areas (blue ellipse) showed the highest peak ~0.1-0.2 s, while prefrontal areas showed a later highest peak ~0.2-0.3 s. This challenges the leakage interpretation. Bottom: Analysis of face-object decoding in task-relevant trials across durations, separately within parcels in parietal and PFC. Left: Average decoding accuracy in an early time window (0.25-0.5 s) projected on two differently inflated surfaces to better depict gyri and sulci. Right: Time-resolved decoding of these parcels. Decoding is highest in posterior areas and lowest in anterior areas, with fairly similar time courses, suggesting a posterior-to-anterior gradient consistent with leakage. c, ROIs used in the decoding analysis including (blue) and excluding (red) PFC areas. d, iEEG decoding of faces-objects (left), letters-falsefonts (middle) and face orientation (right), with and without PFC (blue and red). Underlying lines indicate significantly worse decoding when including PFC. e, MEG decoding results, same conventions as in d. f, fMRI decoding of faces-objects. Histogram shows the differences in classification including and excluding frontal areas. fMRI accuracies including PFC show 1.2% increase compared to excluding PFC, observed in 56% of the participants. Notably, this slight increase was observed only in the combined features analysis and not the combined models’ analysis (see Methods). Brain surfaces in panels a-c are from Freesurfer.CC BY · PubMed Central
Extended Data Fig. 4 Maintenance of conscious content over time for stimulus categories, identity and orientation. a, Cross-temporal representational similarity matrices in Posterior ROI (Npatients=28, Nelectrodes = 583). The leftmost column shows similarity for letters vs. false fonts, separately for task-relevant (left) and task-irrelevant (right) trials. Principal Component Analysis (PCA) plots at 0.3 s illustrate the separability between letters and false fonts. The top rightward column display similarity for identity, while bottom rows show similarity for orientation. Contours indicate statistical significance based on cluster-based permutation tests (upper tail test, α = 0.05). PCA illustrates clear separability between letters and false fonts in the posterior cortex at 0.3 s, regardless of task relevance (top – task-relevant, bottom - task-irrelevant). This separability was largely sustained in the task-relevant condition but diminished between ~0.95 and 1.4 s. In the task-irrelevant condition, separability was significant only for a brief period at the beginning. Identity information was significant for letters and false-fonts but not for faces. While identity information was not sustained throughout the entire stimulus duration, elevated z-scores up to 1 s suggest a potential limitation in statistical power. No statistically significant orientation information was observed for any category. Conventions as in Fig. 3. b, Cross-temporal representational similarity matrices in Prefrontal ROI (Npatients=28, Nelectrodes = 576) for the same contrasts as and following the same conventions as in a. No contrast yielded statistically significant results in the PFC ROI.
Extended Data Fig. 4 Maintenance of conscious content over time for stimulus categories, identity and orientation. a, Cross-temporal representational similarity matrices in Posterior ROI (Npatients=28, Nelectrodes = 583). The leftmost column shows similarity for letters vs. false fonts, separately for task-relevant (left) and task-irrelevant (right) trials. Principal Component Analysis (PCA) plots at 0.3 s illustrate the separability between letters and false fonts. The top rightward column display similarity for identity, while bottom rows show similarity for orientation. Contours indicate statistical significance based on cluster-based permutation tests (upper tail test, α = 0.05). PCA illustrates clear separability between letters and false fonts in the posterior cortex at 0.3 s, regardless of task relevance (top – task-relevant, bottom - task-irrelevant). This separability was largely sustained in the task-relevant condition but diminished between ~0.95 and 1.4 s. In the task-irrelevant condition, separability was significant only for a brief period at the beginning. Identity information was significant for letters and false-fonts but not for faces. While identity information was not sustained throughout the entire stimulus duration, elevated z-scores up to 1 s suggest a potential limitation in statistical power. No statistically significant orientation information was observed for any category. Conventions as in Fig. 3. b, Cross-temporal representational similarity matrices in Prefrontal ROI (Npatients=28, Nelectrodes = 576) for the same contrasts as and following the same conventions as in a. No contrast yielded statistically significant results in the PFC ROI.CC BY · PubMed Central
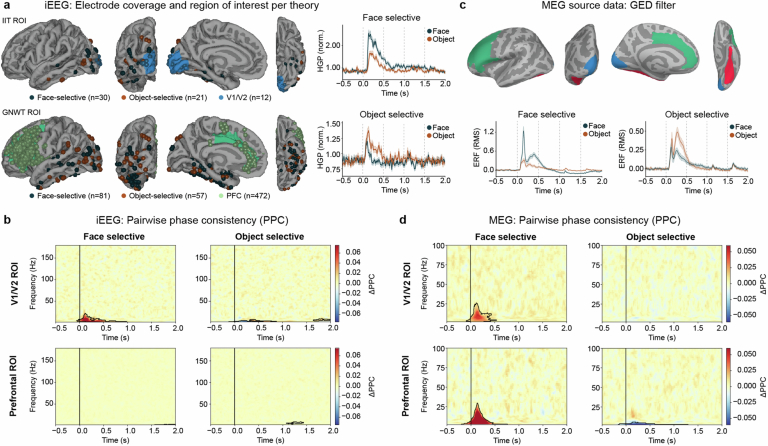
Extended Data Fig. 5 Prediction #3: Interareal connectivity preregistered analysis. a, iEEG electrode coverage used to assess content-selective synchrony for IIT ROIs (top, Npatients = 4) & GNWT ROIs (bottom, Npatients = 21). Electrode coverage varied between ROIs as interareal connectivity was assessed between electrodes on a per-participant basis. In addition, two example category-selective electrodes are shown (right): one face-selective, and one object-selective. Error bars depict standard error of the mean. b, iEEG Pairwise phase consistency (PPC) analysis of task-irrelevant trials reveals significant content-selective synchrony (e.g. faces > objects for face-selective electrodes; left; objects > faces for object-selective electrodes; right) in V1/V2 ROIs (top row), but not in PFC ROIs (bottom row). Color bars represent the average change in PPC (face and object trials) for each node (face-selective, object-selective). Positive values reflect stronger connectivity for faces, while negative values reflect stronger connectivity for objects. c, MEG (N = 65) cortical time-series were extracted per participant from cortical parcels in V1/V2 (blue), PFC (green) and in a fusiform (red) ROIs. Category-selective signals were obtained by creating a category-selective GED filter (i.e., contrasting face-object trials against any other stimulus category trials) on the activity extracted from the fusiform ROI. Face- (bottom left) and object-selective (bottom right) responses averaged across participants are shown at the bottom. Error bars depict 95% CI. Here and below, significance was assessed using cluster-based permutation tests, p < 0.05, two-sided. d, MEG PPC analysis of task-irrelevant trials (N = 65) reveals significant category-selective synchrony below 25 Hz for the face-selective GED filter (i.e., faces > objects for face-selective electrodes) in both V1/V2 (top row) and PFC ROIs (bottom row) and for the object-selective synchrony (objects > faces for object-selective electrodes) in the PFC ROI only. Brain surfaces in panels a,c are from Freesurfer.
Extended Data Fig. 5 Prediction #3: Interareal connectivity preregistered analysis. a, iEEG electrode coverage used to assess content-selective synchrony for IIT ROIs (top, Npatients = 4) & GNWT ROIs (bottom, Npatients = 21). Electrode coverage varied between ROIs as interareal connectivity was assessed between electrodes on a per-participant basis. In addition, two example category-selective electrodes are shown (right): one face-selective, and one object-selective. Error bars depict standard error of the mean. b, iEEG Pairwise phase consistency (PPC) analysis of task-irrelevant trials reveals significant content-selective synchrony (e.g. faces > objects for face-selective electrodes; left; objects > faces for object-selective electrodes; right) in V1/V2 ROIs (top row), but not in PFC ROIs (bottom row). Color bars represent the average change in PPC (face and object trials) for each node (face-selective, object-selective). Positive values reflect stronger connectivity for faces, while negative values reflect stronger connectivity for objects. c, MEG (N = 65) cortical time-series were extracted per participant from cortical parcels in V1/V2 (blue), PFC (green) and in a fusiform (red) ROIs. Category-selective signals were obtained by creating a category-selective GED filter (i.e., contrasting face-object trials against any other stimulus category trials) on the activity extracted from the fusiform ROI. Face- (bottom left) and object-selective (bottom right) responses averaged across participants are shown at the bottom. Error bars depict 95% CI. Here and below, significance was assessed using cluster-based permutation tests, p < 0.05, two-sided. d, MEG PPC analysis of task-irrelevant trials (N = 65) reveals significant category-selective synchrony below 25 Hz for the face-selective GED filter (i.e., faces > objects for face-selective electrodes) in both V1/V2 (top row) and PFC ROIs (bottom row) and for the object-selective synchrony (objects > faces for object-selective electrodes) in the PFC ROI only. Brain surfaces in panels a,c are from Freesurfer.CC BY · PubMed Central
Extended Data Fig. 6 Control analysis for the interareal connectivity prediction. a, iEEG PPC analysis of task-irrelevant trials did not reveal any significant category-selective synchrony cluster in posterior (top) or PFC (bottom) ROIs after removing the evoked response. Same conventions, sample size and statistical tests as in Extended Data Fig. 5 are used here and below. b, MEG PPC analysis of task-irrelevant trials also did not reveal any synchrony cluster in any ROI after removing the evoked response. c, iEEG DFC analysis of task-irrelevant trials without removing the evoked response reveals significant content-selective connectivity between object-selective electrodes and V1/V2 electrodes (top-right), reflected as broadband (25–125 Hz) decrease in the change in DFC (e.g., faces < objects). Similar broadband changes in DFC (faces > objects) were observed for face-selective electrodes in PFC (bottom-left). Smaller significant effects were detected between face-selective and V1/V2 electrodes (top-left) and for object-selective and PFC electrodes (bottom-right). d, MEG DFC analysis of task-irrelevant trials without removing the evoked response reveal significant content-selective synchrony between the face-selective GED filter node and both V1/V2 (top-left) and PFC (bottom-left). This is reflected in an increase in low-frequency connectivity (< 25 Hz) combined with a decrease in high-frequency connectivity (25–100 Hz). Smaller yet significant effects were detected for the object-selective GED filter (right). e, Generalized psychophysiological interactions (gPPI) task-related connectivity analysis of task-irrelevant (left) and task-relevant (right) trials revealed weak clusters of content-selective connectivity with FFA as the analysis seed (p < 0.01, uncorrected). Common significant regions showing task-related connectivity in task-irrelevant, task-relevant, and combined conditions include V1/V2, right intraparietal sulcus (IPS), and right inferior frontal gyrus (IFG). f, gPPI task-related connectivity analysis of task-irrelevant (left), task-relevant (middle), and combined conditions revealed weak clusters of content-selective connectivity with lateral occipital complex (LOC) as the analysis seed (p < 0.01, uncorrected). Overall, no common significant regions showed task-related connectivity. Brain surfaces in panel e, f are from Freesurfer.
Extended Data Fig. 6 Control analysis for the interareal connectivity prediction. a, iEEG PPC analysis of task-irrelevant trials did not reveal any significant category-selective synchrony cluster in posterior (top) or PFC (bottom) ROIs after removing the evoked response. Same conventions, sample size and statistical tests as in Extended Data Fig. 5 are used here and below. b, MEG PPC analysis of task-irrelevant trials also did not reveal any synchrony cluster in any ROI after removing the evoked response. c, iEEG DFC analysis of task-irrelevant trials without removing the evoked response reveals significant content-selective connectivity between object-selective electrodes and V1/V2 electrodes (top-right), reflected as broadband (25–125 Hz) decrease in the change in DFC (e.g., faces < objects). Similar broadband changes in DFC (faces > objects) were observed for face-selective electrodes in PFC (bottom-left). Smaller significant effects were detected between face-selective and V1/V2 electrodes (top-left) and for object-selective and PFC electrodes (bottom-right). d, MEG DFC analysis of task-irrelevant trials without removing the evoked response reveal significant content-selective synchrony between the face-selective GED filter node and both V1/V2 (top-left) and PFC (bottom-left). This is reflected in an increase in low-frequency connectivity (< 25 Hz) combined with a decrease in high-frequency connectivity (25–100 Hz). Smaller yet significant effects were detected for the object-selective GED filter (right). e, Generalized psychophysiological interactions (gPPI) task-related connectivity analysis of task-irrelevant (left) and task-relevant (right) trials revealed weak clusters of content-selective connectivity with FFA as the analysis seed (p < 0.01, uncorrected). Common significant regions showing task-related connectivity in task-irrelevant, task-relevant, and combined conditions include V1/V2, right intraparietal sulcus (IPS), and right inferior frontal gyrus (IFG). f, gPPI task-related connectivity analysis of task-irrelevant (left), task-relevant (middle), and combined conditions revealed weak clusters of content-selective connectivity with lateral occipital complex (LOC) as the analysis seed (p < 0.01, uncorrected). Overall, no common significant regions showed task-related connectivity. Brain surfaces in panel e, f are from Freesurfer.CC BY · PubMed Central
Extended Data Fig. 7 An overview of theoretical predictions, experimental outcomes and interpretations. Left: Preregistered predictions of IIT (top) and GNWT (bottom) (see also ref. 12; Fig. 1). Key hypotheses (second column, Key hypotheses) are described alongside the three analyses used to test them (third column, Test): decoding (prediction #1; Fig. 2), activation & RSA (prediction #2; Fig. 3), and synchrony (prediction #3; Fig. 4). Potential outcomes and their interpretations are detailed in the fourth column (Possible outcome and interpretation), with outcomes aligning with predictions framed in green (pass) and contradictory outcomes framed in red (fail). Solid frames denote critical predictions, while dotted gray frames indicate non-critical predictions. This section reflects the theoretical expectations before the experiment. Right: summary of the actual findings, integrating results across modalities and analyses. Key findings for each prediction are described (fifth column; ‘Result’) with white denoting alignment with predictions, red indicating contradiction, white/red mixtures showing partial support or failure, and yellow indicating inconclusive results. Final conclusions synthesize these findings, using the same color coding. For IIT, the results mix a passed prediction (content-specific complex of neural units in posterior cortex, throughout the persistence of a percept, independent of the task) with a failure (maximum integrated information). For GNWT, the results consisted of a mixture of a partly challenged prediction (of an all-or-none threshold and amplification of information updating the content of consciousness in PFC) and a partly supported one, given the inconclusive result for orientation (of global broadcasting of information in the PFC). These results are discussed in the main text, including their implications for other consciousness theories.
Extended Data Fig. 7 An overview of theoretical predictions, experimental outcomes and interpretations. Left: Preregistered predictions of IIT (top) and GNWT (bottom) (see also ref. 12; Fig. 1). Key hypotheses (second column, Key hypotheses) are described alongside the three analyses used to test them (third column, Test): decoding (prediction #1; Fig. 2), activation & RSA (prediction #2; Fig. 3), and synchrony (prediction #3; Fig. 4). Potential outcomes and their interpretations are detailed in the fourth column (Possible outcome and interpretation), with outcomes aligning with predictions framed in green (pass) and contradictory outcomes framed in red (fail). Solid frames denote critical predictions, while dotted gray frames indicate non-critical predictions. This section reflects the theoretical expectations before the experiment. Right: summary of the actual findings, integrating results across modalities and analyses. Key findings for each prediction are described (fifth column; ‘Result’) with white denoting alignment with predictions, red indicating contradiction, white/red mixtures showing partial support or failure, and yellow indicating inconclusive results. Final conclusions synthesize these findings, using the same color coding. For IIT, the results mix a passed prediction (content-specific complex of neural units in posterior cortex, throughout the persistence of a percept, independent of the task) with a failure (maximum integrated information). For GNWT, the results consisted of a mixture of a partly challenged prediction (of an all-or-none threshold and amplification of information updating the content of consciousness in PFC) and a partly supported one, given the inconclusive result for orientation (of global broadcasting of information in the PFC). These results are discussed in the main text, including their implications for other consciousness theories.CC BY · PubMed Central

Verification

Claims the paper makes

16 Valid · 0 Not valid · 11 Not checked · 159 Own results and interpretations

86 more claims

Create a free account to see all 186 claims and to verify the 1 reference still open.

See all claims — free account
  • It may state two separate claims as one. 46
  • Probably not a substantial claim. 59
  • The quote only partly states this claim. 2

Create a free account to see these claims.

Claims other papers make about this one

Each is checked against this paper’s own text: does it say what the citing paper says it does?

Self-check

Percentages, sums and reported differences re-computed from the paper’s own numbers.

Each contradiction between two passages listed here was confirmed by an independent check.

2 of 2

Citations

Cites

Show all 127 references

Research works printed but not linked: 5

  1. Dehaene, S. Consciousness and the Brain: Deciphering How the Brain Codes Our Thoughts (Penguin, 2014).
  2. Jackendoff, R. Consciousness and the Computational Mind (MIT Press, 1987).
  3. Popper, K. The Logic of Scientific Discovery (Routledge, 1935).
  4. Penny, W., Friston, K., Ashburner, J., Kiebel, S. & Nichols, T. Statistical Parametric Mapping: the Analysis of Funtional Brain Images 1st edn (Elsevier/Academic Press, 2007).
  5. Nadeau, C. & Bengio, Y. in Advances in Neural Information Processing Systems 12 (eds Solla, S. A., Leen, T. K. & Müller, K.-R.) 307–313 (MIT Press, 2000).

Cited by

See all 136

Metadata

Authors
Cogitate Consortium, Ferrante, O., Gorska-Klimowska, U., Henin, S., Hirschhorn, R., Khalaf, A., Lepauvre, A., Liu, L., Richter, D., Vidal, Y., Bonacchi, N., Brown, T., Sripad, P., Armendariz, M., Bendtz, K., Ghafari, T., Hetenyi, D., Jeschke, J., Kozma, C., Mazumder, D. R., Montenegro, S., Seedat, A., Sharafeldin, A., Yang, S., Baillet, S., Chalmers, D. J., Cichy, R. M., Fallon, F., Panagiotaropoulos, T. I., Blumenfeld, H., de Lange, F. P., Devore, S., Jensen, O., Kreiman, G., Luo, H., Boly, M., Dehaene, S., Koch, C., Tononi, G., Pitts, M., Mudrik, L., & Melloni, L.
Affiliations
  • University of Birmingham (GB)
  • New York University (US)
  • Tel Aviv University (IL)
  • Yale University (US)
  • Radboud University Nijmegen (NL)
  • Beijing Language and Culture University (CN)
  • ISPA - Instituto Universitário (PT)
  • Max Planck Institute for Empirical Aesthetics (DE)
  • Boston Children's Hospital (US)
  • University of Oxford (GB)
  • UCL Queen Square Institute of Neurology (GB)
  • University of Wisconsin–Madison (US)
  • Georgia Institute of Technology (US)
  • University of Amsterdam (NL)
  • Montreal Neurological Institute and Hospital (CA)
  • Humboldt-Universität zu Berlin (DE)
  • St. John's University (US)
  • National and Kapodistrian University of Athens (GR)
  • Peking University (CN)
  • Inserm (FR)
  • Reed College (US)
Venue
Nature
Published
2025-04-30
Volume
642
Issue
8066
Pages
133-142
ISSN
  • 0028-0836 (ISSN-L)
  • 1476-4687
OpenAlex
W4410019332
Cited by
136
References
127
Citations by year
2026: 89 · 2025: 47
FWCI
141.40
Type
journal article
Language
en
Open access
Licence
Locations
  • Nature (publishedVersion, cc-by)
  • Europe PMC (PubMed Central) (publishedVersion, cc-by)
  • PubMed Central (publishedVersion, cc-by)
  • PubMed (publishedVersion)
  • University of Birmingham Research Portal (University of Birmingham) (publishedVersion, cc-by)
  • Universitätsbibliographie, Universität Duisburg-Essen (submittedVersion)
  • Lirias (KU Leuven) (submittedVersion, cc-by)
  • Refubium (Universitätsbibliothek der Freien Universität Berlin) (submittedVersion, cc-by)
  • Radboud Repository (Radboud University) (submittedVersion)
  • Universitätsbibliothek der FU Berlin Hochschulschriftenstelle u. Dokumentenserver (cc-by)
Funders
National Institute of General Medical Sciences (T32GM144273)
Topics
  • Social Sciences › Arts and Humanities › Philosophy › Philosophy and Theoretical Science
  • Life Sciences › Neuroscience › Cognitive Neuroscience › Neural dynamics and brain function
  • Life Sciences › Neuroscience › Cognitive Neuroscience › Visual perception and processing mechanisms
Keywords
theory of consciousness, integrated information theory, global neuronal workspace theory, adversarial collaboration, preregistration, visual awareness, neuronal synchronization, prefrontal cortex, inferior frontal cortex, stimulus duration, theory testing, open science
MeSH terms
Adult, Brain, Consciousness, Electroencephalography, Female, Humans, Information Theory, Magnetic Resonance Imaging, Male, Models, Neurological, Neurons, Magnetoencephalography, Young Adult

About these checks

Registry, retraction, Cites and statistics results are computed, not judged, with one exception: a printed reference that no index lists is read once by a model before it counts as a citation error. Claims are extracted by a model and kept only when their quote appears verbatim in the text; each cited source is then checked, with a model’s help, for whether it says what the claim relies on. Those verdicts can be wrong — read the claim’s quote and the cited source before relying on one.

The claim verdicts this report counts are experimental: their accuracy is not yet measured.

A language model drew the claims from the paper on 2026-10-10, under version 3 of the claim definition (model deepseek-v4.1-flash, prompt extract-v3).

A second model labelled each claim on 2026-10-10 (model jev-1.13-20260917, definition revision gold-guideline-v0.2).

Cited sources are checked with a language model’s help (gpt-6-sol).

Statistics and arithmetic are recomputed, not judged.

Confidence bands are shown only for fields calibrated on our annotated test set. None is calibrated yet, so no band is shown.

What counts as a claim ›How we measure confidence ›How we check this ›

Are you an author, or do you see a problem with this page? Request a review

How to cite

Cite CoChat for the checks on this page, and the paper for its own findings.

This page
CoChat. (2026). Citation check: Adversarial testing of global neuronal workspace and integrated information theories of consciousness. https://app.cochat.ai/papers/10.1038/s41586-025-08888-1
The paper
Cogitate Consortium, Ferrante, O., Gorska-Klimowska, U., Henin, S., Hirschhorn, R., Khalaf, A., Lepauvre, A., Liu, L., Richter, D., Vidal, Y., Bonacchi, N., Brown, T., Sripad, P., Armendariz, M., Bendtz, K., Ghafari, T., Hetenyi, D., Jeschke, J., Kozma, C., . . . Melloni, L. (2025). Adversarial testing of global neuronal workspace and integrated information theories of consciousness. Nature. https://doi.org/10.1038/s41586-025-08888-1

Data sources

Bibliographic data: Semantic Scholar, OpenAlex, Crossref.

Contains information from the Semantic Scholar Academic Graph Datasets, made available under the ODC Attribution License (ODC-BY 1.0).

Semantic Scholar’s data is described in: Kinney, R., et al. (2023). The Semantic Scholar Open Data Platform. arXiv:2301.10140.