

The DOI matches its Crossref record; 12 of the 12 references it cites were found in a registry or an index.
Fluctuating methylation clocks for cell lineage tracing at high temporal resolution in human tissues
Published version of a preprint
Abstract
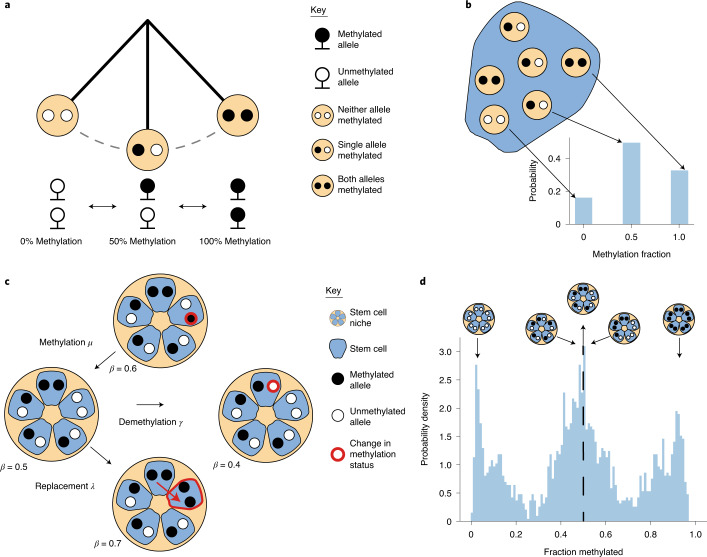
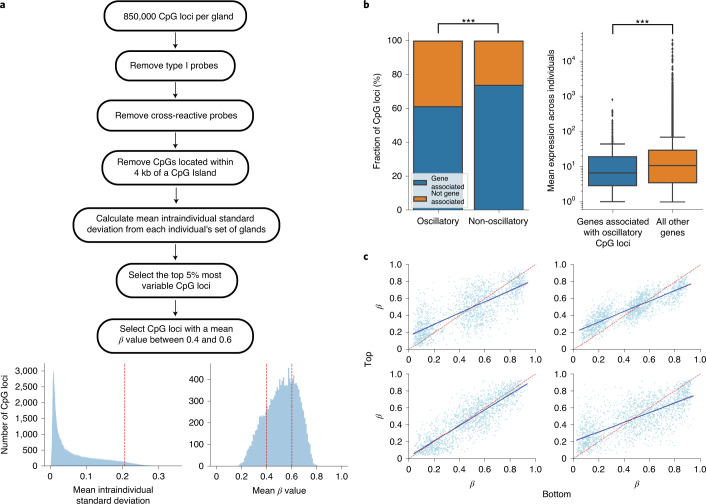
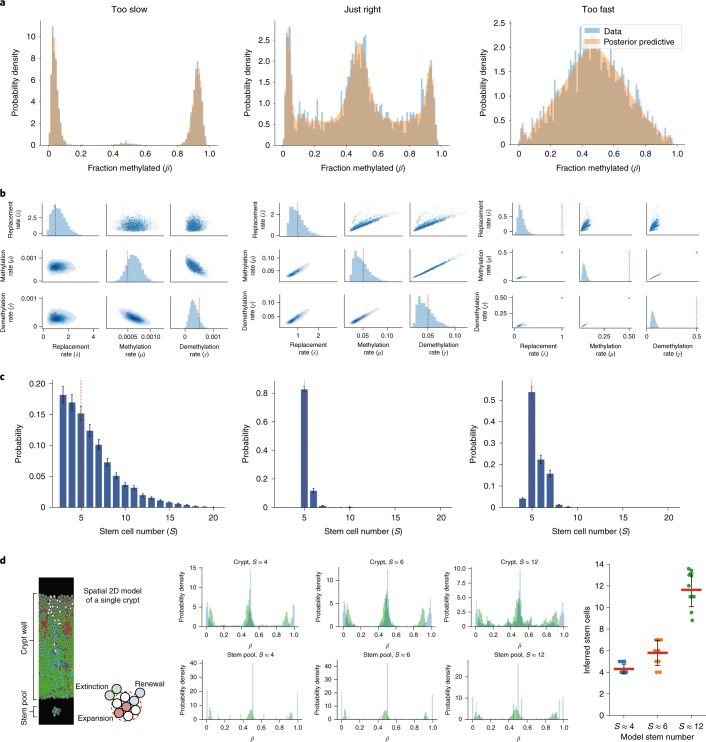
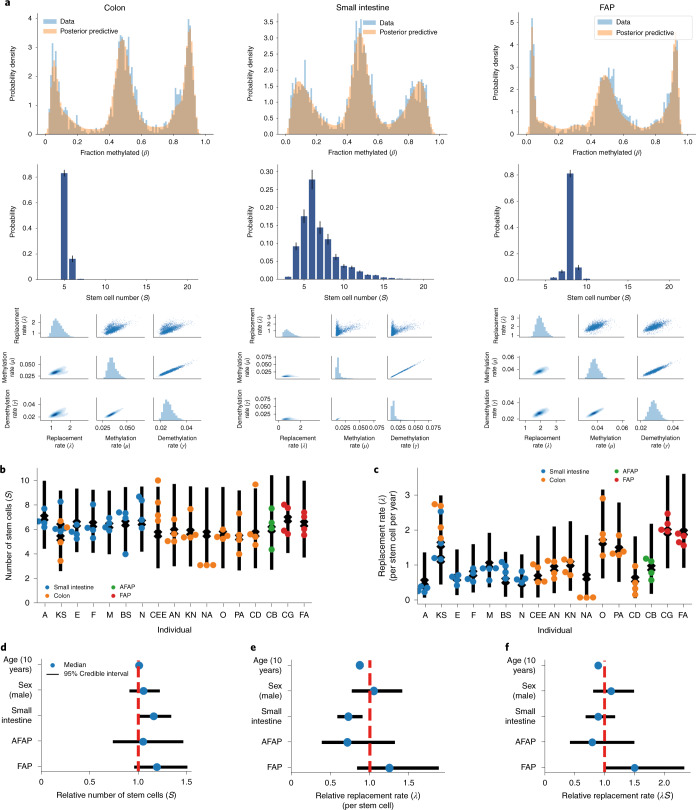
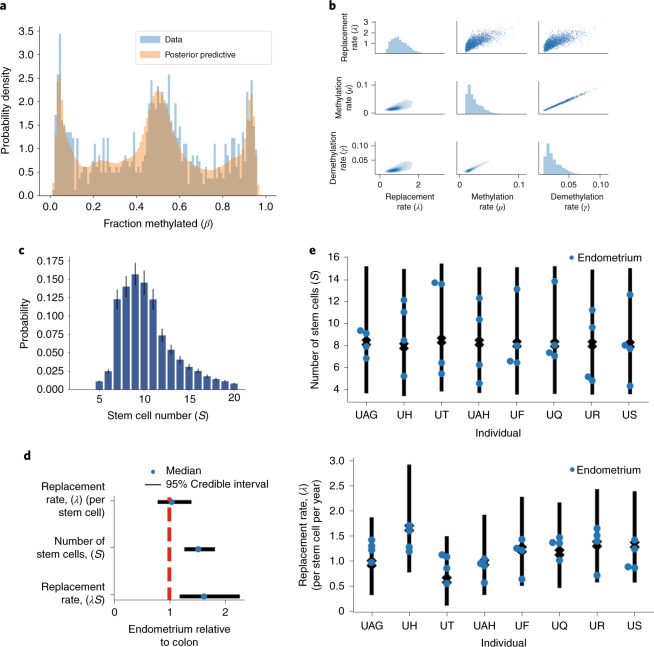
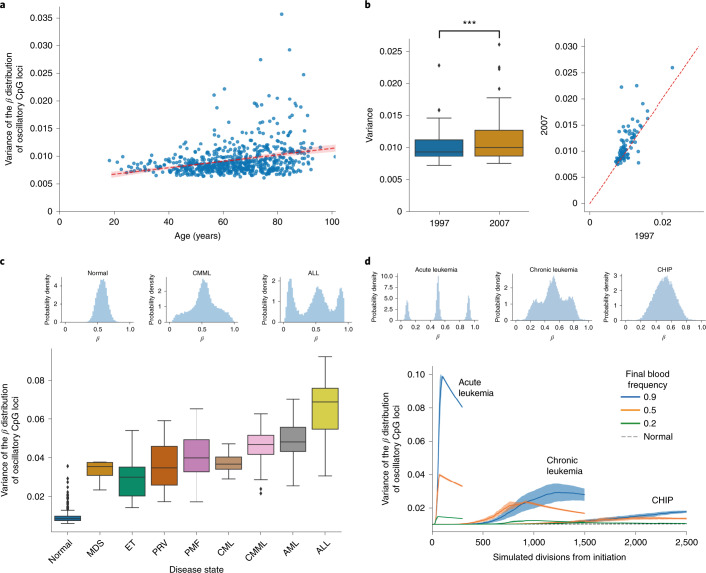
Molecular clocks that record cell ancestry mutate too slowly to measure the short-timescale dynamics of cell renewal in adult tissues. Here, we show that fluctuating DNA methylation marks can be used as clocks in cells where ongoing methylation and demethylation cause repeated ‘flip–flops’ between methylated and unmethylated states. We identify endogenous fluctuating CpG (fCpG) sites using standard methylation arrays and develop a mathematical model to quantitatively measure human adult stem cell dynamics from these data. Small intestinal crypts were inferred to contain slightly more stem cells than the colon, with slower stem cell replacement in the small intestine. Germline APC mutation increased the number of replacements per crypt. In blood, we measured rapid expansion of acute leukemia and slower growth of chronic disease. Thus, the patterns of human somatic cell birth and death are measurable with fluctuating methylation clocks (FMCs).
Overview
The claims and statistics of this paper haven’t been checked yet.
Run the check — free, no account needed. It reads the open-access text and checks the sources it cites.
Integrity signals
Registry
Cites
Statistics
Figures
Verification
Claims the paper makes
The claims and statistics of this paper haven’t been checked yet.
Run the check — free, no account needed. It reads the open-access text and checks the sources it cites.
Claims other papers make about this one
Each is checked against this paper’s own text: does it say what the citing paper says it does?
In the citing paper
“Clonal signals have been identified in bulk DNA methylation data obtained from cancer and healthy tissues17,18.”
From Clonal tracing with somatic epimutations reveals dynamics of blood ageing (2025) · cites this paper as [17]
Self-check
Percentages, sums and reported differences re-computed from the paper’s own numbers.
The self-check needs the paper’s full text.
Citations
Cites
Stan : A Probabilistic Programming Language
Carpenter, B., Gelman, A., Hoffman, M. D., Lee, D., Goodrich, B., Betancourt, M., Brubaker, M., Guo, J., Li, P., & Riddell, A. (2017) · Journal of Statistical Software · doi:10.18637/jss.v076.i01 · Cited by 7,754
Zhan, T., Rindtorff, N., & Boutros, M. (2017) · Oncogene · doi:10.1038/onc.2016.304 · Cited by 2,626
Vehtari, A., Gelman, A., Simpson, D., Carpenter, B., & Bürkner, P.-C. (2021) · Bayesian Analysis · doi:10.1214/20-ba1221 · Cited by 1,810
High burden and pervasive positive selection of somatic mutations in normal human skin
Martincorena, I., Roshan, A., Gerstung, M., Ellis, P., Van Loo, P., McLaren, S., Wedge, D. C., Fullam, A., Alexandrov, L. B., Tubio, J. M., et al. (2015) · Science · doi:10.1126/science.aaa6806 · Cited by 1,770
Pidsley, R., Zotenko, E., Peters, T. J., Lawrence, M. G., Risbridger, G. P., Molloy, P., Van Djik, S., Muhlhausler, B., Stirzaker, C., & Clark, S. J. (2016) · Genome biology · doi:10.1186/s13059-016-1066-1 · Cited by 1,480
Self-citationClonal hematopoiesis in human aging and disease
Jaiswal, S., & Ebert, B. L. (2019) · Science · doi:10.1126/science.aan4673 · Cited by 1,156
Tissue-specific mutation accumulation in human adult stem cells during life
Blokzijl, F., de Ligt, J., Jager, M., Sasselli, V., Roerink, S., Sasaki, N., Huch, M., Boymans, S., Kuijk, E., Prins, P., et al. (2016) · Nature · doi:10.1038/nature19768 · Cited by 935
Population dynamics of normal human blood inferred from somatic mutations
Lee-Six, H., Øbro, N. F., Shepherd, M. S., Grossmann, S., Dawson, K., Belmonte, M., Osborne, R. J., Huntly, B. J. P., Martincorena, I., Anderson, E., et al. (2018) · Nature · doi:10.1038/s41586-018-0497-0 · Cited by 604
Mitochondrial DNA mutations in human colonic crypt stem cells
Taylor, R. W., Barron, M. J., Borthwick, G. M., Gospel, A., Chinnery, P. F., Samuels, D. C., Taylor, G. A., Plusa, S. M., Needham, S. J., Greaves, L. C., et al. (2003) · Journal of Clinical Investigation · doi:10.1172/jci19435 · Cited by 530
The mutational landscape of normal human endometrial epithelium
Moore, L., Leongamornlert, D., Coorens, T. H. H., Sanders, M. A., Ellis, P., Dentro, S. C., Dawson, K. J., Butler, T., Rahbari, R., Mitchell, T. J., et al. (2020) · Nature · doi:10.1038/s41586-020-2214-z · Cited by 499
The evolutionary dynamics and fitness landscape of clonal hematopoiesis
Watson, C. J., Papula, A. L., Poon, G. Y. P., Wong, W. H., Young, A. L., Druley, T. E., Fisher, D. S., & Blundell, J. R. (2020) · Science · doi:10.1126/science.aay9333 · Cited by 444
Kozar, S., Morrissey, E., Nicholson, A. M., van der Heijden, M., Zecchini, H. I., Kemp, R., Tavaré, S., Vermeulen, L., & Winton, D. J. (2013) · Cell Stem Cell · doi:10.1016/j.stem.2013.08.001 · Cited by 214
Research works printed but not linked: 84
- Lopez-Garcia, C., Klein, A. M., Simons, B. D. & Winton, D. J. Intestinal stem cell replacement follows a pattern of neutral drift. Science 330, 822–825 (2010). · DOI
- Snippert, H. J. et al. Intestinal crypt homeostasis results from neutral competition between symmetrically dividing Lgr5 stem cells. Cell 143, 134–144 (2010). · DOI · Paper page
- Monné, M., Chan, K. W., Slotboom, D.-J. & Kunji, E. R. S. Functional expression of eukaryotic membrane proteins in Lactococcus lactis. Protein Sci. 14, 3048–3056 (2005). · DOI
- Han, S. et al. Defining the identity and dynamics of adult gastric isthmus stem cells. Cell Stem Cell 25, 342–356 (2019). · DOI
- Snippert, H. J., Schepers, A. G., Es, J. H., Simons, B. D. & Clevers, H. Biased competition between Lgr5 intestinal stem cells driven by oncogenic mutation induces clonal expansion. EMBO Rep. 15, 62–69 (2014). · DOI
- Andersen, M. S. et al. Tracing the cellular dynamics of sebaceous gland development in normal and perturbed states. Nat. Cell Biol. 21, 924–932 (2019). · DOI
- Lan, X. et al. Fate mapping of human glioblastoma reveals an invariant stem cell hierarchy. Nature 549, 227–232 (2017). · DOI
- Sánchez-Danés, A. et al. Defining the clonal dynamics leading to mouse skin tumour initiation. Nature 536, 298–303 (2016). · DOI
- Aragona, M. et al. Defining stem cell dynamics and migration during wound healing in mouse skin epidermis. Nat. Commun. 8, 14684 (2017). · DOI
- Blanpain, C. & Simons, B. D. Unravelling stem cell dynamics by lineage tracing. Nat. Rev. Mol. Cell Biol. 14, 489–502 (2013). · DOI
- Baker, A.-M. et al. Crypt fusion as a homeostatic mechanism in the human colon. Gut 68, 1986–1993 (2019). · DOI
- Lavery, D. L. et al. The stem cell organisation, and the proliferative and gene expression profile of Barrett’s epithelium, replicates pyloric-type gastric glands. Gut 63, 1854–1863 (2014). · DOI
- Gaisa, N. T. et al. The human urothelium consists of multiple clonal units, each maintained by a stem cell. J. Pathol. 225, 163–171 (2011). · DOI
- Gaisa, N. T. et al. Clonal architecture of human prostatic epithelium in benign and malignant conditions. J. Pathol. 225, 172–180 (2011). · DOI
- Ludwig, L. S. et al. Lineage tracing in humans enabled by mitochondrial mutations and single-cell genomics. Cell 176, 1325–1339 (2019). · DOI · Paper page
- Stamp, C. et al. Predominant asymmetrical stem cell fate outcome limits the rate of niche succession in human colonic crypts. EBioMedicine 31, 166–173 (2018). · DOI
- Moad, M. et al. Multipotent basal stem cells, maintained in localized proximal niches, support directed long-ranging epithelial flows in human prostates. Cell Rep. 20, 1609–1622 (2017). · DOI
- Cereser, B. et al. Analysis of clonal expansions through the normal and premalignant human breast epithelium reveals the presence of luminal stem cells. J. Pathol. 244, 61–70 (2018). · DOI
- Gutierrez-Gonzalez, L. et al. Analysis of the clonal architecture of the human small intestinal epithelium establishes a common stem cell for all lineages and reveals a mechanism for the fixation and spread of mutations. J. Pathol. 217, 489–496 (2009). · DOI
- Greaves, L. C. et al. Mitochondrial DNA mutations are established in human colonic stem cells, and mutated clones expand by crypt fission. Proc. Natl Acad. Sci. USA 103, 714–719 (2006). · DOI
- Baker, A. M. et al. Quantification of crypt and stem cell evolution in the normal and neoplastic human colon. Cell Rep. 8, 940–947 (2014). · DOI
- Fellous, T. G. et al. Locating the stem cell niche and tracing hepatocyte lineages in human liver. Hepatology 49, 1655–1663 (2009). · DOI · Paper page
- Humphries, A. et al. Lineage tracing reveals multipotent stem cells maintain human adenomas and the pattern of clonal expansion in tumor evolution. Proc. Natl Acad. Sci. USA 110, E2490–E2499 (2013). · DOI
- Graham, T. A. et al. Use of methylation patterns to determine expansion of stem cell clones in human colon tissue. Gastroenterology 140, 1241–1250 (2011). · DOI
- Yatabe, Y., Tavaré, S. & Shibata, D. Investigating stem cells in human colon by using methylation patterns. Proc. Natl Acad. Sci. USA 98, 10839–10844 (2001). · DOI
- Nicolas, P., Kim, K. M., Shibata, D. & Tavaré, S. The stem cell population of the human colon crypt: analysis via methylation patterns. PLoS Comput. Biol. 3, e28 (2007). · DOI
- Chu, M. W. et al. Lack of increases in methylation at three CpG-rich genomic loci in non-mitotic adult tissues during aging. BMC Med. Genet. 8, 50 (2007). · DOI
- Kim, J. Y., Siegmund, K. D., Tavaré, S. & Shibata, D. Age-related human small intestine methylation: evidence for stem cell niches. BMC Med. 3, 10 (2005). · DOI
- Kim, J. Y., Tavaré, S. & Shibata, D. Human hair genealogies and stem cell latency. BMC Biol. 4, 2 (2006). · DOI
- Siegmund, K. D., Marjoram, P., Woo, Y.-J. J., Tavaré, S. & Shibata, D. Inferring clonal expansion and cancer stem cell dynamics from DNA methylation patterns in colorectal cancers. Proc. Natl Acad. Sci. USA 106, 4828–4833 (2009). · DOI
- Kim, K. M. & Shibata, D. Tracing ancestry with methylation patterns: most crypts appear distantly related in normal adult human colon. BMC Gastroenterol. 4, 8 (2004). · DOI
- Campbell, F., Fuller, C. E., Williams, G. T. & Williams, E. D. Human colonic stem cell mutation frequency with and without irradiation. J. Pathol. 174, 175–182 (1994). · DOI
- Novelli, M. et al. X-inactivation patch size in human female tissue confounds the assessment of tumor clonality. Proc. Natl Acad. Sci. USA 100, 3311–3314 (2003). · DOI
- Simons, B. D. Deep sequencing as a probe of normal stem cell fate and preneoplasia in human epidermis. Proc. Natl Acad. Sci. USA 113, 128–133 (2016). · DOI
- Williams, M. J., Werner, B., Barnes, C. P., Graham, T. A. & Sottoriva, A. Identification of neutral tumor evolution across cancer types. Nat. Genet. 48, 238–244 (2016). · DOI
- Williams, M. J. et al. Quantification of subclonal selection in cancer from bulk sequencing data. Nat. Genet. 50, 895–903 (2018). · DOI
- Galandiuk, S. et al. Field cancerization in the intestinal epithelium of patients with Crohn’s ileocolitis. Gastroenterology 142, 855–864 (2012). · DOI
- Pipinikas, C. P. et al. Cell migration leads to spatially distinct but clonally related airway cancer precursors. Thorax 69, 548–557 (2014). · DOI
- Thirlwell, C. et al. Clonality assessment and clonal ordering of individual neoplastic crypts shows polyclonality of colorectal adenomas. Gastroenterology 138, 1441–1454 (2010). · DOI
- Leedham, S. J. et al. Individual crypt genetic heterogeneity and the origin of metaplastic glandular epithelium in human Barrett’s oesophagus. Gut 57, 1041–1048 (2008). · DOI
- Leedham, S. J. et al. Clonality, founder mutations, and field cancerization in human ulcerative colitis–associated neoplasia. Gastroenterology 136, 542–550 (2009). · DOI
- Kuipers, J., Jahn, K., Raphael, B. J. & Beerenwinkel, N. Single-cell sequencing data reveal widespread recurrence and loss of mutational hits in the life histories of tumors. Genome Res. 27, 1885–1894 (2017). · DOI
- Kangaspeska, S. et al. Transient cyclical methylation of promoter DNA. Nature 452, 112–115 (2008). · DOI
- Métivier, R. et al. Cyclical DNA methylation of a transcriptionally active promoter. Nature 452, 45–50 (2008). · DOI
- Rulands, S. et al. Genome-scale oscillations in DNA methylation during exit from pluripotency. Cell Syst. 7, 63–76 (2018). · DOI
- Parry, A., Rulands, S. & Reik, W. Active turnover of DNA methylation during cell fate decisions. Nat. Rev. Genet. 22, 59–66 (2021). · DOI
- Nicholson, A. M. et al. Fixation and spread of somatic mutations in adult human colonic epithelium. Cell Stem Cell 22, 909–918 (2018). · DOI
- Muzny, D. M. et al. Comprehensive molecular characterization of human colon and rectal cancer. Nature 487, 330–337 (2012). · DOI · Paper page
- Kaaij, L. T. J. et al. DNA methylation dynamics during intestinal stem cell differentiation reveals enhancers driving gene expression in the villus. Genome Biol. 14, R50 (2013). · DOI
- Nishisho, I. et al. Mutations of chromosome 5q21 genes in FAP and colorectal cancer patients. Science 253, 665–669 (1991). · DOI
- Kinzler, K. W. et al. Identification of FAP locus genes from chromosome 5q21. Science 253, 661–665 (1991). · DOI
- Groden, J. et al. Identification and characterization of the familial adenomatous polyposis coli gene. Cell 66, 589–600 (1991). · DOI
- Korinek, V. et al. Constitutive transcriptional activation by a β-catenin-Tcf complex in APC–/– colon carcinoma. Science 275, 1784–1787 (1997). · DOI · Paper page
- Sansom, O. J. et al. Loss of Apc in vivo immediately perturbs Wnt signaling, differentiation, and migration. Genes Dev. 18, 1385–1390 (2004). · DOI
- Korinek, V. et al. Depletion of epithelial stem-cell compartments in the small intestine of mice lacking Tcf-4. Nat. Genet. 19, 379–383 (1998). · DOI
- Pinto, D. & Clevers, H. Wnt control of stem cells and differentiation in the intestinal epithelium. Exp. Cell. Res. 306, 357–363 (2005). · DOI
- Pinto, D., Gregorieff, A., Begthel, H. & Clevers, H. Canonical Wnt signals are essential for homeostasis of the intestinal epithelium. Genes Dev. 17, 1709–1713 (2003). · DOI · Paper page
- Kim, J. Y., Tavaré, S. & Shibata, D. Counting human somatic cell replications: methylation mirrors endometrial stem cell divisions. Proc. Natl Acad. Sci. USA 102, 17739–17744 (2005). · DOI
- Tempest, N. et al. Histological 3D reconstruction and in vivo lineage tracing of the human endometrium. J. Pathol. 251, 440–451 (2020). · DOI
- Ritsma, L. et al. Intestinal crypt homeostasis revealed at single stem cell level by in vivo live-imaging. Nature 507, 362–365 (2014). · DOI
- Hannum, G. et al. Genome-wide methylation profiles reveal quantitative views of human aging rates. Mol. Cell 49, 359–367 (2013). · DOI · Paper page
- Tan, Q. et al. Epigenetic drift in the aging genome: a ten-year follow-up in an elderly twin cohort. Int. J. Epidemiol. 45, 1146–1158 (2016).
- Ricci-Vitiani, L. et al. Identification and expansion of human colon-cancer-initiating cells. Nature 445, 111–115 (2007). · DOI
- Siegel, R. L., Miller, K. D., Fuchs, H. E. & Jemal, A. Cancer statistics, 2021. CA. Cancer J. Clin. 71, 7–33 (2021). · DOI · Paper page
- Raghav, K. & Overman, M. J. Small bowel adenocarcinomas—existing evidence and evolving paradigms. Nat. Rev. Clin. Oncol. 10, 534–544 (2013). · DOI
- Tomasetti, C., Li, L. & Vogelstein, B. Stem cell divisions, somatic mutations, cancer etiology, and cancer prevention. Science 355, 1330–1334 (2017). · DOI
- Aryee, M. J. et al. Minfi: a flexible and comprehensive Bioconductor package for the analysis of Infinium DNA methylation microarrays. Bioinformatics 30, 1363–1369 (2014). · DOI
- Edgar, R., Domrachev, M. & Lash, A. E. Gene Expression Omnibus: NCBI gene expression and hybridization array data repository. Nucleic Acids Res. 30, 207–210 (2002). · DOI · Paper page
- Barrett, T. et al. NCBI GEO: archive for functional genomics data sets—update. Nucleic Acids Res. 41, D991–D995 (2013). · DOI · Paper page
- Sierra, M., Fernández, A. & Fraga, M. Epigenetics of aging. Curr. Genomics 16, 435–440 (2015). · DOI
- Zhao, X. et al. CpG island methylator phenotype of myelodysplastic syndrome identified through genome-wide profiling of DNA methylation and gene expression. Br. J. Haematol. 165, 649–658 (2014). · DOI
- Pérez, C. et al. Aberrant DNA methylation profile of chronic and transformed classic Philadelphia-negative myeloproliferative neoplasms. Haematologica 98, 1414–1420 (2013). · DOI
- Maupetit-Mehouas, S. et al. DNA methylation profiling reveals a pathological signature that contributes to transcriptional defects of CD34+ CD15– cells in early chronic-phase chronic myeloid leukemia. Mol. Oncol. 12, 814–829 (2018). · DOI
- Palomo, L. et al. DNA methylation profile in chronic myelomonocytic leukemia associates with distinct clinical, biological and genetic features. Epigenetics 13, 8–18 (2018). · DOI
- Ferreira, H. J. et al. DNMT3A mutations mediate the epigenetic reactivation of the leukemogenic factor MEIS1 in acute myeloid leukemia. Oncogene 35, 3079–3082 (2016). · DOI
- Gabriel, A. S. et al. Epigenetic landscape correlates with genetic subtype but does not predict outcome in childhood acute lymphoblastic leukemia. Epigenetics 10, 717–726 (2015). · DOI
- Chen, Y. A. et al. Discovery of cross-reactive probes and polymorphic CpGs in the Illumina Infinium HumanMethylation450 microarray. Epigenetics 8, 203–209 (2013). · DOI
- Cedar, H. & Bergman, Y. Programming of DNA methylation patterns. Annu. Rev. Biochem. 81, 97–117 (2012). · DOI
- Ushijima, T. et al. Fidelity of the methylation pattern and its variation in the genome. Genome Res. 13, 868–874 (2003). · DOI
- Skilling, J. Nested sampling for general Bayesian computation. Bayesian Anal. 1, 833–860 (2006). · DOI
- Speagle, J. S. dynesty: a dynamic nested sampling package for estimating Bayesian posteriors and evidences. Mon. Notices Royal Astron. Soc. 493, 3132–3158 (2019). · DOI
- Gelman, A. & Rubin, D. B. Inference from iterative simulation using multiple sequences. Stat. Sci. 7, 457–472 (1992). · DOI · Paper page
- Tomasetti, C. et al. Cell division rates decrease with age, providing a potential explanation for the age-dependent deceleration in cancer incidence. Proc. Natl Acad. Sci. USA 116, 20482–20488 (2019). · DOI
- Bravo, R. R. et al. Hybrid Automata Library: a flexible platform for hybrid modeling with real-time visualization. PLoS Comput. Biol. 16, e1007635 (2020). · DOI
Cited by
Single-cell DNA methylation and 3D genome architecture in the human brain
Tian, W., Zhou, J., Bartlett, A., Zeng, Q., Liu, H., Castanon, R. G., Kenworthy, M., Altshul, J., Valadon, C., Aldridge, A., et al. (2023) · Science · doi:10.1126/science.adf5357 · Cited by 154
Clonal tracing with somatic epimutations reveals dynamics of blood ageing
Scherer, M., Singh, I., Braun, M. M., Szu-Tu, C., Sanchez Sanchez, P., Lindenhofer, D., Jakobsen, N. A., Körber, V., Kardorff, M., Nitsch, L., et al. (2025) · Nature · doi:10.1038/s41586-025-09041-8 · Cited by 89
Metadata
- Authors
- Gabbutt, C., Schenck, R. O., Weisenberger, D. J., Kimberley, C., Berner, A., Househam, J., Lakatos, E., Robertson-Tessi, M., Martin, I., Patel, R., Clark, S. K., Latchford, A., Barnes, C. P., Leedham, S. J., Anderson, A. R. A., Graham, T. A., & Shibata, D.
- Venue
- Nature Biotechnology
- Published
- 2022-01-03
- Volume
- 40
- Issue
- 5
- Pages
- 720-730
- ISSN
- 1087-0156
- 1546-1696
- PMC
- PMC9110299
- Cited by
- 76
- References
- 12
- Language
- en
- Funders
- U.S. Department of Health & Human Services | NIH | National Cancer Institute (U54 CA217376, U01CA232382, U54CA143970, U54CA217376)
- Wellcome Trust (108861/7/15/7, 209409/Z/17/Z, 206314/Z/17/Z)
- Cancer Research UK (A19771)
About these checks
Registry, retraction, Cites and statistics results are computed, not judged, with one exception: a printed reference that no index lists is read once by a model before it counts as a citation error. Claims are extracted by a model and kept only when their quote appears verbatim in the text; each cited source is then checked, with a model’s help, for whether it says what the claim relies on. Those verdicts can be wrong — read the claim’s quote and the cited source before relying on one.
Statistics and arithmetic are recomputed, not judged.
Confidence bands are shown only for fields calibrated on our annotated test set. None is calibrated yet, so no band is shown.
What counts as a claim ›How we measure confidence ›How we check this ›
Are you an author, or do you see a problem with this page? Request a review
