

The DOI matches its Crossref record; 69 of the 69 references it cites were found in a registry or an index; 8 of the 54 sources its claims cite were checked for support.
A foundation model for clinical-grade computational pathology and rare cancers detection
Open accessAbstract
The analysis of histopathology images with artificial intelligence aims to enable clinical decision support systems and precision medicine. The success of such applications depends on the ability to model the diverse patterns observed in pathology images. To this end, we present Virchow, the largest foundation model for computational pathology to date. In addition to the evaluation of biomarker prediction and cell identification, we demonstrate that a large foundation model enables pan-cancer detection, achieving 0.95 specimen-level area under the (receiver operating characteristic) curve across nine common and seven rare cancers. Furthermore, we show that with less training data, the pan-cancer detector built on Virchow can achieve similar performance to tissue-specific clinical-grade models in production and outperform them on some rare variants of cancer. Virchow’s performance gains highlight the value of a foundation model and open possibilities for many high-impact applications with limited amounts of labeled training data.
Overview
AI snapshot
Written from the paper’s full text.
TL;DR
Virchow is a 632-million-parameter vision transformer foundation model for computational pathology trained on ~1.5 million H&E whole-slide images from ~100,000 patients. It enables pan-cancer detection with 0.950 specimen-level AUC across common and rare cancers and approaches or exceeds clinical-grade specialist models on several tasks with less training data.
Key findings
- Virchow embeddings achieved the best pan-cancer detection performance across all tested cancer types: overall AUC 0.950, versus 0.940 for UNI, 0.932 for Phikon and 0.907 for CTransPath; rare-cancer AUC was 0.937.
- At 95% sensitivity, the Virchow-based pan-cancer model reached 72.5% specificity, compared with 68.9%, 62.9% and 52.3% for UNI, Phikon and CTransPath, respectively.
- Against clinical products, the pan-cancer model reached AUC 0.980 on prostate, 0.985 on breast and 0.971 on breast lymph node; it was below Paige Prostate (0.995, P < 0.05) and Paige Breast (0.992, P < 0.01), but better than Paige BLN for macrometastases (0.999 versus 0.994, P < 0.05).
- Virchow embeddings ranked top in 7 of 9 biomarker prediction tasks and matched or surpassed other embeddings in 7 of 8 tile-level benchmark tasks.
Methods
- Design: Virchow is a ViT-H/14 model with 632 million parameters trained with DINO v.2 self-supervised learning on 2 billion tiles sampled from approximately 13 billion available tissue tiles.
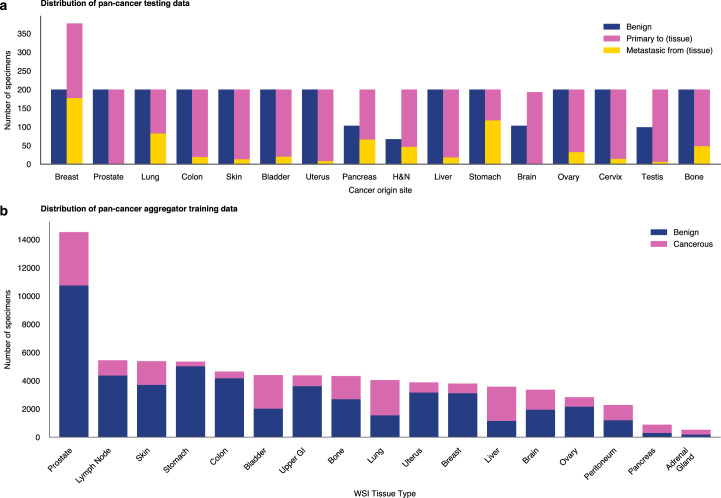
- Data: training used 1,488,550 H&E WSIs from 119,629 patients across 17 tissue groups; pan-cancer evaluation used 22,932 slides from 6,142 specimens across 16 cancer types, including internal MSKCC and external consultation cases.
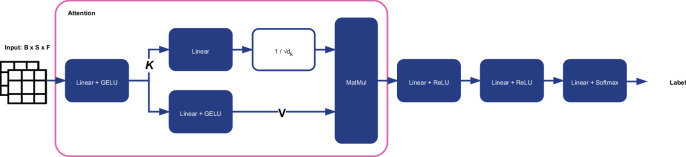
- Analysis: downstream pan-cancer and biomarker tasks used a weakly supervised Agata aggregator; tile-level tasks used linear probing. Performance was assessed mainly by AUC, specificity at 95% sensitivity, F1, DeLong’s test, Cochran’s Q/McNemar tests and Holm correction.
Limitations
- Stated: training data came from one center with limited scanner types; embeddings are tile-level at ×20 magnification (0.5 mpp), requiring an aggregation model, and slide-level models may be needed for low-data tasks such as biomarker, treatment-response or outcome prediction.
- Stated: rare-variant and biomarker comparisons lacked statistical power; thorough stratified clinical validation, hardware/deployment considerations and possible model distillation remain necessary, and data-balancing/distillation strategies were not fully explored.
- Evident from the text: the evaluation is retrospective and uses deidentified secondary data, with no prospective clinical deployment study reported.
Model-written summary. Check it against the paper before relying on it.
Integrity signals
Registry
Cites
Statistics
Figures
Verification
Claims the paper makes
62 Own result · 21 Own method · 15 Not checked yet · 14 Own interpretation · 9 No basis given · 2 Partly supported · accuracy not yet measured
The cited sources support only part of this claim — read each source’s verdict below.
In the paper
“we present Virchow, the largest foundation model for computational pathology to date.”
- Also stated in: § Main · plain
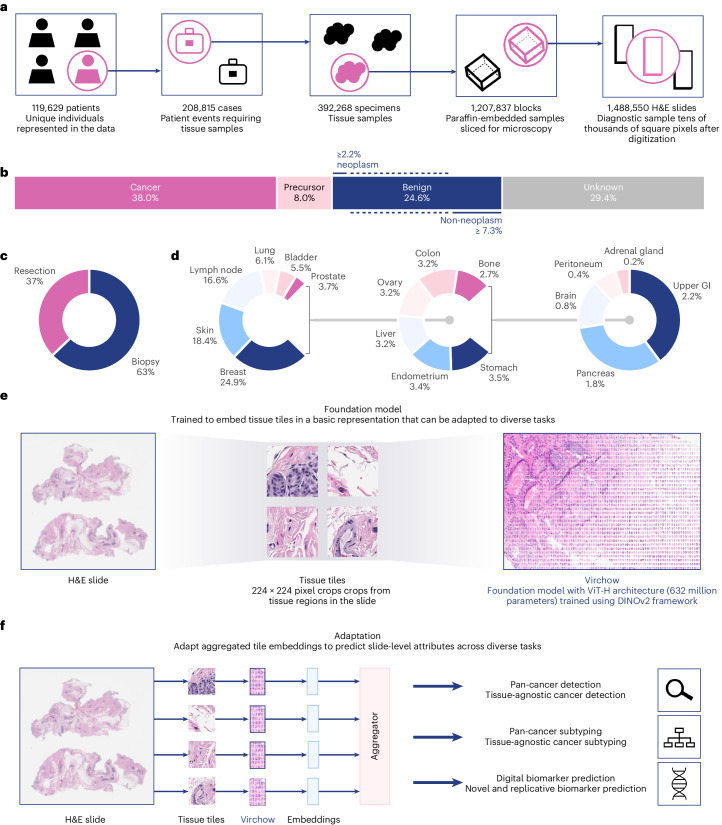
“Virchow is trained on data from approximately 100,000 patients corresponding to approximately 1.5 million H&E stained WSIs acquired from Memorial Sloan Kettering Cancer Center (MSKCC), which is 4–10× more WSIs than in prior training datasets in pathology”
§ A foundation model for clinical-grade computational pathology and rare cancers detection > Abstract
What the sources say
- Not checked yetcites [35] Wang, X. et al. Transformer-based unsupervised contrastive learning for histopathological image classification. Med. Image Anal. 81, 102559 (2022). source
- Not checked yetcites [36] Ciga, O., Xu, T. & Martel, A. L. Self supervised contrastive learning for digital histopathology. Mach. Learn. Appl. 7, 100198 (2022).
- Not checked yetcites [37] Filiot, A. et al. Scaling self-supervised learning for histopathology with masked image modeling. Preprint at https://doi.org/10.1101/2023.07.21.23292757 (2023). source
- Not checked yetcites [38] Azizi, S. et al. Robust and data-efficient generalization of self-supervised machine learning for diagnostic imaging. Nat. Biomed. Eng. 7, 1–24 (2023). source
- Not checked yetcites [39] Kang, M., Song, H., Park, S., Yoo, D. & Pereira, S. Benchmarking self-supervised learning on diverse pathology datasets. In Proc. IEEE/CVF Conference on Computer Vision and Pattern Recognition 3344–3354 (IEEE, 2023). source
- Partly supportedcites [40] Dippel, J. et al. RudolfV: A foundation model by pathologists for pathologists. Preprint at https://doi.org/10.48550/arXiv.2401.04079 (2024). sourceExperimental — accuracy not yet measured
Section 2.1 describes Virchow as trained on 1.5 million slides with 632 million parameters, larger than RudolfV on both measures. It does not establish that Virchow was the largest computational-pathology foundation model overall or specify that status ‘to date.’ (LLM, conf=0.83)
- Partly supportedcites [41] Chen, R. J. et al. Towards a general-purpose foundation model for computational pathology. Nat. Med. 30, 850–862 (2024). sourceExperimental — accuracy not yet measured
The References section identifies Virchow as a digital pathology foundation model by citing a work titled “Virchow: a million-slide digital pathology foundation model.” The cited paper does not say that Virchow is the largest foundation model for computational pathology; its Discussion addresses the scale of its own model, UNI, instead. No page numbers are available in our copy. (LLM, conf=0.83)
- Partly supportedcites [42] Campanella, G. et al. Computational pathology at health system scale–self-supervised foundation models from three billion images. Preprint at https://doi.org/10.48550/arXiv.2310.07033 (2023). sourceExperimental — accuracy not yet measured
The paper’s Abstract identifies Virchow as a ViT-huge pathology model, but does not state that it is the largest foundation model for computational pathology to date. Its separate claim about being the largest concerns the authors’ pathology dataset, not Virchow’s model size. No page number is available in our copy. (LLM, conf=0.82)
plainn = 100,000- Asserted: passes — The authors put it forward as true.
- Checkable: passes — It can be checked against evidence.
- Load-bearing: passes — The paper’s conclusions depend on it.
- Based: passes — The paper gives a reason why it holds.
- Also stated in: § Main · plain
The cited sources support only part of this claim — read each source’s verdict below.
In the paper
“Using multiple-instance learning14,49,55 with labels at the level of groups of slides has enabled clinically relevant diagnostics by scaling to training datasets on the order of 10,000 WSIs10–14.”
§ A foundation model for clinical-grade computational pathology and rare cancers detection > Discussion
What the sources say
- Partly supportedcites [14] Campanella, G. et al. Clinical-grade computational pathology using weakly supervised deep learning on whole slide images. Nat. Med. 25, 1301–1309 (2019). sourceExperimental — accuracy not yet measured
The Abstract describes using slide-level diagnoses as weak labels, and the Discussion reports clinical-grade decision support from a MIL-based approach using 44,732 slides. The Abstract lists individual datasets of 9,962, 9,894, and 24,859 slides, supporting the scale claimed. But the labels are assigned to individual slides—not to groups of slides—as the Abstract and Methods (‘MIL-based slide diagnosis’) make clear. (LLM, conf=0.85)
- Not checked yetcites [49] Casson, A. et al. Joint breast neoplasm detection and subtyping using multi-resolution network trained on large-scale H&E whole slide images with weak labels. In Proc. Medical Imaging with Deep Learning (eds Oguz, I. et al.) 18–38 (JMLR, 2024).
- Not checked yetcites [55] Ilse, M., Tomczak, J. & Welling, M. Attention-based deep multiple instance learning. In Proc. 35th International Conference on Machine Learning (eds Dy, J. & Krause, A.) 2127–2136 (JMLR, 2018).
- Partly supportedcites [10] Raciti, P. et al. Clinical validation of artificial intelligence–augmented pathology diagnosis demonstrates significant gains in diagnostic accuracy in prostate cancer detection. Arch. Path. Lab. Med. 147, 1178–1185 (2022). sourceExperimental — accuracy not yet measured
The Methods (Paige Prostate) say PaPr was trained using multiple-instance learning on 32,341 prostate-biopsy WSIs, and the paper evaluates its diagnostic performance. But the training labels were binary classifications of each WSI, not labels assigned to groups of slides. (LLM, conf=0.88)
- Partly supportedcites [11] da Silva, L. M. et al. Independent real-world application of a clinical-grade automated prostate cancer detection system. J. Pathol. 254, 147–158 (2021). sourceExperimental — accuracy not yet measured
The Materials and methods section describes Paige Prostate as using multiple-instance learning and learning from diagnoses without pixel-wise annotations. The Discussion reports high sensitivity and negative predictive value in an independent real-world prostate-biopsy dataset. Our copy does not establish the claimed training scale of approximately 10,000 WSIs; it reports results for 661 WSIs in this evaluation. (LLM, conf=0.84)
- Partly supportedcites [12] Perincheri, S. et al. An independent assessment of an artificial intelligence system for prostate cancer detection shows strong diagnostic accuracy. Mod. Pathol. 34, 1588–1595 (2021). sourceExperimental — accuracy not yet measured
The Introduction describes Paige Prostate as an algorithm trained on a digital slide archive, and the Materials and methods section reports its independent evaluation on 1,876 prostate-biopsy WSIs. This supports the clinical-diagnostic example, but our copy does not establish that it used multiple-instance learning, group-of-slides labels, or a training dataset on the order of 10,000 WSIs. (LLM, conf=0.82)
- Supportedcites [13] Raciti, P. et al. Novel artificial intelligence system increases the detection of prostate cancer in whole slide images of core needle biopsies. Mod. Pathol. 33, 2058–2066 (2020). source
The Materials & Methods section describes a weakly supervised system trained on 36,644 whole-slide images. The Results section reports that using the system increased pathologists’ average sensitivity for prostate cancer from 74% to 90%, supporting this paper as an example of clinically relevant diagnostics trained at the stated scale. No page numbers are available in our copy. (LLM, conf=0.89)
plaindirect- Asserted: passes — The authors put it forward as true.
- Checkable: passes — It can be checked against evidence.
- Load-bearing: unclear — It is unclear whether the paper’s conclusions depend on it.
- Based: passes — The paper gives a reason why it holds.
- Partly supported
A result the paper reports from its own data — it cites no other source for it, so there is none to check. The quote shows it is in the paper.
In the paper
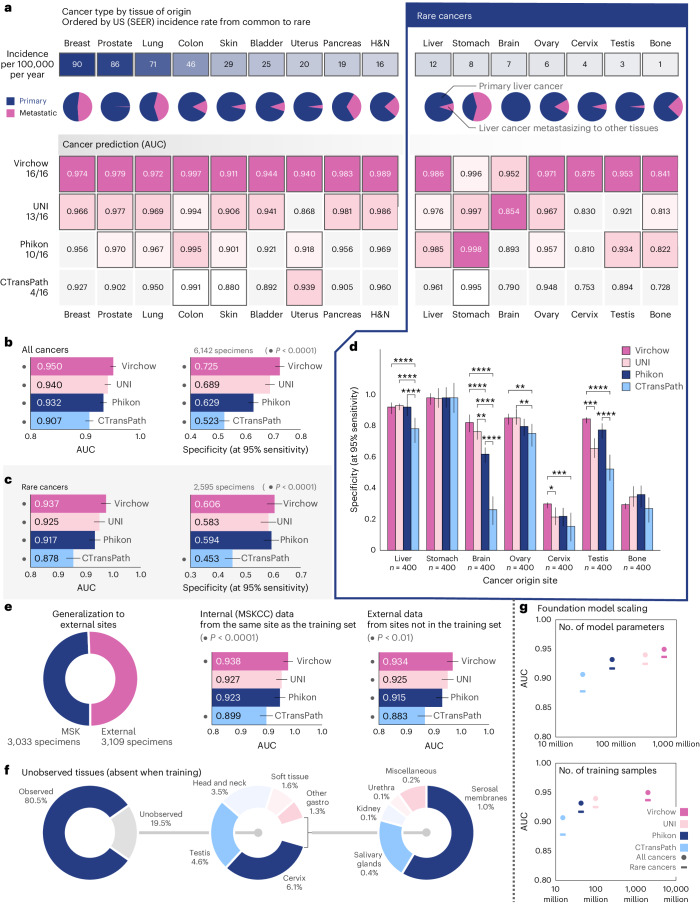
“Cancer detection was found to scale approximately logarithmically with the number of model parameters (Fig. 2g, top);”
§ A foundation model for clinical-grade computational pathology and rare cancers detection > Results > Virchow enables pan-cancer detection
plaincorrelational- Asserted: passes — The authors put it forward as true.
- Checkable: passes — It can be checked against evidence.
- Load-bearing: unclear — It is unclear whether the paper’s conclusions depend on it.
- Based: passes — The paper gives a reason why it holds.
A result the paper reports from its own data — it cites no other source for it, so there is none to check. The quote shows it is in the paper.
In the paper
“Virchow is trained on data from approximately 100,000 patients corresponding to approximately 1.5 million H&E stained WSIs acquired from Memorial Sloan Kettering Cancer Center (MSKCC)”
§ A foundation model for clinical-grade computational pathology and rare cancers detection > Main
plainn = 100,000- Asserted: passes — The authors put it forward as true.
- Checkable: passes — It can be checked against evidence.
- Load-bearing: passes — The paper’s conclusions depend on it.
- Based: passes — The paper gives a reason why it holds.
A result the paper reports from its own data — it cites no other source for it, so there is none to check. The quote shows it is in the paper.
In the paper
“Compared to the aforementioned AUC of 0.950 overall, Virchow embeddings yielded an AUC of 0.937 on rare cancers (Fig. 2c), demonstrating generalization to rare data.”
§ A foundation model for clinical-grade computational pathology and rare cancers detection > Results > Virchow enables pan-cancer detection
plain- Asserted: passes — The authors put it forward as true.
- Checkable: passes — It can be checked against evidence.
- Load-bearing: passes — The paper’s conclusions depend on it.
- Based: passes — The paper gives a reason why it holds.
A result the paper reports from its own data — it cites no other source for it, so there is none to check. The quote shows it is in the paper.
In the paper
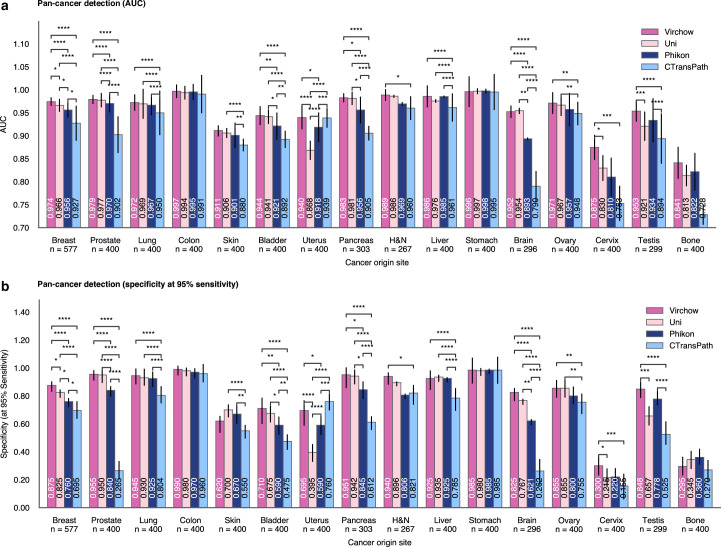
“Performance across the individual rare cancers was, however, non-uniform, with detection of cervical and bone cancers proving more challenging (AUC < 0.9) irrespective of the embeddings used (Fig. 2a,d).”
§ A foundation model for clinical-grade computational pathology and rare cancers detection > Results > Virchow enables pan-cancer detection
plain- Asserted: passes — The authors put it forward as true.
- Checkable: passes — It can be checked against evidence.
- Load-bearing: unclear — It is unclear whether the paper’s conclusions depend on it.
- Based: passes — The paper gives a reason why it holds.
A result the paper reports from its own data — it cites no other source for it, so there is none to check. The quote shows it is in the paper.
In the paper
“Virchow embeddings improved cervix detection to 0.875 AUC compared with 0.830, 0.810 or 0.753 when using UNI, Phikon or CTransPath embeddings, respectively.”
§ A foundation model for clinical-grade computational pathology and rare cancers detection > Results > Virchow enables pan-cancer detection
plaindirect- Asserted: passes — The authors put it forward as true.
- Checkable: passes — It can be checked against evidence.
- Load-bearing: passes — The paper’s conclusions depend on it.
- Based: passes — The paper gives a reason why it holds.
A result the paper reports from its own data — it cites no other source for it, so there is none to check. The quote shows it is in the paper.
In the paper
“At 95% sensitivity, we show that a pan-cancer detection model using Virchow embeddings can achieve 72.5% specificity, compared to 68.9%, 62.9% or 52.3% using UNI, Phikon or CTransPath embeddings, respectively, trained on less data (Fig. 2b).”
§ A foundation model for clinical-grade computational pathology and rare cancers detection > Results > Virchow enables pan-cancer detection
plaincorrelational- Asserted: passes — The authors put it forward as true.
- Checkable: passes — It can be checked against evidence.
- Load-bearing: passes — The paper’s conclusions depend on it.
- Based: passes — The paper gives a reason why it holds.
A result the paper reports from its own data — it cites no other source for it, so there is none to check. The quote shows it is in the paper.
In the paper
“Similarly, Virchow embeddings yielded 0.841 AUC for bone cancer detection, compared to 0.813, 0.822 and 0.728 with UNI, Phikon and CTransPath, respectively.”
§ A foundation model for clinical-grade computational pathology and rare cancers detection > Results > Virchow enables pan-cancer detection
plaincorrelational- Asserted: passes — The authors put it forward as true.
- Checkable: passes — It can be checked against evidence.
- Load-bearing: passes — The paper’s conclusions depend on it.
- Based: passes — The paper gives a reason why it holds.
A result the paper reports from its own data — it cites no other source for it, so there is none to check. The quote shows it is in the paper.
In the paper
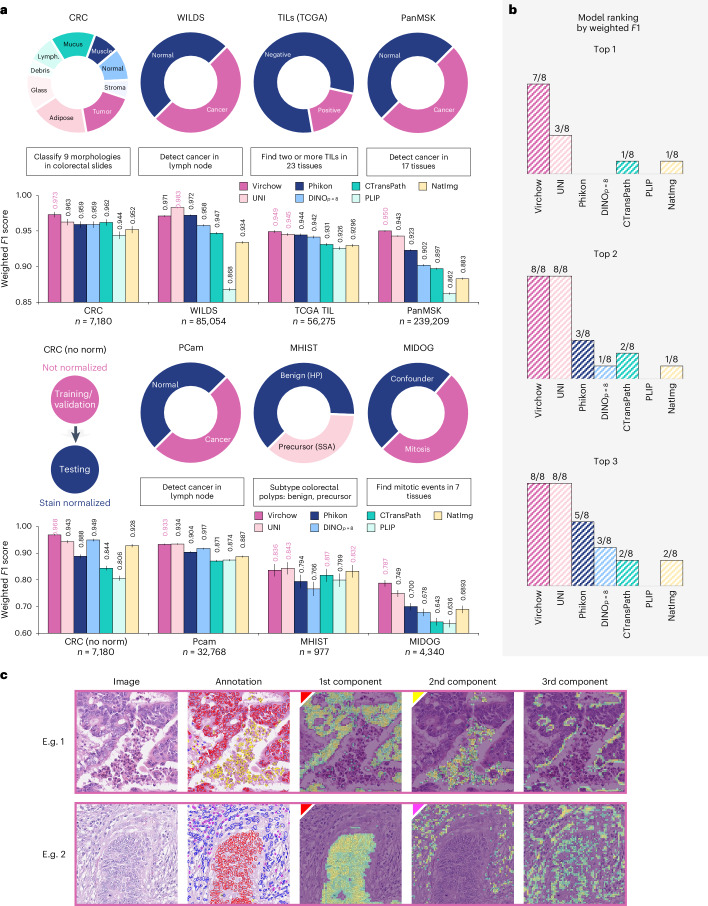
“Without normalization, Virchow’s performance declines by only −0.005 in weighted F1 score, indicating robustness to variations in data preprocessing.”
§ A foundation model for clinical-grade computational pathology and rare cancers detection > Results > Tile-level benchmarks and qualitative analysis demonstrate generalizability
plaindirect- Asserted: passes — The authors put it forward as true.
- Checkable: passes — It can be checked against evidence.
- Load-bearing: passes — The paper’s conclusions depend on it.
- Based: passes — The paper gives a reason why it holds.
- It may state two separate claims as one. 42
- Probably not a substantial claim. 27
- The quote only partly states this claim. 2
In the paper
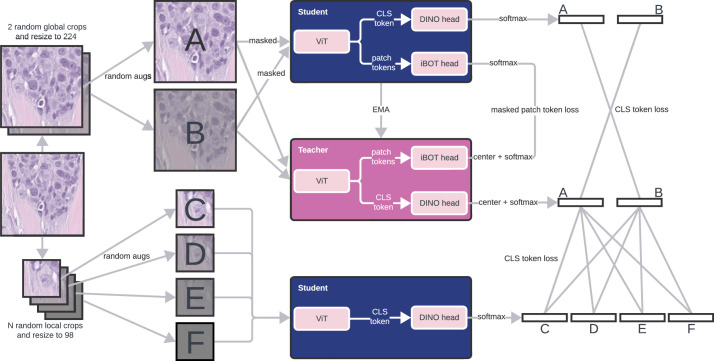
“Virchow, a 632 million parameter ViT model, is trained using the DINO v.2 algorithm33, a multiview student–teacher self-supervised algorithm”
§ A foundation model for clinical-grade computational pathology and rare cancers detection > Main
What the sources say
- Not checked yetcites [33] Oquab, M. et al. DINOv2: Learning Robust Visual Features without Supervision. In Transactions on Machine Learning Research 2835–8856 (TMLR, 2024).
plain- Asserted: passes — The authors put it forward as true.
- Checkable: passes — It can be checked against evidence.
- Load-bearing: unclear — It is unclear whether the paper’s conclusions depend on it.
- Based: passes — The paper gives a reason why it holds.
It may state two separate claims as one.
A result the paper reports from its own data — it cites no other source for it, so there is none to check. The quote shows it is in the paper.
In the paper
“Overall the pan-cancer model achieved an AUC of 0.950 with Virchow embeddings, 0.940 with UNI embeddings, 0.932 with Phikon embeddings and 0.907 with CTransPath embeddings (Fig. 2b; all significantly different with P < 0.0001).”
§ A foundation model for clinical-grade computational pathology and rare cancers detection > Results > Virchow enables pan-cancer detection
plaincorrelational- Asserted: passes — The authors put it forward as true.
- Checkable: passes — It can be checked against evidence.
- Load-bearing: passes — The paper’s conclusions depend on it.
- Based: passes — The paper gives a reason why it holds.
It may state two separate claims as one.
A result the paper reports from its own data — it cites no other source for it, so there is none to check. The quote shows it is in the paper.
In the paper
“Virchow embeddings outperform or match all baseline models on all tested cancer types, notably including rare cancers and out-of-distribution (OOD) data.”
- Also stated in: § Virchow enables pan-cancer detection · plain
“Virchow embeddings yielded the best cancer detection performance on all cancer types (Fig. 2a).”
- Also stated in: § Virchow enables pan-cancer detection · plain
“Virchow embeddings enable the best cancer detection performance across all cancer types, including rare cancers.”
§ A foundation model for clinical-grade computational pathology and rare cancers detection > Main
plaincorrelational- Asserted: passes — The authors put it forward as true.
- Checkable: passes — It can be checked against evidence.
- Load-bearing: passes — The paper’s conclusions depend on it.
- Based: passes — The paper gives a reason why it holds.
It may state two separate claims as one.
- Also stated in: § Virchow enables pan-cancer detection · plain
The paper states this without a source or data behind it here, so there is nothing to check it against. The quote shows it is in the paper.
In the paper
“Although AUC cannot be exactly compared across data subsets, we can observe that all models achieve a similar AUC on both internal and external data, suggesting that they generalize well as external data can be challenging because it is submitted to MSKCC for consultation.”
§ A foundation model for clinical-grade computational pathology and rare cancers detection > Results > Virchow enables pan-cancer detection
hedged- Asserted: passes — The authors put it forward as true.
- Checkable: passes — It can be checked against evidence.
- Load-bearing: passes — The paper’s conclusions depend on it.
- Based: passes — The paper gives a reason why it holds.
It may state two separate claims as one.
A result the paper reports from its own data — it cites no other source for it, so there is none to check. The quote shows it is in the paper.
In the paper
“although performance scaled with the number of training tile samples, the trend (Fig. 2g, bottom) suggests diminishing returns.”
§ A foundation model for clinical-grade computational pathology and rare cancers detection > Results > Virchow enables pan-cancer detection
hedgedcorrelational- Asserted: passes — The authors put it forward as true.
- Checkable: passes — It can be checked against evidence.
- Load-bearing: unclear — It is unclear whether the paper’s conclusions depend on it.
- Based: passes — The paper gives a reason why it holds.
It may state two separate claims as one.
A result the paper reports from its own data — it cites no other source for it, so there is none to check. The quote shows it is in the paper.
In the paper
“The training data are composed of cancerous and benign tissues, collected via biopsy (63%) and resection (37%), from 17 high-level tissues (Fig. 1b–d).”
§ A foundation model for clinical-grade computational pathology and rare cancers detection > Main
plainn = 100,000- Asserted: passes — The authors put it forward as true.
- Checkable: passes — It can be checked against evidence.
- Load-bearing: unclear — It is unclear whether the paper’s conclusions depend on it.
- Based: passes — The paper gives a reason why it holds.
It may state two separate claims as one.
A result the paper reports from its own data — it cites no other source for it, so there is none to check. The quote shows it is in the paper.
In the paper
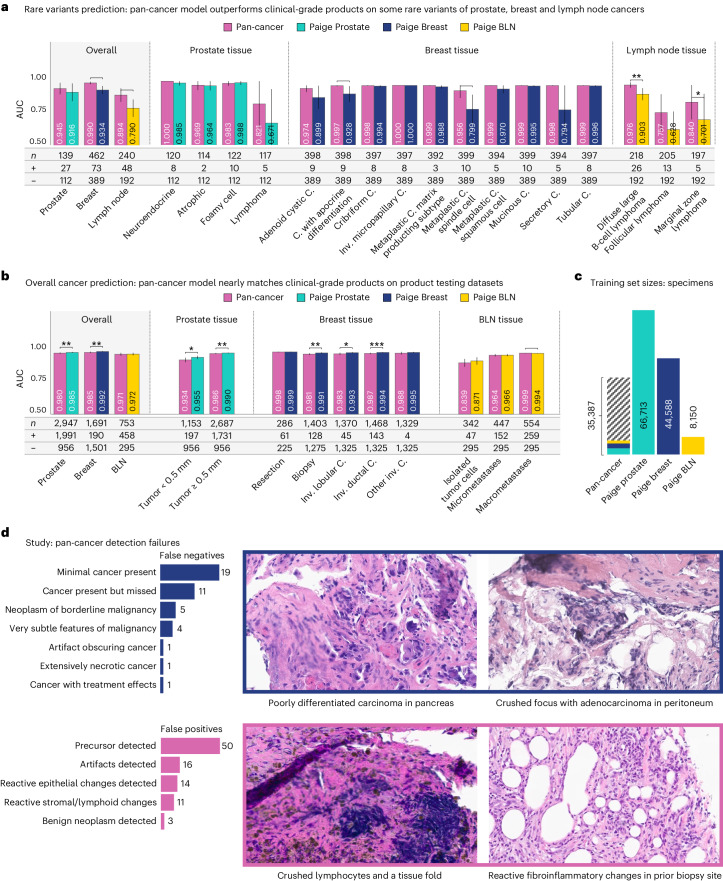
“The Virchow-based pan-cancer detection model, trained on cancers across numerous tissues, performs nearly as well as the prostate, breast and BLN clinical specialist models (Fig. 3c) while outperforming them on many rare variants of cancers (Fig. 3d).”
- Also stated in: § Toward clinical-grade performance · plain
“In addition to approaching the specialist models in terms of overall AUCs, the pan-cancer model matches or outperforms these models on rare variants of cancers, as shown in Fig. 3d.”
§ A foundation model for clinical-grade computational pathology and rare cancers detection > Results > Toward clinical-grade performance
plaincorrelational- Asserted: passes — The authors put it forward as true.
- Checkable: passes — It can be checked against evidence.
- Load-bearing: passes — The paper’s conclusions depend on it.
- Based: passes — The paper gives a reason why it holds.
It may state two separate claims as one.
- Also stated in: § Toward clinical-grade performance · plain
A result the paper reports from its own data — it cites no other source for it, so there is none to check. The quote shows it is in the paper.
In the paper
“Pan-cancer detection using UNI embeddings achieved statistically similar performance (P < 0.05) for eight of the nine common cancer types and five of the seven rare cancer types; nevertheless, in all but one case, the specific area under (the receiver operating characteristic) curve (AUC) score was lower.”
§ A foundation model for clinical-grade computational pathology and rare cancers detection > Results > Virchow enables pan-cancer detection
plain- Asserted: passes — The authors put it forward as true.
- Checkable: passes — It can be checked against evidence.
- Load-bearing: passes — The paper’s conclusions depend on it.
- Based: passes — The paper gives a reason why it holds.
It may state two separate claims as one.
A result the paper reports from its own data — it cites no other source for it, so there is none to check. The quote shows it is in the paper.
In the paper
“Furthermore, cervix, testis and head and neck (H&N) are tissues not seen during training, and Virchow embeddings still outperform competing models.”
§ A foundation model for clinical-grade computational pathology and rare cancers detection > Results > Virchow enables pan-cancer detection
plaincorrelational- Asserted: passes — The authors put it forward as true.
- Checkable: passes — It can be checked against evidence.
- Load-bearing: passes — The paper’s conclusions depend on it.
- Based: passes — The paper gives a reason why it holds.
It may state two separate claims as one.
A result the paper reports from its own data — it cites no other source for it, so there is none to check. The quote shows it is in the paper.
In the paper
“The comparison of pan-cancer performance based on different foundation model embeddings reveals that performance scales with the size of the foundation model and the size of the training data (Fig. 2g).”
§ A foundation model for clinical-grade computational pathology and rare cancers detection > Results > Virchow enables pan-cancer detection
plaincorrelational- Asserted: passes — The authors put it forward as true.
- Checkable: passes — It can be checked against evidence.
- Load-bearing: passes — The paper’s conclusions depend on it.
- Based: passes — The paper gives a reason why it holds.
It may state two separate claims as one.
A result the paper reports from its own data — it cites no other source for it, so there is none to check. The quote shows it is in the paper.
In the paper
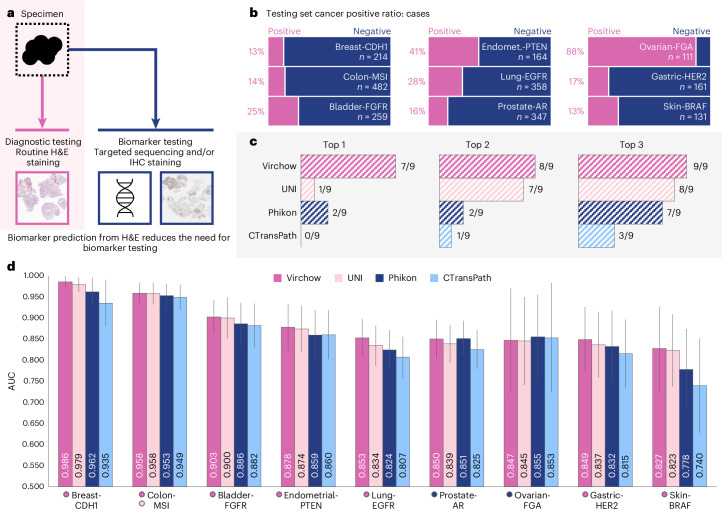
“In our comparative analysis shown in Fig. 4c, Virchow embeddings demonstrated superior performance in seven of the nine evaluated digital biomarkers, achieving AUC scores that exceeded those of the nearest baseline foundation models.”
§ A foundation model for clinical-grade computational pathology and rare cancers detection > Results > Biomarker detection in routine imaging obviates additional testing
boostedcorrelational- Asserted: passes — The authors put it forward as true.
- Checkable: passes — It can be checked against evidence.
- Load-bearing: passes — The paper’s conclusions depend on it.
- Based: passes — The paper gives a reason why it holds.
It may state two separate claims as one.
A result the paper reports from its own data — it cites no other source for it, so there is none to check. The quote shows it is in the paper.
In the paper
“Concretely, Paige Prostate was trained on 66,713 blocks, Paige Breast was trained on 44,588 specimens and BLN on 8150 specimens, whereas pan-cancer (using Virchow embeddings) was trained on only 35,387 groups of slides (blocks or specimens) in total, of which 2,829 are prostate, 1,626 are breast and 1,441 are lymph node.”
§ A foundation model for clinical-grade computational pathology and rare cancers detection > Results > Toward clinical-grade performance
plain- Asserted: passes — The authors put it forward as true.
- Checkable: passes — It can be checked against evidence.
- Load-bearing: passes — The paper’s conclusions depend on it.
- Based: passes — The paper gives a reason why it holds.
It may state two separate claims as one.
A result the paper reports from its own data — it cites no other source for it, so there is none to check. The quote shows it is in the paper.
In the paper
“The pan-cancer model achieves an AUC of 0.980, 0.985 and 0.971 on prostate, breast and BLN, respectively.”
§ A foundation model for clinical-grade computational pathology and rare cancers detection > Results > Toward clinical-grade performance
plain- Asserted: passes — The authors put it forward as true.
- Checkable: passes — It can be checked against evidence.
- Load-bearing: passes — The paper’s conclusions depend on it.
- Based: passes — The paper gives a reason why it holds.
It may state two separate claims as one.
The paper states this without a source or data behind it here, so there is nothing to check it against. The quote shows it is in the paper.
In the paper
“This result is even more impressive when noting that the training dataset of the pan-cancer model, as a proof of concept, lacks the quality control and subpopulation enrichment of data and labels that are typically done for commercially available AI models.”
§ A foundation model for clinical-grade computational pathology and rare cancers detection > Discussion
plain- Asserted: passes — The authors put it forward as true.
- Checkable: passes — It can be checked against evidence.
- Load-bearing: passes — The paper’s conclusions depend on it.
- Based: passes — The paper gives a reason why it holds.
Probably not a substantial claim.
A result the paper reports from its own data — it cites no other source for it, so there is none to check. The quote shows it is in the paper.
In the paper
“Furthermore, there is no statistically significant difference (P < 0.05) in the other BLN comparisons or some of the stratified breast cancer comparisons (Fig. 3c).”
§ A foundation model for clinical-grade computational pathology and rare cancers detection > Results > Toward clinical-grade performance
plain- Asserted: passes — The authors put it forward as true.
- Checkable: passes — It can be checked against evidence.
- Load-bearing: unclear — It is unclear whether the paper’s conclusions depend on it.
- Based: passes — The paper gives a reason why it holds.
It may state two separate claims as one.
A result the paper reports from its own data — it cites no other source for it, so there is none to check. The quote shows it is in the paper.
In the paper
“The closest competing models are UNI and Phikon, with UNI scoring in the top 1 three times and in the top 2 for all tasks and Phikon scoring in among the top 2 three times.”
§ A foundation model for clinical-grade computational pathology and rare cancers detection > Results > Tile-level benchmarks and qualitative analysis demonstrate generalizability
plain- Asserted: passes — The authors put it forward as true.
- Checkable: passes — It can be checked against evidence.
- Load-bearing: passes — The paper’s conclusions depend on it.
- Based: passes — The paper gives a reason why it holds.
It may state two separate claims as one.
A result the paper reports from its own data — it cites no other source for it, so there is none to check. The quote shows it is in the paper.
In the paper
“The improvement in performance with respect to model size appears to still be in an approximately log-linear range; however, sub-log-linear trends were observed as a function of training data.”
§ A foundation model for clinical-grade computational pathology and rare cancers detection > Discussion
hedgedcorrelational- Asserted: passes — The authors put it forward as true.
- Checkable: passes — It can be checked against evidence.
- Load-bearing: passes — The paper’s conclusions depend on it.
- Based: passes — The paper gives a reason why it holds.
It may state two separate claims as one.
A result the paper reports from its own data — it cites no other source for it, so there is none to check. The quote shows it is in the paper.
In the paper
“Most detected precursors exhibited high-grade dysplasia, with cytologic features resembling those of invasive carcinoma, although some foci of low-grade dysplasia were also detected in the gastroesophageal junction and skin.”
§ A foundation model for clinical-grade computational pathology and rare cancers detection > Results > Toward clinical-grade performance
plain- Asserted: passes — The authors put it forward as true.
- Checkable: passes — It can be checked against evidence.
- Load-bearing: unclear — It is unclear whether the paper’s conclusions depend on it.
- Based: passes — The paper gives a reason why it holds.
It may state two separate claims as one.
A result the paper reports from its own data — it cites no other source for it, so there is none to check. The quote shows it is in the paper.
In the paper
“In both examples, the first principal component highlighted malignant epithelium (red) cells. The second principal component, respectively, highlighted miscellaneous cells (yellow) and inflammatory (magenta) cells.”
§ A foundation model for clinical-grade computational pathology and rare cancers detection > Results > Tile-level benchmarks and qualitative analysis demonstrate generalizability
plaincorrelational- Asserted: passes — The authors put it forward as true.
- Checkable: passes — It can be checked against evidence.
- Load-bearing: passes — The paper’s conclusions depend on it.
- Based: passes — The paper gives a reason why it holds.
It may state two separate claims as one.
A result the paper reports from its own data — it cites no other source for it, so there is none to check. The quote shows it is in the paper.
In the paper
“This performance approaches that of commercial models; however, it is still surpassed by the Food and Drug Administration-approved Paige Prostate model (0.980 versus 0.995 AUC, P < 0.05) and the Paige Breast model (0.985 versus 0.992 AUC, P < 0.01).”
§ A foundation model for clinical-grade computational pathology and rare cancers detection > Results > Toward clinical-grade performance
plain- Asserted: passes — The authors put it forward as true.
- Checkable: passes — It can be checked against evidence.
- Load-bearing: passes — The paper’s conclusions depend on it.
- Based: passes — The paper gives a reason why it holds.
It may state two separate claims as one.
A result the paper reports from its own data — it cites no other source for it, so there is none to check. The quote shows it is in the paper.
In the paper
“In 11 cases (26.2%), there was more than minimal cancer within the specimen, and the negative result of the model could not be explained.”
§ A foundation model for clinical-grade computational pathology and rare cancers detection > Results > Toward clinical-grade performance
plainn = 11- Asserted: passes — The authors put it forward as true.
- Checkable: passes — It can be checked against evidence.
- Load-bearing: unclear — It is unclear whether the paper’s conclusions depend on it.
- Based: passes — The paper gives a reason why it holds.
It may state two separate claims as one.
A result the paper reports from its own data — it cites no other source for it, so there is none to check. The quote shows it is in the paper.
In the paper
“In breast tissue, the pan-cancer model outperforms the Paige Breast model overall and especially on some rare histological variants, including adenoid cystic carcinoma, carcinoma with apocrine differentiation (P < 0.05), metaplastic carcinoma spindle cell (P < 0.01), metaplastic carcinoma squamous cell and the exceptionally unusual secretory carcinoma.”
§ A foundation model for clinical-grade computational pathology and rare cancers detection > Results > Toward clinical-grade performance
plaincorrelational- Asserted: passes — The authors put it forward as true.
- Checkable: passes — It can be checked against evidence.
- Load-bearing: passes — The paper’s conclusions depend on it.
- Based: passes — The paper gives a reason why it holds.
It may state two separate claims as one.
A result the paper reports from its own data — it cites no other source for it, so there is none to check. The quote shows it is in the paper.
In the paper
“From the total of 1,038 samples (1,087 WSIs), 26.2% have FGFR3 alterations.”
§ A foundation model for clinical-grade computational pathology and rare cancers detection > Methods > Biomarker detection
plainn = 1,038- Asserted: passes — The authors put it forward as true.
- Checkable: passes — It can be checked against evidence.
- Load-bearing: fails — The paper’s conclusions may not depend on it.
- Based: passes — The paper gives a reason why it holds.
Probably not a substantial claim. The paper’s conclusions may not depend on it.
The paper states this without a source or data behind it here, so there is nothing to check it against. The quote shows it is in the paper.
In the paper
“The Colon-MSI dataset, comprising 2,698 CRC samples with 288 MSI-H/dMMR positive cases, uses both IHC and MSK-IMPACT sequencing for dMMR and MSI-H detection, prioritizing IHC results when both test outcomes are available.”
§ A foundation model for clinical-grade computational pathology and rare cancers detection > Methods > Biomarker detection
plainn = 2,698- Asserted: passes — The authors put it forward as true.
- Checkable: passes — It can be checked against evidence.
- Load-bearing: unclear — It is unclear whether the paper’s conclusions depend on it.
- Based: passes — The paper gives a reason why it holds.
It may state two separate claims as one.
A result the paper reports from its own data — it cites no other source for it, so there is none to check. The quote shows it is in the paper.
In the paper
“This dataset contains 23 cases of invasive ductal carcinoma or invasive lobular carcinoma (as control), 75 cases of rare variants”
§ A foundation model for clinical-grade computational pathology and rare cancers detection > Methods > Clinical evaluation datasets
plainn = 75- Asserted: passes — The authors put it forward as true.
- Checkable: passes — It can be checked against evidence.
- Load-bearing: passes — The paper’s conclusions depend on it.
- Based: passes — The paper gives a reason why it holds.
It may state two separate claims as one. The quote only partly states this claim.
The paper states this without a source or data behind it here, so there is nothing to check it against. The quote shows it is in the paper.
In the paper
“Based on this definition, common cancer comprises 14,179 slides from 3,547 specimens originating in breast, prostate, lung, colon, skin, bladder, uterus, pancreas and H&N, and rare cancer comprises 8,753 slides from 2,595 specimens originating in liver, stomach, brain, ovary, cervix, testis and bone.”
§ A foundation model for clinical-grade computational pathology and rare cancers detection > Methods > Pan-cancer detection
plainn = 3,547- Asserted: passes — The authors put it forward as true.
- Checkable: passes — It can be checked against evidence.
- Load-bearing: passes — The paper’s conclusions depend on it.
- Based: passes — The paper gives a reason why it holds.
It may state two separate claims as one.
A result the paper reports from its own data — it cites no other source for it, so there is none to check. The quote shows it is in the paper.
In the paper
“This dataset contains 190 slides with invasive cancer and 1,501 benign slides, labeled individually by a pathologist according to presence of atypical ductal hyperplasia, atypical lobular hyperplasia, lobular carcinoma in situ, ductal carcinoma in situ, invasive ductal carcinoma, invasive lobular carcinoma and/or other subtypes”
§ A foundation model for clinical-grade computational pathology and rare cancers detection > Methods > Clinical evaluation datasets
plain- Asserted: passes — The authors put it forward as true.
- Checkable: passes — It can be checked against evidence.
- Load-bearing: passes — The paper’s conclusions depend on it.
- Based: passes — The paper gives a reason why it holds.
It may state two separate claims as one.
A result the paper reports from its own data — it cites no other source for it, so there is none to check. The quote shows it is in the paper.
In the paper
“The CDH1 dataset comprises a total of 1,077 estrogen receptor-positive (ER+) primary breast cancer samples, in which 139 were positive and 918 were negative. The remaining 20 samples with other types of variants—that is, monoallelic mutations—were excluded.”
§ A foundation model for clinical-grade computational pathology and rare cancers detection > Methods > Biomarker detection
plain- Asserted: passes — The authors put it forward as true.
- Checkable: passes — It can be checked against evidence.
- Load-bearing: unclear — It is unclear whether the paper’s conclusions depend on it.
- Based: passes — The paper gives a reason why it holds.
It may state two separate claims as one.
A result the paper reports from its own data — it cites no other source for it, so there is none to check. The quote shows it is in the paper.
In the paper
“The testing dataset includes 15,622 slides from 3,033 specimens collected at MSKCC (denoted as ‘Internal’ in Fig. 2b), in addition to 7,310 slides (3109 specimens) sent to MSKCC from institutions around the world (‘External’ in Fig. 2b).”
§ A foundation model for clinical-grade computational pathology and rare cancers detection > Methods > Pan-cancer detection
plainn = 3,033- Asserted: passes — The authors put it forward as true.
- Checkable: passes — It can be checked against evidence.
- Load-bearing: passes — The paper’s conclusions depend on it.
- Based: passes — The paper gives a reason why it holds.
It may state two separate claims as one.
In the paper
“Virchow marks a major increase in training data scale to 1.5 million WSIs—a volume of data that is over 3,000 times the size of ImageNet31 as measured by the total number of pixels.”
§ A foundation model for clinical-grade computational pathology and rare cancers detection > Discussion
What the sources say
- Not checked yetcites [31] Deng, J. et al. Imagenet: a large-scale hierarchical image database. In Proc. IEEE Conference on Computer Vision and Pattern Recognition 248–255 (IEEE, 2009). source
plaindirect- Asserted: passes — The authors put it forward as true.
- Checkable: passes — It can be checked against evidence.
- Load-bearing: passes — The paper’s conclusions depend on it.
- Based: passes — The paper gives a reason why it holds.
It may state two separate claims as one.
A conclusion the paper draws from its own results — it cites no other source for it, so there is none to check. The quote shows it is in the paper.
In the paper
“Overall, pan-cancer detection generalizes across cancer types, including rare cancers, as well as on OOD data when using foundation model embeddings.”
§ A foundation model for clinical-grade computational pathology and rare cancers detection > Results > Virchow enables pan-cancer detection
plaincorrelational- Asserted: passes — The authors put it forward as true.
- Checkable: passes — It can be checked against evidence.
- Load-bearing: passes — The paper’s conclusions depend on it.
- Based: passes — The paper gives a reason why it holds.
It may state two separate claims as one.
A conclusion the paper draws from its own results — it cites no other source for it, so there is none to check. The quote shows it is in the paper.
In the paper
“This demonstrates that Virchow embeddings generalize well to new or rare data and outperform the others consistently.”
§ A foundation model for clinical-grade computational pathology and rare cancers detection > Results > Virchow enables pan-cancer detection
boostedcorrelational- Asserted: passes — The authors put it forward as true.
- Checkable: passes — It can be checked against evidence.
- Load-bearing: passes — The paper’s conclusions depend on it.
- Based: passes — The paper gives a reason why it holds.
It may state two separate claims as one.
None of the sources cited for this claim have been checked yet.
In the paper
“although we posit that increased diversity helps to learn robust and rare features. Indeed, it has been shown that training a model on multiple tissues or cancer variants can improve detection performance for each cancer53, as many morphological features are observed across cancers from different topographies54.”
§ A foundation model for clinical-grade computational pathology and rare cancers detection > Discussion
What the sources say
- Not checked yetcites [53] Cheerla, A. & Gevaert, O. Deep learning with multimodal representation for pancancer prognosis prediction. Bioinformatics 35, i446–i454 (2019). source
- Not checked yetcites [54] Noorbakhsh, J. et al. Deep learning-based cross-classifications reveal conserved spatial behaviors within tumor histological images. Nat. Commun. 11, 6367 (2020). source
hedgedconditional- Asserted: passes — The authors put it forward as true.
- Checkable: passes — It can be checked against evidence.
- Load-bearing: fails — The paper’s conclusions may not depend on it.
- Based: passes — The paper gives a reason why it holds.
Probably not a substantial claim. The paper’s conclusions may not depend on it.
What the paper did — it cites no source for this, so there is none to check. The quote shows it is in the paper.
In the paper
“Finally, we note that Virchow embeddings were not fine-tuned, and models used simple aggregator architectures to make predictions.”
§ A foundation model for clinical-grade computational pathology and rare cancers detection > Discussion
plain- Asserted: passes — The authors put it forward as true.
- Checkable: passes — It can be checked against evidence.
- Load-bearing: passes — The paper’s conclusions depend on it.
- Based: passes — The paper gives a reason why it holds.
It may state two separate claims as one.
What the paper did — it cites no source for this, so there is none to check. The quote shows it is in the paper.
In the paper
“We note that the biomarker prediction results lacked sufficient statistical power to assess statistically significant differences across models; instead, we conclude relative model performance from evaluating many different biomarker predictions.”
§ A foundation model for clinical-grade computational pathology and rare cancers detection > Results > Biomarker detection in routine imaging obviates additional testing
plain- Asserted: passes — The authors put it forward as true.
- Checkable: passes — It can be checked against evidence.
- Load-bearing: passes — The paper’s conclusions depend on it.
- Based: passes — The paper gives a reason why it holds.
It may state two separate claims as one.
None of the sources cited for this claim have been checked yet.
In the paper
“Despite the challenges in collecting large-scale datasets in the pathology domain, recent pioneering works have utilized datasets ranging from 30,000 to 400,000 WSIs to train foundation models ranging in size from 28 million to 307 million parameters35–42”
§ A foundation model for clinical-grade computational pathology and rare cancers detection > Main
What the sources say
- Not checked yetcites [35] Wang, X. et al. Transformer-based unsupervised contrastive learning for histopathological image classification. Med. Image Anal. 81, 102559 (2022). source
- Not checked yetcites [36] Ciga, O., Xu, T. & Martel, A. L. Self supervised contrastive learning for digital histopathology. Mach. Learn. Appl. 7, 100198 (2022).
- Not checked yetcites [37] Filiot, A. et al. Scaling self-supervised learning for histopathology with masked image modeling. Preprint at https://doi.org/10.1101/2023.07.21.23292757 (2023). source
- Not checked yetcites [38] Azizi, S. et al. Robust and data-efficient generalization of self-supervised machine learning for diagnostic imaging. Nat. Biomed. Eng. 7, 1–24 (2023). source
- Not checked yetcites [39] Kang, M., Song, H., Park, S., Yoo, D. & Pereira, S. Benchmarking self-supervised learning on diverse pathology datasets. In Proc. IEEE/CVF Conference on Computer Vision and Pattern Recognition 3344–3354 (IEEE, 2023). source
- Not checked yetcites [40] Dippel, J. et al. RudolfV: A foundation model by pathologists for pathologists. Preprint at https://doi.org/10.48550/arXiv.2401.04079 (2024). source
- Not checked yetcites [41] Chen, R. J. et al. Towards a general-purpose foundation model for computational pathology. Nat. Med. 30, 850–862 (2024). source
- Not checked yetcites [42] Campanella, G. et al. Computational pathology at health system scale–self-supervised foundation models from three billion images. Preprint at https://doi.org/10.48550/arXiv.2310.07033 (2023). source
plaincorrelational- Asserted: passes — The authors put it forward as true.
- Checkable: passes — It can be checked against evidence.
- Load-bearing: fails — The paper’s conclusions may not depend on it.
- Based: passes — The paper gives a reason why it holds.
Probably not a substantial claim. The paper’s conclusions may not depend on it.
A conclusion the paper draws from its own results — it cites no other source for it, so there is none to check. The quote shows it is in the paper.
In the paper
“Indeed, Virchow unlocks the ability to accurately and precisely detect unusual histological variants of cancer as well as biomarker status, something that is difficult to achieve with cancer- or biomarker-specific training due to the limited amount of associated training data.”
§ A foundation model for clinical-grade computational pathology and rare cancers detection > Discussion
plaindirect- Asserted: passes — The authors put it forward as true.
- Checkable: passes — It can be checked against evidence.
- Load-bearing: passes — The paper’s conclusions depend on it.
- Based: passes — The paper gives a reason why it holds.
It may state two separate claims as one.
A conclusion the paper draws from its own results — it cites no other source for it, so there is none to check. The quote shows it is in the paper.
In the paper
“Trends in training data size may be oversimplified as they do not capture the tradeoff between increasing the number of WSIs versus tiles.”
§ A foundation model for clinical-grade computational pathology and rare cancers detection > Discussion
hedged- Asserted: passes — The authors put it forward as true.
- Checkable: passes — It can be checked against evidence.
- Load-bearing: fails — The paper’s conclusions may not depend on it.
- Based: passes — The paper gives a reason why it holds.
Probably not a substantial claim. The paper’s conclusions may not depend on it.
None of the sources cited for this claim have been checked yet.
In the paper
“These works demonstrate that image features produced with self-supervised learning of pathology images outperform image features trained on natural images and that performance improves with scale.”
§ A foundation model for clinical-grade computational pathology and rare cancers detection > Main
What the sources say
- Not checked yetcites [35] Wang, X. et al. Transformer-based unsupervised contrastive learning for histopathological image classification. Med. Image Anal. 81, 102559 (2022). source
- Not checked yetcites [36] Ciga, O., Xu, T. & Martel, A. L. Self supervised contrastive learning for digital histopathology. Mach. Learn. Appl. 7, 100198 (2022).
- Not checked yetcites [37] Filiot, A. et al. Scaling self-supervised learning for histopathology with masked image modeling. Preprint at https://doi.org/10.1101/2023.07.21.23292757 (2023). source
- Not checked yetcites [38] Azizi, S. et al. Robust and data-efficient generalization of self-supervised machine learning for diagnostic imaging. Nat. Biomed. Eng. 7, 1–24 (2023). source
- Not checked yetcites [39] Kang, M., Song, H., Park, S., Yoo, D. & Pereira, S. Benchmarking self-supervised learning on diverse pathology datasets. In Proc. IEEE/CVF Conference on Computer Vision and Pattern Recognition 3344–3354 (IEEE, 2023). source
- Not checked yetcites [40] Dippel, J. et al. RudolfV: A foundation model by pathologists for pathologists. Preprint at https://doi.org/10.48550/arXiv.2401.04079 (2024). source
- Not checked yetcites [41] Chen, R. J. et al. Towards a general-purpose foundation model for computational pathology. Nat. Med. 30, 850–862 (2024). source
- Not checked yetcites [42] Campanella, G. et al. Computational pathology at health system scale–self-supervised foundation models from three billion images. Preprint at https://doi.org/10.48550/arXiv.2310.07033 (2023). source
boosteddirect- Asserted: passes — The authors put it forward as true.
- Checkable: passes — It can be checked against evidence.
- Load-bearing: passes — The paper’s conclusions depend on it.
- Based: passes — The paper gives a reason why it holds.
It may state two separate claims as one.
A conclusion the paper draws from its own results — it cites no other source for it, so there is none to check. The quote shows it is in the paper.
In the paper
“These findings underscore the potential of Virchow embeddings to accurately represent H&E histologic phenotypes, offering predictive insights into biomarkers that are traditionally identified through DNA extraction and MSK-IMPACT sequencing.”
§ A foundation model for clinical-grade computational pathology and rare cancers detection > Results > Biomarker detection in routine imaging obviates additional testing
hedgeddirect- Asserted: passes — The authors put it forward as true.
- Checkable: passes — It can be checked against evidence.
- Load-bearing: passes — The paper’s conclusions depend on it.
- Based: passes — The paper gives a reason why it holds.
It may state two separate claims as one. The quote only partly states this claim.
- Rests on an assumption: The prediction of biomarkers from standard H&E stained images can reduce the reliance on testing using additional methods and the associated substantial delays in returning results to patients.
In the paper
“DINO v.2 was shown to learn a similar semantic feature separation on natural images, allowing foreground/background separation (for example, discriminating a bus or a bird from the background) as well as part annotation (for example, wheels versus windows in a bus)33.”
§ A foundation model for clinical-grade computational pathology and rare cancers detection > Results > Tile-level benchmarks and qualitative analysis demonstrate generalizability
What the sources say
- Not checked yetcites [33] Oquab, M. et al. DINOv2: Learning Robust Visual Features without Supervision. In Transactions on Machine Learning Research 2835–8856 (TMLR, 2024).
plaindirect- Asserted: passes — The authors put it forward as true.
- Checkable: passes — It can be checked against evidence.
- Load-bearing: fails — The paper’s conclusions may not depend on it.
- Based: passes — The paper gives a reason why it holds.
Probably not a substantial claim. The paper’s conclusions may not depend on it.
What the paper did — it cites no source for this, so there is none to check. The quote shows it is in the paper.
In the paper
“however, in this work, as in many other works in self-supervised learning for computational pathology, algorithmic and training settings are largely based on what was successful in the natural image domain.”
§ A foundation model for clinical-grade computational pathology and rare cancers detection > Discussion
plain- Asserted: passes — The authors put it forward as true.
- Checkable: passes — It can be checked against evidence.
- Load-bearing: fails — The paper’s conclusions may not depend on it.
- Based: passes — The paper gives a reason why it holds.
Probably not a substantial claim. The paper’s conclusions may not depend on it.
What the paper did — it cites no source for this, so there is none to check. The quote shows it is in the paper.
In the paper
“We note that due to the rarity of these variants of cancers, rare variants prediction lacks the statistical power of the product datasets.”
§ A foundation model for clinical-grade computational pathology and rare cancers detection > Results > Toward clinical-grade performance
plaindirect- Asserted: passes — The authors put it forward as true.
- Checkable: passes — It can be checked against evidence.
- Load-bearing: fails — The paper’s conclusions may not depend on it.
- Based: passes — The paper gives a reason why it holds.
Probably not a substantial claim. The paper’s conclusions may not depend on it.
What the paper did — it cites no source for this, so there is none to check. The quote shows it is in the paper.
In the paper
“To establish the clinical cancer diagnosis at the specimen level, a rule-based natural language processing system was employed.”
§ A foundation model for clinical-grade computational pathology and rare cancers detection > Methods > Pan-cancer detection
plaindirect- Asserted: passes — The authors put it forward as true.
- Checkable: passes — It can be checked against evidence.
- Load-bearing: passes — The paper’s conclusions depend on it.
- Based: passes — The paper gives a reason why it holds.
Probably not a substantial claim.
What the paper did — it cites no source for this, so there is none to check. The quote shows it is in the paper.
In the paper
“Uniquely designed to test OOD generalization, the training set (335,996 images) is composed of data from three different hospitals, whereas the validation subset (34,904 images) and testing subset (85,054 images) each originate from separate hospitals not represented in the training data.”
§ A foundation model for clinical-grade computational pathology and rare cancers detection > Methods > Tile-level benchmarking
plain- Asserted: passes — The authors put it forward as true.
- Checkable: passes — It can be checked against evidence.
- Load-bearing: passes — The paper’s conclusions depend on it.
- Based: passes — The paper gives a reason why it holds.
It may state two separate claims as one.
What the paper did — it cites no source for this, so there is none to check. The quote shows it is in the paper.
In the paper
“If one was not provided with the public dataset, we randomly split out 10% of the training data to make a validation set.”
§ A foundation model for clinical-grade computational pathology and rare cancers detection > Methods > Tile-level benchmarking
plaindirect- Asserted: passes — The authors put it forward as true.
- Checkable: passes — It can be checked against evidence.
- Load-bearing: fails — The paper’s conclusions may not depend on it.
- Based: passes — The paper gives a reason why it holds.
Probably not a substantial claim. The paper’s conclusions may not depend on it.
The paper states this without a source or data behind it here, so there is nothing to check it against. The quote shows it is in the paper.
In the paper
“AUC is a suitable general metric because it does not require selecting a threshold for the model’s probability outputs, something that may need tuning for different data subpopulations.”
§ A foundation model for clinical-grade computational pathology and rare cancers detection > Methods > Pan-cancer detection
plaindirect- Asserted: passes — The authors put it forward as true.
- Checkable: passes — It can be checked against evidence.
- Load-bearing: fails — The paper’s conclusions may not depend on it.
- Based: passes — The paper gives a reason why it holds.
Probably not a substantial claim. The paper’s conclusions may not depend on it.
What the paper did — it cites no source for this, so there is none to check. The quote shows it is in the paper.
In the paper
“A validation set was used for all tasks.”
§ A foundation model for clinical-grade computational pathology and rare cancers detection > Methods > Tile-level benchmarking
plain- Asserted: passes — The authors put it forward as true.
- Checkable: passes — It can be checked against evidence.
- Load-bearing: fails — The paper’s conclusions may not depend on it.
- Based: passes — The paper gives a reason why it holds.
Probably not a substantial claim. The paper’s conclusions may not depend on it.
What the paper did — it cites no source for this, so there is none to check. The quote shows it is in the paper.
In the paper
“Cancerous slides are curated and labeled by a pathologist, and are appended with slides from benign blocks determined from synoptic reports collected at MSKCC.”
§ A foundation model for clinical-grade computational pathology and rare cancers detection > Methods > Clinical evaluation datasets
plain- Asserted: passes — The authors put it forward as true.
- Checkable: passes — It can be checked against evidence.
- Load-bearing: passes — The paper’s conclusions depend on it.
- Based: passes — The paper gives a reason why it holds.
Probably not a substantial claim. It may state two separate claims as one.
The paper states this without a source or data behind it here, so there is nothing to check it against. The quote shows it is in the paper.
In the paper
“Specificity at 95% sensitivity is informative because a clinical system must be not only sensitive but also specific in practice.”
§ A foundation model for clinical-grade computational pathology and rare cancers detection > Methods > Pan-cancer detection
plain- Asserted: passes — The authors put it forward as true.
- Checkable: fails — It may be too vague to check against evidence.
- Load-bearing: fails — The paper’s conclusions may not depend on it.
- Based: passes — The paper gives a reason why it holds.
Probably not a substantial claim. It may be too vague to check against evidence. The paper’s conclusions may not depend on it.
What the paper did — it cites no source for this, so there is none to check. The quote shows it is in the paper.
In the paper
“For testing set evaluation, the classifier checkpoint that achieved the lowest loss on the validation set was selected.”
§ A foundation model for clinical-grade computational pathology and rare cancers detection > Methods > Tile-level benchmarking
plain- Asserted: passes — The authors put it forward as true.
- Checkable: passes — It can be checked against evidence.
- Load-bearing: fails — The paper’s conclusions may not depend on it.
- Based: passes — The paper gives a reason why it holds.
Probably not a substantial claim. The paper’s conclusions may not depend on it.
What the paper did — it cites no source for this, so there is none to check. The quote shows it is in the paper.
In the paper
“Due to the scale of training, our study has not been able to fully explore the effectiveness of data-balancing and -distillation strategies.”
§ A foundation model for clinical-grade computational pathology and rare cancers detection > Discussion
plaindirect- Asserted: passes — The authors put it forward as true.
- Checkable: passes — It can be checked against evidence.
- Load-bearing: fails — The paper’s conclusions may not depend on it.
- Based: passes — The paper gives a reason why it holds.
Probably not a substantial claim. The paper’s conclusions may not depend on it.
A conclusion the paper draws from its own results — it cites no other source for it, so there is none to check. The quote shows it is in the paper.
In the paper
“Although scaling up the size of a tile-level foundation model may improve performance, it is likely that such models must be extended to the slide level to achieve the data efficiency required for low-data tasks such as the prediction of biomarkers, treatment response or clinical outcome.”
§ A foundation model for clinical-grade computational pathology and rare cancers detection > Discussion
hedgedconditional- Asserted: passes — The authors put it forward as true.
- Checkable: fails — It may be too vague to check against evidence.
- Load-bearing: passes — The paper’s conclusions depend on it.
- Based: passes — The paper gives a reason why it holds.
Probably not a substantial claim. It may be too vague to check against evidence.
What the paper did — it cites no source for this, so there is none to check. The quote shows it is in the paper.
In the paper
“The pan-cancer detection models are evaluated on a combination of data sourced from MSKCC and external institutions. None of the patients in the evaluation set were seen during training.”
§ A foundation model for clinical-grade computational pathology and rare cancers detection > Methods > Pan-cancer detection
plainn = 6,142- Asserted: passes — The authors put it forward as true.
- Checkable: passes — It can be checked against evidence.
- Load-bearing: passes — The paper’s conclusions depend on it.
- Based: passes — The paper gives a reason why it holds.
It may state two separate claims as one.
In the paper
“The EGFR oncogenic mutation screening in non-small cell lung cancer is essential to determine eligibility for targeted therapies in late stage non-small cell lung cancer67.”
§ A foundation model for clinical-grade computational pathology and rare cancers detection > Methods > Biomarker detection
What the sources say
- Not checked yetcites [67] Kalemkerian, G. P. et al. Molecular testing guideline for the selection of patients with lung cancer for treatment with targeted tyrosine kinase inhibitors: American Society of Clinical Oncology endorsement of the College of American Pathologists/international Association for the Study of Lung Cancer/Association for Molecular Pathology Clinical Practice guideline update. J. Clin. Oncol. https://doi.org/10.1200/JCO.2017.76.7293 (2018). source
plaindirect- Asserted: passes — The authors put it forward as true.
- Checkable: passes — It can be checked against evidence.
- Load-bearing: fails — The paper’s conclusions may not depend on it.
- Based: passes — The paper gives a reason why it holds.
Probably not a substantial claim. The paper’s conclusions may not depend on it.
A conclusion the paper draws from its own results — it cites no other source for it, so there is none to check. The quote shows it is in the paper.
In the paper
“Overall, our investigation into scaling behavior suggests that increasing the number of model parameters remains a salient axis to explore.”
§ A foundation model for clinical-grade computational pathology and rare cancers detection > Discussion
hedged- Asserted: passes — The authors put it forward as true.
- Checkable: fails — It may be too vague to check against evidence.
- Load-bearing: passes — The paper’s conclusions depend on it.
- Based: passes — The paper gives a reason why it holds.
Probably not a substantial claim. It may be too vague to check against evidence.
What the paper did — it cites no source for this, so there is none to check. The quote shows it is in the paper.
In the paper
“Each slide has been labeled by a pathologist according to presence of invasive cancer, and the largest tumor on the slide is measured to categorize the tumor into macrometastasis, micrometastasis or infiltrating tumor cells.”
§ A foundation model for clinical-grade computational pathology and rare cancers detection > Methods > Clinical evaluation datasets
plain- Asserted: passes — The authors put it forward as true.
- Checkable: passes — It can be checked against evidence.
- Load-bearing: passes — The paper’s conclusions depend on it.
- Based: passes — The paper gives a reason why it holds.
Probably not a substantial claim. It may state two separate claims as one.
What the paper did — it cites no source for this, so there is none to check. The quote shows it is in the paper.
In the paper
“Labels for the blocks are extracted from synoptic reports collected at MSKCC.”
§ A foundation model for clinical-grade computational pathology and rare cancers detection > Methods > Clinical evaluation datasets
plain- Asserted: passes — The authors put it forward as true.
- Checkable: passes — It can be checked against evidence.
- Load-bearing: fails — The paper’s conclusions may not depend on it.
- Based: passes — The paper gives a reason why it holds.
Probably not a substantial claim. The paper’s conclusions may not depend on it.
What the paper did — it cites no source for this, so there is none to check. The quote shows it is in the paper.
In the paper
“A cut-off for FGA was established that enriched for TP53 mutations in the distribution of ovarian cancer cases.”
§ A foundation model for clinical-grade computational pathology and rare cancers detection > Methods > Biomarker detection
plaincorrelational- Asserted: passes — The authors put it forward as true.
- Checkable: passes — It can be checked against evidence.
- Load-bearing: fails — The paper’s conclusions may not depend on it.
- Based: passes — The paper gives a reason why it holds.
Probably not a substantial claim. The paper’s conclusions may not depend on it.
What the paper did — it cites no source for this, so there is none to check. The quote shows it is in the paper.
In the paper
“As with most histopathology self-supervised models, embeddings are generated at the tile level using ×20 magnification (0.5 mpp) as opposed to the slide level and therefore require training an aggregation model.”
§ A foundation model for clinical-grade computational pathology and rare cancers detection > Discussion
plaindirect- Asserted: passes — The authors put it forward as true.
- Checkable: passes — It can be checked against evidence.
- Load-bearing: fails — The paper’s conclusions may not depend on it.
- Based: passes — The paper gives a reason why it holds.
Probably not a substantial claim. The paper’s conclusions may not depend on it. It may state two separate claims as one.
What the paper did — it cites no source for this, so there is none to check. The quote shows it is in the paper.
In the paper
“Due to the small biomarker dataset sizes, the learning rate was not chosen on a validation set to evaluate generalization; rather, this serves as a benchmark across the different types of tile embeddings (Virchow, UNI, Phikon and CTransPath), yielding an estimate of the best possible biomarker performance for each type.”
§ A foundation model for clinical-grade computational pathology and rare cancers detection > Methods > Biomarker detection
hedgeddirect- Asserted: passes — The authors put it forward as true.
- Checkable: passes — It can be checked against evidence.
- Load-bearing: passes — The paper’s conclusions depend on it.
- Based: passes — The paper gives a reason why it holds.
It may state two separate claims as one.
In the paper
“Anecdotal experience from pathologists suggested there may be a morphological signal for FGFR alterations66.”
§ A foundation model for clinical-grade computational pathology and rare cancers detection > Methods > Biomarker detection
What the sources say
- Not checked yetcites [66] Al-Ahmadie, H. A. et al. Somatic mutation of fibroblast growth factor receptor-3 (FGFR3) defines a distinct morphological subtype of high-grade urothelial carcinoma. J. Pathol. 224, 270–279 (2011). source
hedgedcorrelational- Asserted: passes — The authors put it forward as true.
- Checkable: passes — It can be checked against evidence.
- Load-bearing: fails — The paper’s conclusions may not depend on it.
- Based: passes — The paper gives a reason why it holds.
Probably not a substantial claim. The paper’s conclusions may not depend on it.
In the paper
“The biallelic loss of cadherin 1 (CDH1) gene (encoding E-cadherin) is strongly correlated with lobular breast cancer and a distinct histologic phenotype and biologic behavior65.”
§ A foundation model for clinical-grade computational pathology and rare cancers detection > Methods > Biomarker detection
What the sources say
- Not checked yetcites [65] Berx, G. & Van Roy, F. The E-cadherin/catenin complex: an important gatekeeper in breast cancer tumorigenesis and malignant progression. Breast Cancer Res. 3, 289–293 (2001). source
boostedcorrelational- Asserted: passes — The authors put it forward as true.
- Checkable: passes — It can be checked against evidence.
- Load-bearing: fails — The paper’s conclusions may not depend on it.
- Based: passes — The paper gives a reason why it holds.
Probably not a substantial claim. The paper’s conclusions may not depend on it.
What the paper did — it cites no source for this, so there is none to check. The quote shows it is in the paper.
In the paper
“We randomly split each dataset into training and testing subsets, ensuring no patient overlap, as shown in Supplementary Table 3.1.”
§ A foundation model for clinical-grade computational pathology and rare cancers detection > Methods > Biomarker detection
plain- Asserted: passes — The authors put it forward as true.
- Checkable: passes — It can be checked against evidence.
- Load-bearing: passes — The paper’s conclusions depend on it.
- Based: passes — The paper gives a reason why it holds.
Probably not a substantial claim.
What the paper did — it cites no source for this, so there is none to check. The quote shows it is in the paper.
In the paper
“Each slide is individually inspected by a pathologist and labeled according to presence of invasive cancer.”
§ A foundation model for clinical-grade computational pathology and rare cancers detection > Methods > Clinical evaluation datasets
plain- Asserted: passes — The authors put it forward as true.
- Checkable: passes — It can be checked against evidence.
- Load-bearing: passes — The paper’s conclusions depend on it.
- Based: passes — The paper gives a reason why it holds.
Probably not a substantial claim.
None of the sources cited for this claim have been checked yet.
In the paper
“Now self-supervised learning is enabling in-domain transfer by removing the label requirement, driving a second wave of scaling to tens of thousands of WSIs to inform image representation35–39,56.”
§ A foundation model for clinical-grade computational pathology and rare cancers detection > Discussion
What the sources say
- Not checked yetcites [35] Wang, X. et al. Transformer-based unsupervised contrastive learning for histopathological image classification. Med. Image Anal. 81, 102559 (2022). source
- Not checked yetcites [36] Ciga, O., Xu, T. & Martel, A. L. Self supervised contrastive learning for digital histopathology. Mach. Learn. Appl. 7, 100198 (2022).
- Not checked yetcites [37] Filiot, A. et al. Scaling self-supervised learning for histopathology with masked image modeling. Preprint at https://doi.org/10.1101/2023.07.21.23292757 (2023). source
- Not checked yetcites [38] Azizi, S. et al. Robust and data-efficient generalization of self-supervised machine learning for diagnostic imaging. Nat. Biomed. Eng. 7, 1–24 (2023). source
- Not checked yetcites [39] Kang, M., Song, H., Park, S., Yoo, D. & Pereira, S. Benchmarking self-supervised learning on diverse pathology datasets. In Proc. IEEE/CVF Conference on Computer Vision and Pattern Recognition 3344–3354 (IEEE, 2023). source
- Not checked yetcites [56] Chen, R. J. et al. Scaling vision transformers to gigapixel images via hierarchical self-supervised learning. In Proc. IEEE/CVF Conference on Computer Vision and Pattern Recognition 16123–16134 (IEEE, 2022). source
plaindirect- Asserted: passes — The authors put it forward as true.
- Checkable: passes — It can be checked against evidence.
- Load-bearing: passes — The paper’s conclusions depend on it.
- Based: passes — The paper gives a reason why it holds.
It may state two separate claims as one.
The paper relies on this without support.
The prediction of biomarkers from standard H&E stained images can reduce the reliance on testing using additional methods and the associated substantial delays in returning results to patients.
“The prediction of biomarkers from standard H&E stained images can reduce the reliance on testing using additional methods and the associated substantial delays in returning results to patients (Fig. 4a).”
The paper relies on this without support.
The success of such applications depends on the ability to model the diverse patterns observed in pathology images.
“The success of such applications depends on the ability to model the diverse patterns observed in pathology images.”
The paper relies on this without support.
The value of a pathology foundation model is twofold: generalizability and training data efficiency.
“The value of a pathology foundation model is twofold: generalizability and training data efficiency.”
The paper relies on this without support.
In clinical practice, most biopsy samples are benign.
“In clinical practice, where most biopsy samples are benign, a pan-cancer detection system can prioritize cases to help reduce diagnostic turnaround.”
The paper relies on this without support.
Histopathology data differs from natural image data in key ways: the long-tailed distribution of pathologic entities and histological structures, the lack of object scale diversity and the restricted color space.
“Histopathology data differs from natural image data in key ways: the long-tailed distribution of pathologic entities and histological structures, the lack of object scale diversity and the restricted color space.”
The paper relies on this without support.
Model performance critically depends on the model’s ability to capture image features.
“This process, called transfer learning, was motivated by the observation that model performance critically depends on the model’s ability to capture image features.”
The paper relies on this without support.
In-domain transfer learning was not possible given the limited availability of labeled pathology datasets.
“In-domain transfer learning was not possible given the limited availability of labeled pathology datasets.”
The paper relies on this without support.
AR amplification or overexpression is found in 30%–50% of castration-resistant prostate cancers and is associated with resistance to androgen deprivation therapy.
“The AR amplification/overexpression was found in 30%–50% of castration resistant prostate cancers and was associated with resistance to androgen deprivation therapy.”
The paper relies on this without support.
HER2 overexpression and/or amplification are more heterogeneous in gastric cancer compared to breast cancer.
“Human epidermal growth factor receptor 2 (HER2) overexpression and/or amplification are much more heterogeneous in gastric cancer compared to breast cancer.”
The paper relies on this without support.
Approximately 20% of gastric cancer patients have HER2 overexpression or high-level amplification.
“Approximate 20% of gastric cancer patients are found to correlate with HER2 overexpression/high-level amplification, and they would be likely to benefit from treatment with an anti-HER2 antibody therapy.”
The paper relies on this without support.
Gastric cancer patients with HER2 overexpression or high-level amplification would likely benefit from anti-HER2 antibody therapy.
“Approximate 20% of gastric cancer patients are found to correlate with HER2 overexpression/high-level amplification, and they would be likely to benefit from treatment with an anti-HER2 antibody therapy.”
The paper relies on this without support.
PTEN is the most frequently mutated tumor suppressor gene in endometrial cancer.
“PTEN is the most frequently mutated tumor suppressor gene in endometrial cancer.”
The paper relies on this without support.
The presence of PTEN mutation is significantly associated with poorer prognosis in survival and disease recurrence.
“The presence of PTEN mutation showed to be significantly associated with poorer prognosis in survival and disease recurrence.”
The paper relies on this without support.
RET mutations are highly associated with medullary thyroid cancer.
“RET mutations were highly associated with medullary thyroid cancer, which accounts for about 5–10% of all thyroid cancer.”
The paper relies on this without support.
Medullary thyroid cancer accounts for about 5–10% of all thyroid cancer.
“RET mutations were highly associated with medullary thyroid cancer, which accounts for about 5–10% of all thyroid cancer.”
The paper relies on this without support.
Screening RET oncogenic mutations plays an important role in diagnosis and prognosis of medullary thyroid cancer.
“Screening RET oncogenic mutations plays an important role in diagnosis and prognosis of medullary thyroid cancer.”
The paper relies on this without support.
BRAF is one of the most frequently mutated genes in melanoma.
“BRAF is one of the most frequently mutated genes in melanoma, and V600E mutation is the most common variant, which leads to constitutive activation of the BRAF/MEK/ERK signaling pathway.”
The paper relies on this without support.
V600E is the most common BRAF variant in melanoma.
“BRAF is one of the most frequently mutated genes in melanoma, and V600E mutation is the most common variant, which leads to constitutive activation of the BRAF/MEK/ERK signaling pathway.”
The paper relies on this without support.
BRAF V600E mutation leads to constitutive activation of the BRAF/MEK/ERK signaling pathway.
“BRAF is one of the most frequently mutated genes in melanoma, and V600E mutation is the most common variant, which leads to constitutive activation of the BRAF/MEK/ERK signaling pathway.”
The paper relies on this without support.
Targeted therapy with BRAF inhibitors shows better survival outcome in patients with BRAF V600-mutated melanoma.
“Targeted therapy with BRAF inhibitors showed better survival outcome in patients with BRAF V600-mutated melanoma.”
The paper relies on this without support.
High-grade serous ovarian cancer is characterized by high prevalence of TP53 mutations and genome instability with widespread genetic alteration.
“High-grade serous ovarian cancer is characterized by high prevalence of TP53 mutations and genome instability with widespread genetic alteration.”
Claims other papers make about this one
Each is checked against this paper’s own text: does it say what the citing paper says it does?
The source backs part of the claim, not all of it — or backs it for a different population, condition or comparison.
In the citing paper
“To overcome these limitations, several research groups have alternatively proposed the use of weakly-supervised deep learning models, which can be trained to perform various downstream computational pathology tasks such as tumor subtyping and prognosis32–37 without any region or pixel-level annotations.”
From Predicting the tumor microenvironment composition and immunotherapy response in non-small cell lung cancer from digital histopathology images (2024) · cites this paper as [36]
Experimental — accuracy not yet measuredThe source backs part of the claim, not all of it — or backs it for a different population, condition or comparison.
In the citing paper
“UNI [191], Prov-GigaPath [192], and Virchow [193] were pretrained solely on pathology image data to perform cancer classification, diagnosis, and prognosis.”
From Challenges in AI-driven Biomedical Multimodal Data Fusion and Analysis (2025) · cites this paper as [193]
Experimental — accuracy not yet measuredThe cited source says what the claim attributes to it.
In the citing paper
“Built on rich knowledge representations, these models have shown impressive performance across medical fields such as ophthalmology20, radiology21 and pathology22–25.”
From A Multimodal Vision Foundation Model for Clinical Dermatology (2025) · cites this paper as [24]
In the citing paper
“In fact GMA is widely used to assess the performance of pathology foundation models23,25,26.”
From A clinical benchmark of public self-supervised pathology foundation models (2025) · cites this paper as [25]
Self-check
Percentages, sums and reported differences re-computed from the paper’s own numbers.
Each contradiction between two passages listed here was confirmed by an independent check.
Rated minor: it would not touch a result — a value no result rests on, a p-value that stays on the same side of the significance level, or a conflict that is clerical, resolved elsewhere in the paper, or outside its own findings.
In the paper
§ A foundation model for clinical-grade computational pathology and rare cancers detection > Methods > Qualitative feature analysis
“Figure 5d shows some examples of the unsupervised feature separation achieved in this way.”
§ A foundation model for clinical-grade computational pathology and rare cancers detection > Results > Tile-level benchmarks and qualitative analysis demonstrate generalizability
“c, Virchow embedding features learn meaningful structures. Cells in the CoNSeP dataset highlighted by embedding principal components: malignant epithelium (red), miscellaneous (yellow) and inflammatory (magenta).”
Rated minor: it would not touch a result — a value no result rests on, a p-value that stays on the same side of the significance level, or a conflict that is clerical, resolved elsewhere in the paper, or outside its own findings.
In the paper
§ A foundation model for clinical-grade computational pathology and rare cancers detection > Results > Toward clinical-grade performance
“the pan-cancer model matches or outperforms these models on rare variants of cancers, as shown in Fig. 3d.”
§ A foundation model for clinical-grade computational pathology and rare cancers detection > Results > Toward clinical-grade performance
“a,b, Performance as measured by AUC of three clinical products compared to the pan-cancer model trained on Virchow embeddings, on the rare variant (a) and product testing datasets (b).”
Rated minor: it would not touch a result — a value no result rests on, a p-value that stays on the same side of the significance level, or a conflict that is clerical, resolved elsewhere in the paper, or outside its own findings.
In the paper
§ A foundation model for clinical-grade computational pathology and rare cancers detection > Methods > Pan-cancer detection
“The performance of the three models is compared using two metrics: AUC and specificity at 95% sensitivity.”
§ A foundation model for clinical-grade computational pathology and rare cancers detection > Results > Virchow enables pan-cancer detection
“Overall the pan-cancer model achieved an AUC of 0.950 with Virchow embeddings, 0.940 with UNI embeddings, 0.932 with Phikon embeddings and 0.907 with CTransPath embeddings”
Rated minor: it would not touch a result — a value no result rests on, a p-value that stays on the same side of the significance level, or a conflict that is clerical, resolved elsewhere in the paper, or outside its own findings.
In the paper
“The TCGA TIL public dataset is composed of 304,097 images (100 × 100 pixels) at ×20 magnification71–73, split into 247,822 training images, 38,601 validation images and 56,275 testing images.”
§ A foundation model for clinical-grade computational pathology and rare cancers detection > Methods > Tile-level benchmarking
Reported 304097 · recomputed 342698
Rated minor: it would not touch a result — a value no result rests on, a p-value that stays on the same side of the significance level, or a conflict that is clerical, resolved elsewhere in the paper, or outside its own findings.
In the paper
§ A foundation model for clinical-grade computational pathology and rare cancers detection > Methods > Biomarker detection
“report the best observed test AUC scores in Fig. 4b.”
§ A foundation model for clinical-grade computational pathology and rare cancers detection > Results > Biomarker detection in routine imaging obviates additional testing
“b, The fraction of positive cases in each biomarker testing dataset. c, The number of biomarkers on which using Virchow, UNI, Phikon or CTransPath embeddings to train an aggregator produced an AUC in the top x.”
Citations
Cites
ImageNet: A large-scale hierarchical image database
Deng, J., Dong, W., Socher, R., Li, L.-J., Li, K., & Fei-Fei, L. (2009) · 2009 IEEE Conference on Computer Vision and Pattern Recognition · doi:10.1109/cvpr.2009.5206848 · Cited by 65,333
Swin Transformer: Hierarchical Vision Transformer using Shifted Windows
Liu, Z., Lin, Y., Cao, Y., Hu, H., Wei, Y., Zhang, Z., Lin, S., & Guo, B. (2021) · 2021 IEEE/CVF International Conference on Computer Vision (ICCV) · doi:10.1109/iccv48922.2021.00986 · Cited by 35,534
DeLong, E. R., DeLong, D. M., & Clarke-Pearson, D. L. (1988) · Biometrics · doi:10.2307/2531595 · Cited by 22,649
Scaling Laws for Neural Language Models
Kaplan, J., McCandlish, S., Henighan, T., Brown, T. B., Chess, B., Child, R., Gray, S., Radford, A., Wu, J., & Amodei, D. (2020) · arXiv · doi:10.48550/arxiv.2001.08361 · Cited by 9,550 · cited 2×
“2g), which is consistent with observations of prior foundation models in other domains 28–30 .”
Masked Autoencoders Are Scalable Vision Learners
He, K., Chen, X., Xie, S., Li, Y., Dollar, P., & Girshick, R. (2022) · 2022 IEEE/CVF Conference on Computer Vision and Pattern Recognition (CVPR) · doi:10.1109/cvpr52688.2022.01553 · Cited by 8,489
Emerging Properties in Self-Supervised Vision Transformers
Caron, M., Touvron, H., Misra, I., Jegou, H., Mairal, J., Bojanowski, P., & Joulin, A. (2021) · 2021 IEEE/CVF International Conference on Computer Vision (ICCV) · doi:10.1109/iccv48922.2021.00951 · Cited by 5,638 · cited 1×
“Additional regularization helps DINO v.2 trained models outperform the earlier DINO variant 25 .”
Note on the Sampling Error of the Difference Between Correlated Proportions or Percentages
McNemar, Q. (1947) · Psychometrika · doi:10.1007/bf02295996 · Cited by 4,754
Probable Inference, the Law of Succession, and Statistical Inference
Wilson, E. B. (1927) · Journal of the American Statistical Association · doi:10.1080/01621459.1927.10502953 · Cited by 4,476
Zehir, A., Benayed, R., Shah, R. H., Syed, A., Middha, S., Kim, H. R., Srinivasan, P., Gao, J., Chakravarty, D., Devlin, S. M., et al. (2017) · Nature Medicine · doi:10.1038/nm.4333 · Cited by 3,380 · cited 1×
“…sections matching the blocks used for DNA extraction and MSK-integrated mutation profiling of actionable targets (MSK-IMPACT) sequencing 50 , the latter of which was analyzed to determine the status of genetic alterations and establish a binary label indicating the presence or absence…”
Self-citationEhteshami Bejnordi, B., Veta, M., Johannes van Diest, P., van Ginneken, B., Karssemeijer, N., Litjens, G., van der Laak, J. A. W. M., and the CAMELYON16 Consortium, Hermsen, M., Manson, Q. F., et al. (2017) · JAMA · doi:10.1001/jama.2017.14585 · Cited by 3,293
Research works printed but not linked: 8
- Chen, T., Kornblith, S., Norouzi, M. & Hinton, G. A simple framework for contrastive learning of visual representations. In Proc. 37th International Conference on Machine Learning (eds Daumé, H. & Singh, A.) 1597–1607 (JMLR.org, 2020).
- Zhou, J. et al. Image BERT Pre-training with Online Tokenizer. In The Tenth International Conference on Learning Representations https://openreview.net/forum?id=ydopy-e6Dg (OpenReview.net, 2022).
- Dosovitskiy, A. et al. An image is worth 16 × 16 words: transformers for image recognition at scale. In The Ninth International Conference on Learning Representations https://openreview.net/forum?id=YicbFdNTTy (OpenReview.net, 2021).
- Ciga, O., Xu, T. & Martel, A. L. Self supervised contrastive learning for digital histopathology. Mach. Learn. Appl. 7, 100198 (2022).
- Casson, A. et al. Joint breast neoplasm detection and subtyping using multi-resolution network trained on large-scale H&E whole slide images with weak labels. In Proc. Medical Imaging with Deep Learning (eds Oguz, I. et al.) 18–38 (JMLR, 2024).
- Ilse, M., Tomczak, J. & Welling, M. Attention-based deep multiple instance learning. In Proc. 35th International Conference on Machine Learning (eds Dy, J. & Krause, A.) 2127–2136 (JMLR, 2018).
- Tarvainen, A. & Valpola, H. Mean teachers are better role models: weight-averaged consistency targets improve semi-supervised deep learning results. In Proc. 31st Conference on Neural Information Processing Systems (eds von Luxburg, U. et al.) 1195–1204 (ACM, 2017).
- Loshchilov, I. & Hutter, F. Decoupled weight decay regularization. In n The Seventh International Conference on Learning Representations https://openreview.net/forum?id=Bkg6RiCqY7 (OpenReview.net, 2019).
Cited by
Sorted by citations
Items 501–600 of 704
Yeh, Y., Yu, W.-H., Hsieh, M., Chang, F.-P., Wang, L.-C., Lu, C.-W., Karlaš, B., Yu, K., Wu, Y.-C., Chen, J., et al. (2026) · JTO Clinical and Research Reports · doi:10.1016/j.jtocrr.2026.101017
Le, M., Liu, X., Vaickus, L. J., Yao, K., & Levy, J. (2026) · Journal of Pathology Informatics · doi:10.1016/j.jpi.2026.100672
Banerjee, A., Aasprong, O. G., Janssen, E., van der Giezen, M., Grimstad, T. B., & Engan, K. (2026) · Journal of Pathology Informatics · doi:10.1016/j.jpi.2026.100674
From histology to spatial transcriptomics: establishing a lightweight single-patch baseline
Jang, H., Shin, H., Lee, H., Jang, Y., Jung, S., & Jeon, M. (2026) · BMC Bioinformatics · doi:10.1186/s12859-026-06447-7
Interpretable multitask model for clinical pathology image prediction and interpretation
Chen, Q., Wang, Z., Lin, X., Shi, Y., Xu, B., Chai, J., Zhang, T., & Wang, C. (2026) · npj Systems Biology and Applications · doi:10.1038/s41540-026-00744-w
Zheng, Q., Mei, H., Weng, X., Yang, R., Wang, K., Ni, X., Wu, J., Fan, J., Liu, T., Yuan, J., et al. (2026) · npj Precision Oncology · doi:10.1038/s41698-026-01443-9
Liu, L., Yin, F., Yang, G., Li, Q., Li, S., Pan, T., Liu, T., Tang, J., Ming, R., Song, Y. Q., et al. (2026) · Computer Science and Information Systems · doi:10.2298/csis251130024l
Optimal Transport with Foundation Models for Multi-Stain CBIR in Digital Pathology
Amodei, M., Marée, R., & Geurts, P. (2026) · IEEE International Symposium on Biomedical Imaging (ISBI) · doi:10.1109/isbi61048.2026.11515508
The Missing Millions: Building Cancer Pathology Artificial Intelligence for Safety Net Populations
Jouzi, Z., & Omar, M. (2026) · Mayo Clinic Proceedings Digital Health · doi:10.1016/j.mcpdig.2026.100374
Unsupervised Tissue Concepts for Explainable Sarcoma Subtype Prediction from H&EPreprint
Bisson, T., Ingram, D., Singh, S., Li, A., Flynn, S. E., Wang, W.-L., Kim, A. E., Bridge, C. P., Demicco, E. G., Sorrentino, A., et al. (2026) · medRxiv · doi:10.64898/2026.05.15.26353333
Channel-Agnostic vs. Channel-Adaptive: Foundation Model Strategies for Spatial Proteomics
Mehrabian, H., Panakkal, S., Sharpnack, M. F., & Diehl, L. J. (2026) · IEEE International Symposium on Biomedical Imaging (ISBI) · doi:10.1109/isbi61048.2026.11515539
Histopathology-Based Deep Learning for Melanoma PDX Drug-Response Tracking
Kapadia, S., Merrill, A., & Kapadia, S. (2025) · IEEE MIT Undergraduate Research Technology Conference (URTC) · doi:10.1109/urtc68753.2025.11533057
Hernández-Abad, I., Ancos-Pintado, R., Mendoza, A., Basterra-García, A., García-Vicente, R., Ortuño, J. E., Rodríguez-García, A., Ortiz-Ruiz, A., Díez, N., Bermejo-Peláez, D., et al. (2026) · Blood Reviews · doi:10.1016/j.blre.2026.101398
Benchmarking Pathology Foundation Models for Spatial Domain Understanding
Zhao, B., Zhang, Y., 宁苑池, Chao, H., Bai, L., Ma, T., Xu, M., Song, M., & Jiang, T. (2026) · Lecture notes in computer science · doi:10.1007/978-3-032-38470-6_4
Martínez-Blanco, P., Suarez, M., Mateo, J., Gil-Rojas, S., Martínez-García, N., Blasco, P., Torralba, M., & Torres, A. M. (2026) · Digestive Diseases and Sciences · doi:10.1007/s10620-026-10032-6
Kong, L., Wu, S., Cai, C., Tsui, F. W., Zhang, X., Zhan, W., Yao, L., Pei, X., Lv, X., Zhou, H., et al. (2026) · Medical Image Analysis · doi:10.1016/j.media.2026.104154
Künstliche Intelligenz in der Molekularpathologie
Kazdal, D. N., Budczies, J., Menzel, M., Altbürger, C., Kahles, A., Ourailidis, I., Brinkmöller, M., Schirmacher, P., & Stenzinger, A. (2026) · Die Pathologie · doi:10.1007/s00292-026-01571-w
Choi, J., Jang, S., Oh, S. S., Lee, J. Y., Kim, K., & Oh, T. (2026) · Scientific Reports · doi:10.1038/s41598-026-56045-z
Chakraborty, R. (2026) · International Journal of Science and Research (IJSR) · doi:10.21275/sr26602001634
Song, T., Tao, R., Wu, C. Y., Zhao, M., Deng, J., Guo, Y., Xu, F., Chen, C., & Qian, K. (2026) · Medical Image Analysis · doi:10.1016/j.media.2026.104152
A multimodal foundation model linking histopathology and DNA methylationPreprint
Wang, D., Zhang, J., Chen, C., Zhang, W., Wang, S., Meng, Y., Sonpavde, G., Horbinski, C., & Tian, Y. (2026) · bioRxiv (Cold Spring Harbor Laboratory) · doi:10.64898/2026.06.11.731518
Ling, Z., Tang, Z., Wu, J., Rui, D., & Zhang, Z. (2026) · Genes & Diseases · doi:10.1016/j.gendis.2026.102304
Janowczyk, A. R., Merkler, D., Michielin, O. A., & Madabhushi, A. (2026) · The Lancet Digital Health · doi:10.1016/j.landig.2026.101000 · Cited by 1
Graf, O., Patel, D., Groß, P., Lempp, C., Hein, M., & Heinemann, F. (2026) · Scientific Reports · doi:10.1038/s41598-026-56510-9
Huang, J., Feng, X. H., Qu, L., & Zheng, L. (2026) · bioRxiv (Cold Spring Harbor Laboratory) · doi:10.64898/2026.06.15.732498
Jun, S., Kim, S., & Kang, Y.-J. (2026) · medRxiv · doi:10.64898/2026.06.18.26355928
Tamim, M., Rahman, A., Hossain, R., Abrar, T., & Khan, R. (2026) · BioMedInformatics · doi:10.3390/biomedinformatics6030037
Suh, Y., Lee, H. B., & Ogino, S. (2026) · Research Square · doi:10.21203/rs.3.rs-10134525/v1
Jang, E., & Huh, Y. (2026) · bioRxiv (Cold Spring Harbor Laboratory) · doi:10.64898/2026.06.18.733058
Zhong, L., Qian, K., Zhao, W., Shen, T., Xu, S., Li, J., & Wang, G. (2026) · Medical Image Analysis · doi:10.1016/j.media.2026.104177 · Cited by 1
Spatially Refined Transformer Embeddings for Accurate Histopathology Tissue Classification
Niedziela, P., & Cyganek, B. (2026) · Lecture notes in computer science · doi:10.1007/978-3-032-29909-3_31
Wu, S., Nearchou, I. P., Prost, S., Fallowfield, J. A., Ueno, H., Tsuda, H., Ironside, A. J., Harrison, D. J., & Kendall, T. J. (2026) · Cancers · doi:10.3390/cancers18132085
Bartusik‐Aebisher, D., Czech, S., Szpara, J., Paul, A., Xavierselvan, M., & Aebisher, D. (2026) · Algorithms · doi:10.3390/a19070524
Artificial Intelligence and Digital Pathology for Molecular Classification of Endometrial Cancer
Jeong, Y., Hong, S., Ahn, S., & Lee, S. H. (2026) · International Journal of Molecular Sciences · doi:10.3390/ijms27167341
Foundation models in urological pathology: Possible impact and potential pitfalls
Zhu, X., Liu, Q., Xia, Y., Zhang, Q., Yu, Z., Liang Cheng, C., & Chen, R. (2026) · Asian journal of urology · doi:10.1016/j.ajur.2026.01.007
Das, P., Kumar, R., & Das, D. K. (2026) · Revista Española de Patología · doi:10.1016/j.patol.2026.100885
Shi, R., Zhi, Y., Gao, L., Li, S., Zhi, K.-Q., & Ren, W. (2026) · Clinical and Translational Medicine · doi:10.1002/ctm2.70723
OmniPathoVQA: Benchmarking pathology vision–language models with Encyclopedia-scale knowledge
Chen, K., Wei, L., Rui, S., Yuan, Y., Zhang, X., Du, Z., He, P., Wang, Y., Liu, M., Zhou, M., et al. (2026) · Medical Image Analysis · doi:10.1016/j.media.2026.104196 · Cited by 1
Self-citationAlkhnbashi, O. S., Mohammad, R., Khyriem, C., Hauns, S., Singh, A., Khan, I., Gomez, R. L., Ramachandran, R., Albedwawi, M. H., AbdulRahim, M. M., et al. (2026) · Artificial Intelligence Review · doi:10.1007/s10462-026-11634-2
García-Hidalgo, C. (2026) · Journal of Imaging Informatics in Medicine · doi:10.1007/s10278-026-02107-7
Muñoz-Maulen, D., Maturana, J., Sobarzo, A., Ormeño, M., Tapia-Belmonte, F., & Salas-Burgos, A. (2026) · Research Square · doi:10.21203/rs.3.rs-10194651/v1
Benchmarking Vision Encoders for Image Classification in Ophthalmology
Zoellin, J., Merk, C., & György, B. (2026) · Computational and Structural Biotechnology Journal · doi:10.34133/csbj.0178 · Cited by 2
A unified vision-language model for precision oncology and biomarker prediction in neuroblastoma
Zhu, J., Hu, R., Yang, S., Sun, Q., Zhao, Z., Cao, J. Y., Pan, P., Wang, K., 崔丽燕, Tang, H., et al. (2026) · Nature Communications · doi:10.1038/s41467-026-74865-5
Coupland, S. E., Rao, A., Jonigk, D., Bülow, R. D., Chetty, R., Rane, S. U., Dave, S., & Naresh, K. N. (2026) · Journal of Clinical Pathology · doi:10.1136/jcp-2026-210720
Kanani, D. A., Salot, P. H., & Nagda, J. (2026) · Cureus · doi:10.7759/cureus.112499
Wang, Z., Yang, C., Tang, X., Yin, E., Yao, Y., Luo, Y., He, J., & Sun, N. (2026) · Genome Medicine · doi:10.1186/s13073-026-01713-y
Bridging the Gap — Translating AI in Pathology into Clinical Impact
Su, F.-Y., Marostica, E., Wang, X., Yang, S., Chiang, J.-H., Ogino, S., Golden, J. A., Kather, J. N., Qiu, Y., Chen, D., et al. (2026) · NEJM AI · doi:10.1056/aip2600029
From unlabeled to labeled: self-supervised deep learning in computational pathology
Akan, T., Aishwarya, R., Bhuiyan, M. S., Conrad, S. A., Vanchiere, J. A., & Bhuiyan, M. A. N. (2026) · BioData Mining · doi:10.1186/s13040-026-00586-6
Wang, Y., Huang, C., Guo, Q., Zhou, W., Chen, Y., 杨照安, Fu, Y., & Yang, Y. (2026) · Lecture notes in computer science · doi:10.1007/978-981-92-3485-1_10
Self-citationVorwerk, J., Leypoldt, L. B., Schwandt, J., Kohler, J., Nimmagadda, S. C., Ahmed, H., Patnana, P. K., Hönemann, H., Helbing, T., Feierabend, S., et al. (2026) · Oncology Research and Treatment · doi:10.1159/000553462
Midhunchakkaravarthy, D., Muni Nagamani, G., & Lakshman Narayana, V. (2026) · Journal of Innovative Image Processing · doi:10.36548/jiip.2026.3.016
Mamounas, E. P., Chen, M., Sparano, J. A., Rahman, M. A., Cheng, Y., Wang, V., Gray, R. J., Rastogi, P., Amidi, E., Geyer, C. E., et al. (2026) · Cancer Research Communications · doi:10.1158/2767-9764.crc-26-0362
he, X., Ming, F., Wang, A., Huang, X., 罗肖邦, Liu, X. Y., Sun, T., Wang, L., & Xu, K. (2026) · bioRxiv (Cold Spring Harbor Laboratory) · doi:10.64898/2026.07.13.738201
DeepPlaque: a scalable multimodal platform for Aβ pathology and cell analysis in Alzheimer’s disease
Wong, H. Y., Jin, C., Yuen, S. L., Yang, X., Gill, S. S., Xu, J., Lai, K. P. E., Fu, W., Gao, W., Wang, X., et al. (2026) · EMBO Molecular Medicine · doi:10.1038/s44321-026-00488-4
Gao, Y., Ma, T., Li, L., Ding, Y., Qi, R., Cui, X., & Gao, X. (2026) · Chinese Medical Journal · doi:10.1097/cm9.0000000000004154
MAD: Self-supervised image embeddings encode molecular information at single-cell resolution
Ha, J., Liu, K., Kim, Y., Sinha, S., & You, S. (2026) · Optics in the Life Sciences · doi:10.1364/microscopy.2026.mw1b.6
Paulikat, M., Bosch, C., Aswolinskiy, W., Borges, I. C., Nauschütte, L., Aichmüller, C., Schmidt, D., Bussmann, H., Kalteis, S., Zapukhlyak, M., et al. (2026) · medRxiv · doi:10.64898/2026.07.22.26358575
Development and Applications of Pathology Foundation Models in Cancer Diagnosis
Xu, C. (2026) · ITM Web of Conferences · doi:10.1051/itmconf/20268801014
Stănescu, L., & Spahiu, C. S. (2026) · Diagnostics · doi:10.3390/diagnostics16152371
Patch-Level Tissue Context Improves Learning from Frozen Pathology Foundation Model Embeddings
Dip, S. A., & Zhang, L. (2026) · ACM International Conference on Bioinformatics, Computational Biology, and Health Informatics (ACM-BCB) · doi:10.1145/3807503.3820870
Jumaah, N. S., Jabbar, M. S., Abbood, S. H., Ayesha, N., Mohamed, M. B. A., & Khan, M. I. (2026) · Computational and Systems Oncology · doi:10.1002/cso2.70022
Machine Learning as Healthcare Catalyst for Data, Infrastructure, and Impact Assessment
Goswami, S., Sharma, S., & Agarwal, P. K. (2026) · International Conference on Computing Methodologies and Communication (ICCMC) · doi:10.1109/iccmc69250.2026.11624726
Alkhatib, A. J. (2026) · Research Square · doi:10.21203/rs.3.rs-10463473/v1
Лысухин, Д. Д., Varlamov, A. V., Matrosova, A. A., Владимеровна, П. Н., AIu, A., Vanushko, V. E., Демура, Т. А., & Urusova, L. S. (2026) · Russian Journal of Archive of Pathology · doi:10.17116/patol20268804141
Single-cell analysis for prognosis and tumor biology assessment in lung adenocarcinoma
Westerdorf, J., Ahmad, W., Lami, K., Bychkov, A., Fukuoka, J., Michels, S. Y. F., Wolf, J., Trost, F., Heldwein, M. B., Quaas, A., et al. (2026) · Precision Pathology · doi:10.1016/j.prpath.2026.100005
A clinical multimodal vision language foundation model with fine-grain explainability
Bai, Y., Cheng, H., Zhou, Y., Zhou, J., Thirunavukarasu, A. J., Ke, Y., Yao, J., Fukutsu, K., Quek, C. W. N., Hong, A. S. Y., et al. (2026) · Nature Medicine · doi:10.1038/s41591-026-04655-5 · Cited by 1
Pasbanigoloojeh, R., Rehman, M. U., Dhahbi, A., & Rakhmanov, Z. (2026) · Applied Artificial Intelligence · doi:10.1080/08839514.2026.2705617
Chen, Y.-H., Xu, Q., Yao, H., Liu, K.-Z., Gui, C., Fu, L., Wang, Y., Zhu, J., Li, J., Chen, M., et al. (2026) · Cancer Medicine · doi:10.1002/cam4.72161
Self-citationYiJiang, D., Yuanwei, J., & Zhang, W. (2026) · Frontiers in Oncology · doi:10.3389/fonc.2026.1825286
Chen, Z., Hu, Y., Xiao, Y., Ju, Y., Zhang, T., Xu, Y., Li, W., Chen, H., Rittscher, J., & Yang, K. (2026) · Lecture notes in computer science · doi:10.1007/978-3-032-38224-5_20
Wu, Q., Gong, Q., Yuan, L., Li, Z., Ashenberg, O., Chen, F., Xavier, R. J., & Uhler, C. (2026) · bioRxiv (Cold Spring Harbor Laboratory) · doi:10.64898/2026.07.31.741265 · Cited by 1
The Scaling Bottleneck of Human Mobility Modeling
Lin, L., Ge, H., Zhang, X., Yao, Y., Hatano, K., Shibasaki, R., & Koshizuka, N. (2026) · ACM SIGKDD Conference on Knowledge Discovery and Data Mining (KDD) · doi:10.1145/3770855.3818976
FusionSurv: A multi-modal fusion representation network for pan-cancer survival analysis
Gao, R., Yang, Z., & Liu, Z. (2026) · Biomedical Signal Processing and Control · doi:10.1016/j.bspc.2026.111197
Shirazi, A. Z., & Gomez, G. A. (2026) · Cancer Medicine · doi:10.1002/cam4.72182
Bilal, M. (2026) · Lecture notes in computer science · doi:10.1007/978-3-032-35387-0_20
The Intersection Between Neuropathology and Artificial Intelligence: A Review
Frassetto, F. P. (2026) · Sage Open Pathology · doi:10.1177/30502098261472442
Self-Supervised AI Discovery of Histomorphological Phenotypes from Routine Mesothelioma BiopsiesPreprint
Seyedshahi, F., Damiola, F., Sequeiros, R., Forest, F., Scherpereel, A., Yuan, K., Lantuéjoul, S., & Quesne, J. P. C. L. (2026) · Research Square · doi:10.64898/2026.08.09.743741
Beyond expertise: exploring behavioral personas in AI-assisted rare renal cancer diagnosis
Park, C., Lee, Y. I., Seo, J., Park, J.-M., Yoon, S. Y., Ahn, B., Cho, Y. M., & Kim, N. (2026) · npj Digital Medicine · doi:10.1038/s41746-026-03134-y
Sun, M., Kong, W., Qiu, S., & Ge, X. (2026) · Journal of Translational Medicine · doi:10.1186/s12967-026-08794-8
Real World Application of Digital Pathology in Gynecologic Pathology Reporting
Bryson, G., Bell, S., & O'Dwyer, D. (2026) · Surgical pathology clinics · doi:10.1016/j.path.2026.06.014
Sun, L., Yao, S., Jia, Q., & Zhu, Y. (2026) · Nature Communications · doi:10.1038/s41467-026-76410-w
Waphare, B. B. (2026) · Advanced International Journal for Research · doi:10.63363/aijfr.2026.v07i04.7167
Guo, Y. (2026) · International Conference on Computer Vision, Image and Deep Learning (CVIDL) · doi:10.1109/cvidl70130.2026.11637802
Wang, W., Zhao, P., & Zhang, Y. (2026) · Pathology - Research and Practice · doi:10.21203/rs.3.rs-10300980/v1
Deep Learning and LLM-Integrated Framework for Real-Time Decision Support in Healthcare
Renganathan, R., Vats, P., Sruthi, P., Kumar, S., Vishwakarma, S. K., & Tiwari, U. (2026) · International Conference on Emerging Trends in Information, Communication & Systems (ICETICS) · doi:10.1109/icetics69505.2026.11651066
Whole-slide imaging in hematopathology: Current state, challenges and future opportunities
Norouziani, R., Yakobov, S., Tizhoosh, H. R., & Campbell, C. J. V. (2026) · Journal of Pathology Informatics · doi:10.1016/j.jpi.2026.100708
Transforming subcellular spatial transcriptomics: deep learning models for cell segmentation
Rathbun, I. A., Banskota, N., Lehrmann, E., Gorospe, M., & De, S. (2026) · Nucleic Acids Research · doi:10.1093/nar/gkag782
Liu, Y., Dong, Y., Zhang, G., Wu, Y., Zhang, S., Chen, Y., Cao, R., Wang, R., Yin, C., & Li, Y. (2026) · Frontiers in Cell and Developmental Biology · doi:10.3389/fcell.2026.1863777
Artificial intelligence in oncology: linking biological discovery to clinical utility
Kuchana, S. K., Alahari, N. V., Kode, R., Jalapu, K. R., & Alahari, S. K. (2026) · Molecular Cancer · doi:10.1186/s12943-026-02771-x
Zhao, X., Kong, W., Jiang, Y., & Sui, F. (2026) · Cellular Oncology · doi:10.1007/s13402-026-01281-8
Zhang, J., He, G., Zhang, W., Jin, X., Qin, W., Wang, Z., & Wang, F. (2026) · Signal Processing · doi:10.1016/j.sigpro.2026.110886
Alkhan, A., Lynch, M., Ryan, E. J., Lavelle, M., & Culhane, A. C. (2026) · Bioinformatics · doi:10.1093/bioinformatics/btag461
HIMLT: A Hybrid Interactive Machine Learning Tool for Whole Slide Image Analysis
Kondreddy, D., Barua, S., Yellu, S., Elghazzali, H., & Lee, S. (2026) · International Conference on Intelligent Multimedia, Networking, and Security (IMNS) · doi:10.1109/imns67862.2026.11655288
Chung, W., Park, Y., Kwak, Y., Lee, H. D., Kim, B., Shin, C. M., Nam, Y., & Lee, H. S. (2026) · Laboratory Investigation · doi:10.1016/j.labinv.2026.106161
AI-powered medicinal chemistry and translational drug development
Kaicheng, U., Zhang, S. M., Yu, Z., Zhang, Z., Zhang, J., He, C., Liu, A., Chen, R., Wang, S., Yan, L., et al. (2026) · Chemical Society Reviews · doi:10.1039/d5cs01469g
IA et pathologie computationnelle
Cheng, Y., & Caldéraro, J. (2026) · Annales de Pathologie · doi:10.1016/j.annpat.2026.07.001
Grading of Castleman Disease Histopathology with an Attention-Based Multiple Instance Learning Model
Morrison, M. J., Alnoor, F., O’Fallon, B. D., Hutchings, A., Dewey, M., English, P., Rangel, A. E., Zuromski, L. M., Knight, K., Bowen, A., et al. (2026) · Diagnostics · doi:10.3390/diagnostics16172750
Liu, Z., Su, L., Yu, J., Geng, X., Wang, L. S., Wang, J., & Liu, J. (2026) · Biomedicines · doi:10.3390/biomedicines14091935 · Cited by 1
Dalani, T., Jerry, W. K. H., Wu, J., Fang, X., Feng, T., Xie, F., Huang, M., Liang, Y., To, K. F., Kang, W., et al. (2026) · Cancers · doi:10.3390/cancers18172802
Metadata
- Authors
- Vorontsov, E., Bozkurt, A., Casson, A., Shaikovski, G., Zelechowski, M., Severson, K., Zimmermann, E., Hall, J., Tenenholtz, N., Fusi, N., Yang, E., Mathieu, P., van Eck, A., Lee, D., Viret, J., Robert, E., Wang, Y. K., Kunz, J. D., Lee, M. C. H., Bernhard, J. H., Godrich, R. A., Oakley, G., Millar, E., Hanna, M., Wen, H., Retamero, J. A., Moye, W. A., Yousfi, R., Kanan, C., Klimstra, D. S., Rothrock, B., Liu, S., & Fuchs, T. J.
- Affiliations
- Microsoft (United States) (US)
- Memorial Sloan Kettering Cancer Center (US)
- St George Hospital (AU)
- University of Rochester (US)
- Corresponding author
- Liu, Siqi
- ORCID
- Vorontsov, Eugene
- Bozkurt, Alican
- Casson, Adam
- Shaikovski, George
- Severson, Kristen
- Tenenholtz, Neil
- Fusi, Nicolo
- Yang, Ellen
- Lee, Donghun
- Robert, Eric
- Wang, Yi Kan
- Kunz, Jeremy D.
- Bernhard, Jan H.
- Godrich, Ran A.
- Oakley, Gerard
- Millar, Ewan
- Hanna, Matthew
- Wen, Hannah
- Kanan, Christopher
- Klimstra, David S.
- Rothrock, Brandon
- Liu, Siqi
- Fuchs, Thomas J.
- Venue
- Nature Medicine
- Published
- 2024-07-22
- Volume
- 30
- Issue
- 10
- Pages
- 2924-2935
- ISSN
- 1078-8956 (ISSN-L)
- 1546-170X
- PMC
- PMC11485232
- OpenAlex
- W4400889241
- Semantic Scholar
- 7c36a73d4bd4b8a96aa79b78d0c751858dde39b8
- Cited by
- 572
- References
- 67
- Citations by year
- 2026: 332 · 2025: 212 · 2024: 28
- FWCI
- 83.87
- Type
- journal article
- Language
- en
- Open access
- hybrid
- doi.org
- Locations
- Nature Medicine (publishedVersion, cc-by)
- PubMed Central (publishedVersion, cc-by)
- PubMed (publishedVersion)
- Funders
- U.S. Department of Health & Human Services | NIH | National Cancer Institute (P30CA008748)
- Topics
- Physical Sciences › Computer Science › Artificial Intelligence › AI in cancer detection
- Health Sciences › Medicine › Health Informatics › Artificial Intelligence in Healthcare and Education
- Health Sciences › Medicine › Radiology, Nuclear Medicine and Imaging › Radiomics and Machine Learning in Medical Imaging
- Keywords
- foundation models, computational pathology, histopathological images, rare tumor, Virchow, biomarker prediction, cell identification, clinical decision support, limited training data
- MeSH terms
- Artificial Intelligence, Humans, Neoplasms, Pathology, Clinical, ROC Curve, Biomarkers, Tumor, Computational Biology, Rare Diseases, Precision Medicine, Neoplasm Grading
About these checks
Registry, retraction, Cites and statistics results are computed, not judged, with one exception: a printed reference that no index lists is read once by a model before it counts as a citation error. Claims are extracted by a model and kept only when their quote appears verbatim in the text; each cited source is then checked, with a model’s help, for whether it says what the claim relies on. Those verdicts can be wrong — read the claim’s quote and the cited source before relying on one.
A language model drew the claims from the paper on 2026-10-06, under version 3 of the claim definition (model deepseek-v4.1-flash, prompt extract-v3).
A second model labelled each claim on 2026-10-06 (model jev-1.13-20260917, definition revision gold-guideline-v0.2).
Cited sources are checked with a language model’s help (gpt-6-sol).
Statistics and arithmetic are recomputed, not judged.
Confidence bands are shown only for fields calibrated on our annotated test set. None is calibrated yet, so no band is shown.
What counts as a claim ›How we measure confidence ›How we check this ›
Are you an author, or do you see a problem with this page? Request a review
