Cited by 269Protein Structure and DynamicsMachine Learning in BioinformaticsEnzyme Structure and Function

The DOI matches its Crossref record; 55 of the 57 references it cites were found in a registry or an index.

Towards a structurally resolved human protein interaction network

Open access

Published version of a preprint

Abstract

Cellular functions are governed by molecular machines that assemble through protein-protein interactions. Their atomic details are critical to studying their molecular mechanisms. However, fewer than 5% of hundreds of thousands of human protein interactions have been structurally characterized. Here we test the potential and limitations of recent progress in deep-learning methods using AlphaFold2 to predict structures for 65,484 human protein interactions. We show that experiments can orthogonally confirm higher-confidence models. We identify 3,137 high-confidence models, of which 1,371 have no homology to a known structure. We identify interface residues harboring disease mutations, suggesting potential mechanisms for pathogenic variants. Groups of interface phosphorylation sites show patterns of co-regulation across conditions, suggestive of coordinated tuning of multiple protein interactions as signaling responses. Finally, we provide examples of how the predicted binary complexes can be used to build larger assemblies helping to expand our understanding of human cell biology.

Overview

The claims and statistics of this paper haven’t been checked yet.

Run the check — free, no account needed. It reads the open-access text and checks the sources it cites.

A few free checks a day · papers already verified open instantly · results are public

Integrity signals

Registry

Crossref · 10.1038/s41594-022-00910-8

Cites

55 of 55 references verified0 citation errors · 0 not checkable

Statistics

Figures

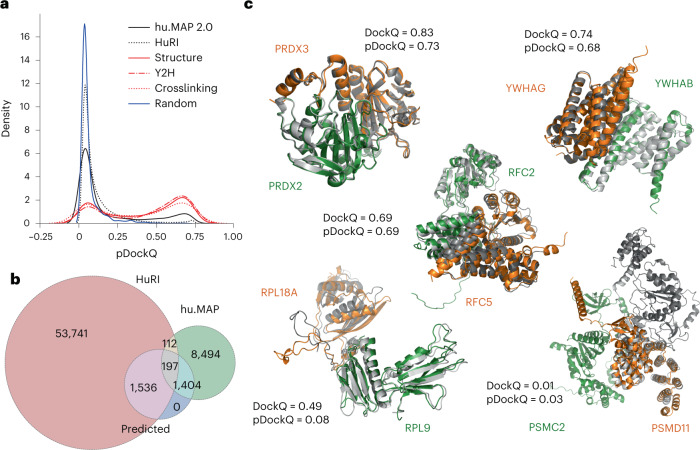
Fig. 1 Application of AlphaFold2 complex predictions to a large dataset of human PPIs. a, Distribution of model confidence score (pDockQ) for predicted structures from two large human protein interaction datasets (hu.MAP and HuRI), compared with confidence metrics from 2,000 random pairs of proteins. The hu.MAP dataset was further subsetted to those that have support from Y2H (‘Y2H’) or crosslink data (‘Crosslinking’), or correspond to pairs with available experimental or homology modeling information (‘Structure’). b, Number of protein interactions with models built from both datasets and those that we consider being of high confidence (‘Predicted’), corresponding to those with pDockQ > 0.5. c, Examples of predicted models (orange and green) overlapped with the corresponding experimental models (gray) and the observed (DockQ) or predicted (pDockQ) quality of the models. Source data
Fig. 1 Application of AlphaFold2 complex predictions to a large dataset of human PPIs. a, Distribution of model confidence score (pDockQ) for predicted structures from two large human protein interaction datasets (hu.MAP and HuRI), compared with confidence metrics from 2,000 random pairs of proteins. The hu.MAP dataset was further subsetted to those that have support from Y2H (‘Y2H’) or crosslink data (‘Crosslinking’), or correspond to pairs with available experimental or homology modeling information (‘Structure’). b, Number of protein interactions with models built from both datasets and those that we consider being of high confidence (‘Predicted’), corresponding to those with pDockQ > 0.5. c, Examples of predicted models (orange and green) overlapped with the corresponding experimental models (gray) and the observed (DockQ) or predicted (pDockQ) quality of the models. Source dataCC BY · PubMed Central
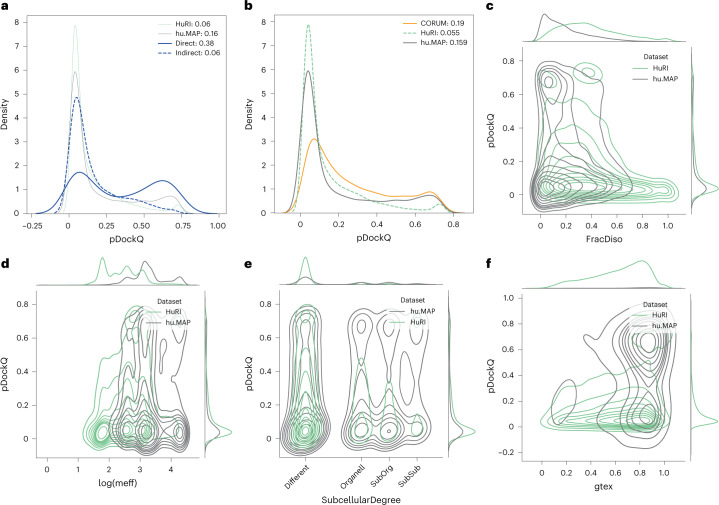
Fig. 2 Protein and interaction features impacting on prediction confidence: analysis of different datasets. In all subfigures, proteins from HuRI in green, hu.MAP gray, CORUM orange and from large PDB complexes blue. a, pDockQ values of directly and indirectly interacting proteins from the same complex (blue); for comparison, HuRI and hu.MAP data are shown with thin lines. b, pDockQ values of CORUM (orange), HuRI (green) and hu.MAP (gray) datasets. c, Fraction of residues predicted to be disordered (pLDDT < 0.5) shows that protein pairs in HuRI are enriched in disorder. d, Proteins in HuRI have fewer sequences in the paired MSAs as measured by the mean number of efficient sequences in the MSA (meff). e, Proteins that share subcellular localization (solid lines) are enriched in high pDockQ scores in all three datasets. f, Only protein pairs in hu.MAP are coexpressed according to STRING, using similarity in Genotype-Tissue Expression (gtex), and coexpressed pairs are enriched in pairs with high pDockQ scores. Source data
Fig. 2 Protein and interaction features impacting on prediction confidence: analysis of different datasets. In all subfigures, proteins from HuRI in green, hu.MAP gray, CORUM orange and from large PDB complexes blue. a, pDockQ values of directly and indirectly interacting proteins from the same complex (blue); for comparison, HuRI and hu.MAP data are shown with thin lines. b, pDockQ values of CORUM (orange), HuRI (green) and hu.MAP (gray) datasets. c, Fraction of residues predicted to be disordered (pLDDT < 0.5) shows that protein pairs in HuRI are enriched in disorder. d, Proteins in HuRI have fewer sequences in the paired MSAs as measured by the mean number of efficient sequences in the MSA (meff). e, Proteins that share subcellular localization (solid lines) are enriched in high pDockQ scores in all three datasets. f, Only protein pairs in hu.MAP are coexpressed according to STRING, using similarity in Genotype-Tissue Expression (gtex), and coexpressed pairs are enriched in pairs with high pDockQ scores. Source dataCC BY · PubMed Central
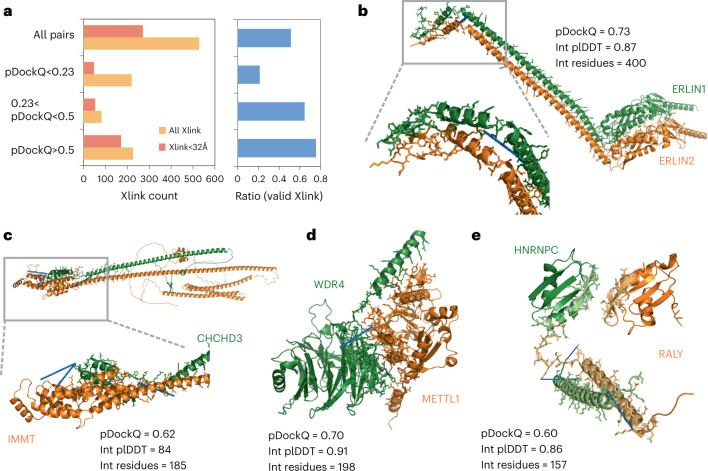
Fig. 3 Crosslink support for predicted complex models. a, The numbers and ratios of predicted structures having crosslink information for pairs of residues that bridge the two proteins in the predicted structure, broken down by the crosslinks that satisfy their expected maximal distance and by the predicted quality of the model (pDockQ). b–e, Examples of predicted structures of high confidence, with no previous structural information and supported by at least one crosslink (indicated with blue line): ERLIN1/ERLIN2 complex (b), IMMT and CHCHD3, components of the mitochondrial inner membrane MICOS complex (c), the complex of transfer RNA-guanine-N(7)-methyltransferase (METTL) with its noncatalytic subunit (WDR4) (d) and the heterogeneous nuclear ribonucleoprotein C (HNRNPC) and the RNA-binding protein, RALY (e). Source data
Fig. 3 Crosslink support for predicted complex models. a, The numbers and ratios of predicted structures having crosslink information for pairs of residues that bridge the two proteins in the predicted structure, broken down by the crosslinks that satisfy their expected maximal distance and by the predicted quality of the model (pDockQ). b–e, Examples of predicted structures of high confidence, with no previous structural information and supported by at least one crosslink (indicated with blue line): ERLIN1/ERLIN2 complex (b), IMMT and CHCHD3, components of the mitochondrial inner membrane MICOS complex (c), the complex of transfer RNA-guanine-N(7)-methyltransferase (METTL) with its noncatalytic subunit (WDR4) (d) and the heterogeneous nuclear ribonucleoprotein C (HNRNPC) and the RNA-binding protein, RALY (e). Source dataCC BY · PubMed Central
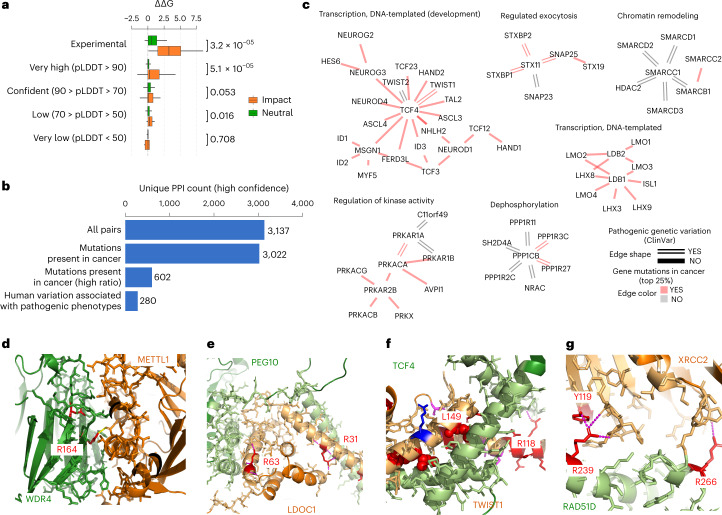
Fig. 4 Disease mutations at protein complex interface residues. a, Boxplot showing the distribution of changes in predicted binding affinity (ΔΔG) for mutations known to have an impact (orange) versus the ones with neutral effect (green). The boxes represent the first and third quartiles. The upper whisker extends from the third quartile to the largest value no further than 1.5 × inter-quartile range (IQR). The lower whisker extends from the first quartile to the smallest value at most 1.5 × IQR. The statistical significance of the differences was tested using two-sided Wilcoxon rank sum test with continuity correction. The total number of data samples was 1,320 (900 neutral, 420 impact) (Supplementary Table 2). The min, mean and max values for the subsets are as follows: Experimental Neutral (−0.5, 1.0, 5.1); Experimental Impact (0.1, 3.4, 8.6); AF plddt > 90 Neutral (−0.9, 0.3, 4.7); AF plddt > 90 Impact (−2.7, 1.0, 12.5,); AF 70 < plddt > 90 Neutral (−2.0, 0.3, 9.0); AF 70 < plddt > 90 Impact (−4.0, 0.5, 7.0); AF 50 < plddt > 70 Neutral (−1.2, 0.1, 2.7); AF 50 < plddt > 70 Impact (−0.2, 0.3, 1.7); AF plddt < 50 Neutral (−2.6, 0.1, 2.0); AF plddt < 50 Impact (−2.6, −0.3, 0.3). b, Unique PPI pairs for high-confidence models (pDockQ > 0.5) in total, with mutations in cancer, mapped to the interface (all and top 25% ratios) and with pathogenic or likely pathogenic clinical variants mapped to the interface. c, Modules related to relevant biological processes. The color of the edge represents the presence of cancer mutations in the interface (top 25% ratio, color red), and the shape the presence of pathogenic clinical variants (double line). d–g, Selected relevant structures with no previous structural knowledge showing clinical variants or mutations in cancer mapped to the interface (mutated residues in red). The interface of WDR4-METTL1 (d), the interface of LDOC1 (e), the interface of TWIST1 (f) and the interface of RAD51D (g). Source data
Fig. 4 Disease mutations at protein complex interface residues. a, Boxplot showing the distribution of changes in predicted binding affinity (ΔΔG) for mutations known to have an impact (orange) versus the ones with neutral effect (green). The boxes represent the first and third quartiles. The upper whisker extends from the third quartile to the largest value no further than 1.5 × inter-quartile range (IQR). The lower whisker extends from the first quartile to the smallest value at most 1.5 × IQR. The statistical significance of the differences was tested using two-sided Wilcoxon rank sum test with continuity correction. The total number of data samples was 1,320 (900 neutral, 420 impact) (Supplementary Table 2). The min, mean and max values for the subsets are as follows: Experimental Neutral (−0.5, 1.0, 5.1); Experimental Impact (0.1, 3.4, 8.6); AF plddt > 90 Neutral (−0.9, 0.3, 4.7); AF plddt > 90 Impact (−2.7, 1.0, 12.5,); AF 70 < plddt > 90 Neutral (−2.0, 0.3, 9.0); AF 70 < plddt > 90 Impact (−4.0, 0.5, 7.0); AF 50 < plddt > 70 Neutral (−1.2, 0.1, 2.7); AF 50 < plddt > 70 Impact (−0.2, 0.3, 1.7); AF plddt < 50 Neutral (−2.6, 0.1, 2.0); AF plddt < 50 Impact (−2.6, −0.3, 0.3). b, Unique PPI pairs for high-confidence models (pDockQ > 0.5) in total, with mutations in cancer, mapped to the interface (all and top 25% ratios) and with pathogenic or likely pathogenic clinical variants mapped to the interface. c, Modules related to relevant biological processes. The color of the edge represents the presence of cancer mutations in the interface (top 25% ratio, color red), and the shape the presence of pathogenic clinical variants (double line). d–g, Selected relevant structures with no previous structural knowledge showing clinical variants or mutations in cancer mapped to the interface (mutated residues in red). The interface of WDR4-METTL1 (d), the interface of LDOC1 (e), the interface of TWIST1 (f) and the interface of RAD51D (g). Source dataCC BY · PubMed Central
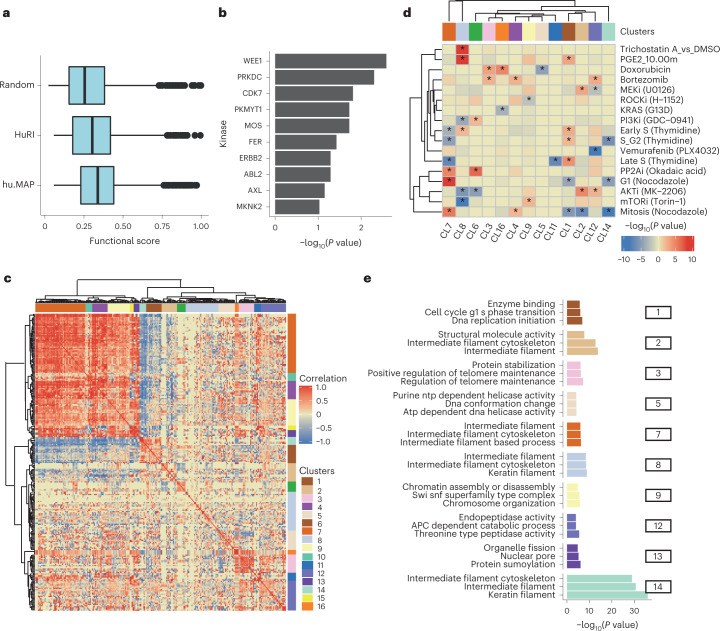
Fig. 5 Co-regulation of phosphorylation sites at interface residues. a, Distribution of phosphosite functional scores for phosphosites at interface residues and random phosphosites. The min, mean and max values were as follows: Random = 0.02, 0.26, 0.98; HuRI = 0.06, 0.37, 0.99; hu.MAP = 0.06, 0.33, 0.99. The boxes represent the first and third quartiles. The upper whisker extends from the third quartile to the largest value no further than 1.5 × IQR. The lower whisker extends from the first quartile to the smallest value at most 1.5 × IQR. b, Enrichment of kinase substrates among phosphosites at interface residues. The P value was derived from an over-representation analysis using a one-sided hyper-geometric test (N = 7,150). c, Hierarchical clustering of the pairwise correlation values for changes in phosphosite levels across conditions. Groups of phosphosites showing high correlation values were defined as clusters (1 to 16), as indicated in colors along the outside of the clustergram. d, Degree of regulation of phosphosites from each cluster in a select panel of conditions, defined by a one-sided Z-test comparing the fold change of the phosphosites in a cluster compared with the entire distribution of fold changes in that condition. The result is summarized as the −log(P value), and signed as positive if the median value is above the background or negative otherwise. e, Gene ontology enrichment analysis for the proteins with phosphosites annotated to select clusters. Source data
Fig. 5 Co-regulation of phosphorylation sites at interface residues. a, Distribution of phosphosite functional scores for phosphosites at interface residues and random phosphosites. The min, mean and max values were as follows: Random = 0.02, 0.26, 0.98; HuRI = 0.06, 0.37, 0.99; hu.MAP = 0.06, 0.33, 0.99. The boxes represent the first and third quartiles. The upper whisker extends from the third quartile to the largest value no further than 1.5 × IQR. The lower whisker extends from the first quartile to the smallest value at most 1.5 × IQR. b, Enrichment of kinase substrates among phosphosites at interface residues. The P value was derived from an over-representation analysis using a one-sided hyper-geometric test (N = 7,150). c, Hierarchical clustering of the pairwise correlation values for changes in phosphosite levels across conditions. Groups of phosphosites showing high correlation values were defined as clusters (1 to 16), as indicated in colors along the outside of the clustergram. d, Degree of regulation of phosphosites from each cluster in a select panel of conditions, defined by a one-sided Z-test comparing the fold change of the phosphosites in a cluster compared with the entire distribution of fold changes in that condition. The result is summarized as the −log(P value), and signed as positive if the median value is above the background or negative otherwise. e, Gene ontology enrichment analysis for the proteins with phosphosites annotated to select clusters. Source dataCC BY · PubMed Central
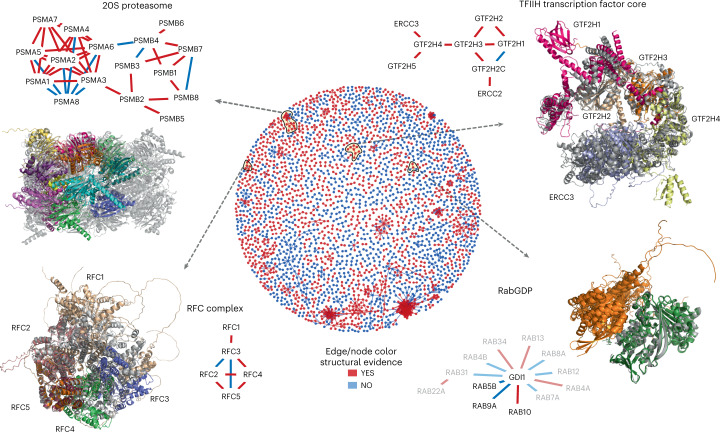
Fig. 6 Protein complex predictions for higher-order assemblies. The middle circle is a network view of all PPIs predicted with high confidence (pDockQ > 0.5). The edges and nodes are colored in red if there is a previous experimental or homology model for the interaction and blue if such information is unavailable. We selected four examples of recapitulated complexes (yellow circles and black arrows) plotted in further detail. In these small networks, only the edges are colored based on structural evidence. In the case of RabGDP, the faded nodes and edges represent predictions with slightly lower confidence (pDockQ > 0.3).
Fig. 6 Protein complex predictions for higher-order assemblies. The middle circle is a network view of all PPIs predicted with high confidence (pDockQ > 0.5). The edges and nodes are colored in red if there is a previous experimental or homology model for the interaction and blue if such information is unavailable. We selected four examples of recapitulated complexes (yellow circles and black arrows) plotted in further detail. In these small networks, only the edges are colored based on structural evidence. In the case of RabGDP, the faded nodes and edges represent predictions with slightly lower confidence (pDockQ > 0.3).CC BY · PubMed Central

Verification

Claims the paper makes

The claims and statistics of this paper haven’t been checked yet.

Run the check — free, no account needed. It reads the open-access text and checks the sources it cites.

A few free checks a day · papers already verified open instantly · results are public

Claims other papers make about this one

Each is checked against this paper’s own text: does it say what the citing paper says it does?

Self-check

Percentages, sums and reported differences re-computed from the paper’s own numbers.

The self-check needs the paper’s full text.

Citations

Cites

Show all 57 references

Cited by

Sorted by citations

See all 269

Metadata

Authors
Burke, D. F., Bryant, P., Barrio-Hernandez, I., Memon, D., Pozzati, G., Shenoy, A., Zhu, W., Dunham, A. S., Albanese, P., Keller, A., Scheltema, R. A., Bruce, J. E., Leitner, A., Kundrotas, P., Beltrao, P., & Elofsson, A.
Affiliations
  • European Bioinformatics Institute (GB)
  • Stockholm University (SE)
  • Utrecht University (NL)
  • University of Washington (US)
  • ETH Zurich (CH)
  • University of Kansas (US)
Corresponding author
  • Kundrotas, Petras
  • Elofsson, Arne
Venue
Nature Structural & Molecular Biology
Published
2023-01-23
Volume
30
Issue
2
Pages
216-225
ISSN
  • 1545-9985 (ISSN-L)
  • 1545-9993
OpenAlex
W4317802023
Cited by
269
References
57
Citations by year
2026: 50 · 2025: 60 · 2024: 80 · 2023: 58
FWCI
22.10
Type
journal article
Language
en
Open access
Locations
  • Nature Structural & Molecular Biology (publishedVersion, cc-by)
  • bioRxiv (Cold Spring Harbor Laboratory) (acceptedVersion, cc-by-nd)
  • Research Square (acceptedVersion, cc-by)
  • PubMed Central (publishedVersion, cc-by)
  • PubMed (publishedVersion)
  • KU ScholarWorks (The University of Kansas) (submittedVersion, cc-by)
  • Utrecht University Repository (Utrecht University) (submittedVersion, other-oa)
  • Research Portal (King's College London) (submittedVersion, cc-by)
  • Repository for Publications and Research Data (ETH Zurich) (submittedVersion, cc-by)
  • ETH Zürich Research Collection (cc-by)
  • ETH Zürich Research Collection
Funders
  • European Commission (823839, HORIZON2020)
  • Eidgenössische Technische Hochschule Zürich
  • Nederlandse Organisatie voor Wetenschappelijk Onderzoek (741.018.201)
  • Linköpings Universitet (SNIC 2021/5-297)
  • Knut och Alice Wallenbergs Stiftelse
  • Vetenskapsrådet (2021-03979, 2016-03798, Berzelius-2021-29)
  • Stockholms Universitet
  • ETH Zürich Foundation
  • Helmut Horten Stiftung
  • National Supercomputer Centre, Linköpings Universitet
  • National Institute on Aging (R56AG070096, R56AG078279)
  • National Heart, Lung, and Blood Institute (R01HL144778)
  • National Institute of General Medical Sciences (R35GM136255)
Topics
  • Life Sciences › Biochemistry, Genetics and Molecular Biology › Molecular Biology › Protein Structure and Dynamics
  • Life Sciences › Biochemistry, Genetics and Molecular Biology › Molecular Biology › Machine Learning in Bioinformatics
  • Life Sciences › Biochemistry, Genetics and Molecular Biology › Structural Biology › Enzyme Structure and Function
Keywords
protein-protein interaction network, AlphaFold2, interface residues, pathogenic variants, phosphorylation sites, co-regulation, protein complexes, molecular machines
MeSH terms
Humans, Mutation, Signal Transduction, Computational Biology, Protein Interaction Maps

About these checks

Registry, retraction, Cites and statistics results are computed, not judged, with one exception: a printed reference that no index lists is read once by a model before it counts as a citation error. Claims are extracted by a model and kept only when their quote appears verbatim in the text; each cited source is then checked, with a model’s help, for whether it says what the claim relies on. Those verdicts can be wrong — read the claim’s quote and the cited source before relying on one.

Statistics and arithmetic are recomputed, not judged.

Confidence bands are shown only for fields calibrated on our annotated test set. None is calibrated yet, so no band is shown.

What counts as a claim ›How we measure confidence ›How we check this ›

Are you an author, or do you see a problem with this page? Request a review