

The DOI matches its Crossref record; 2 of the 2 references it cites were found in a registry or an index.
Effect of Bmi1 over-expression on gene expression in adult and embryonic murine neural stem cells
Abstract
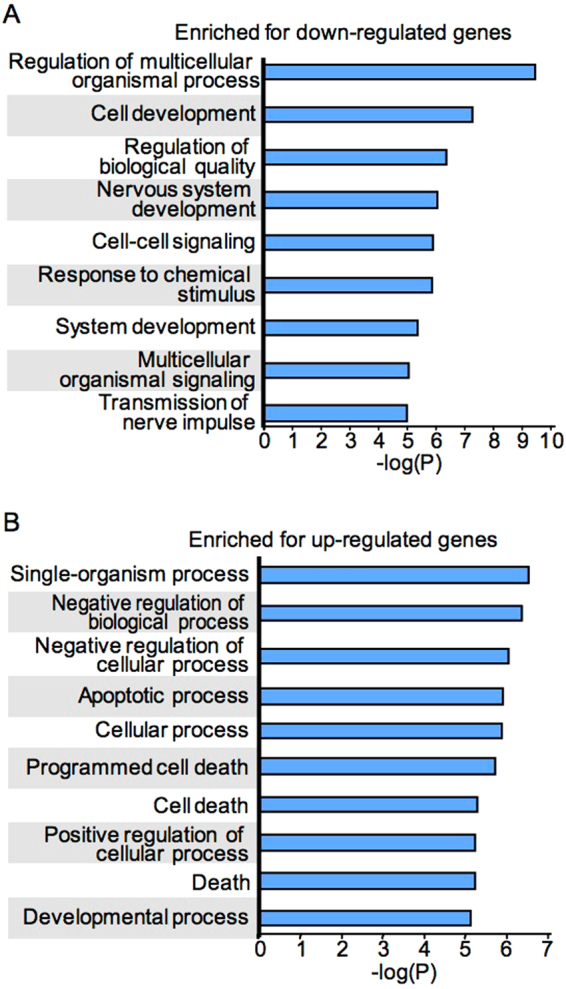
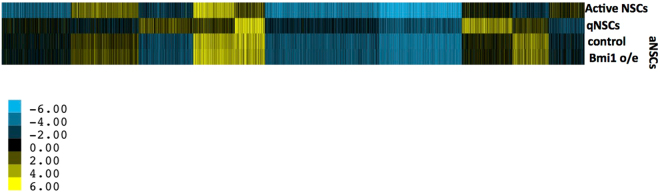
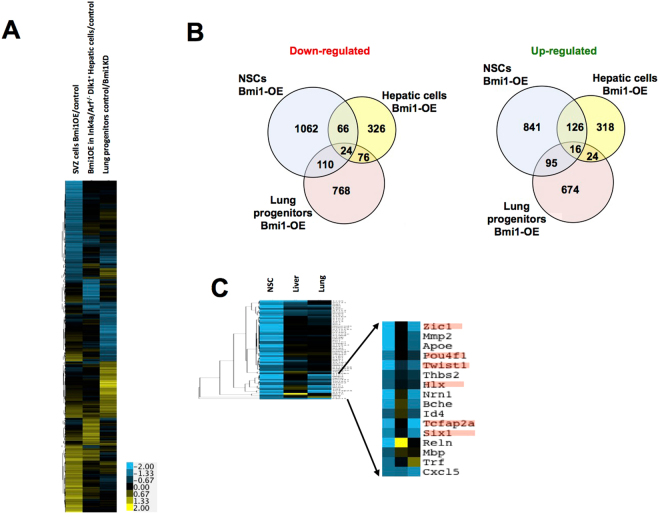
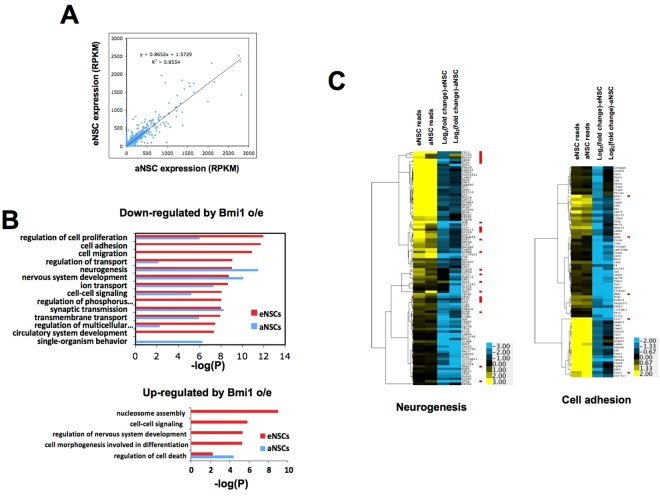
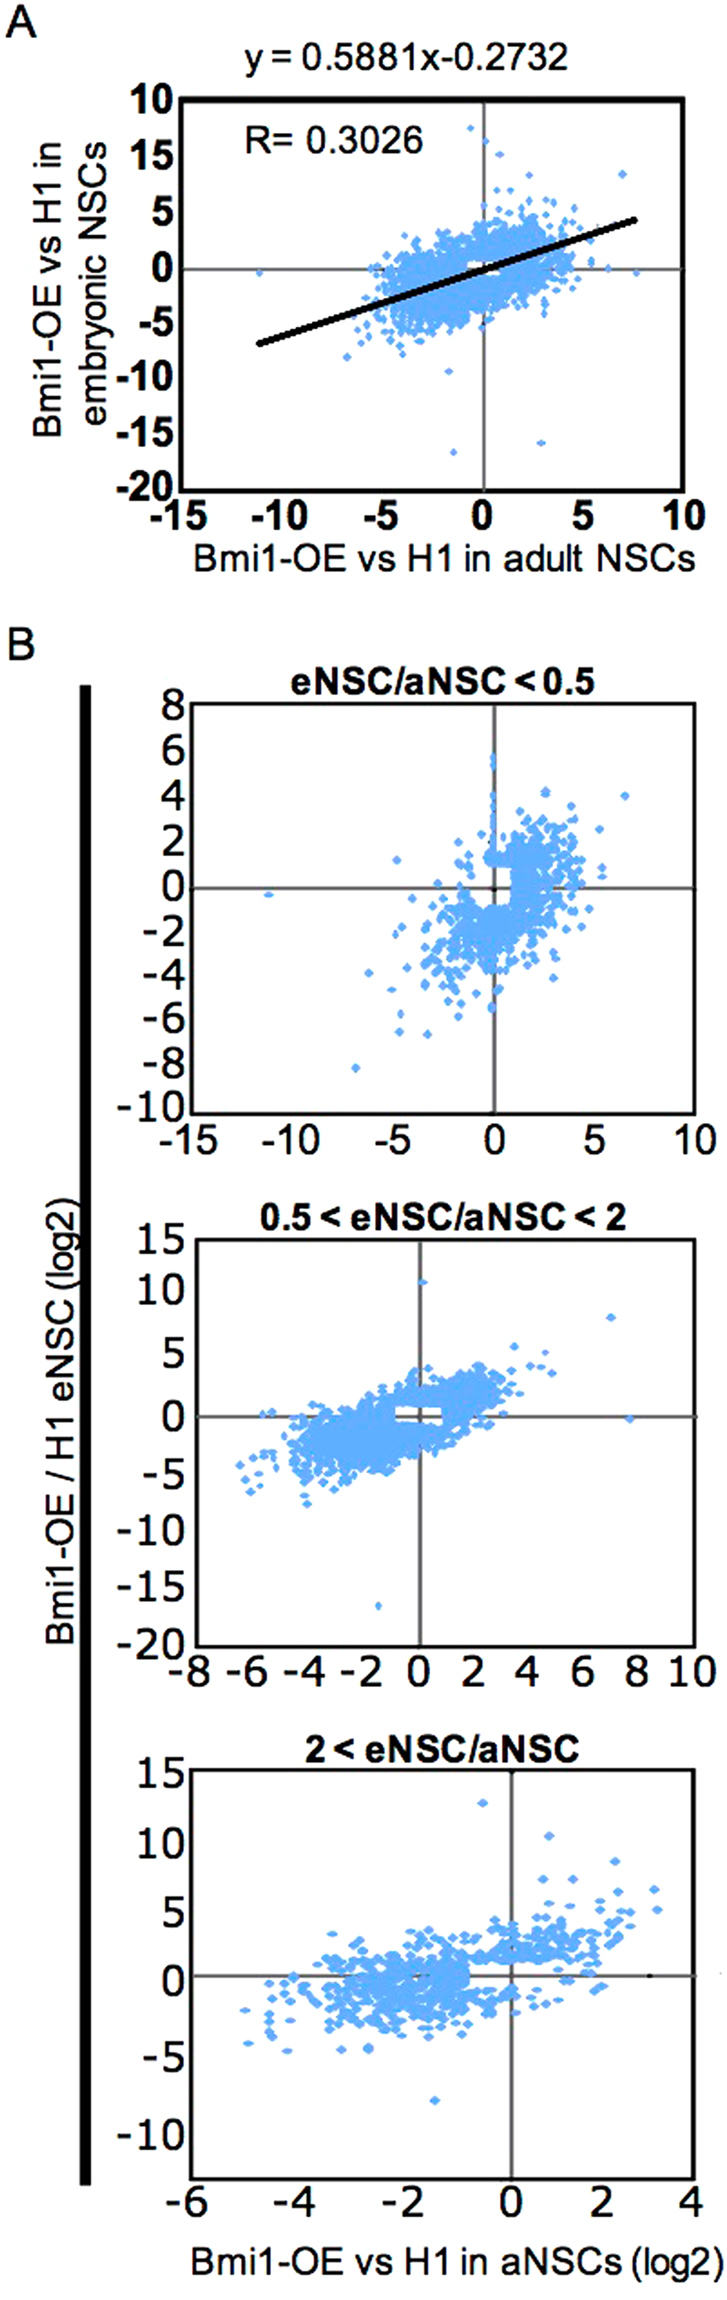
The ability of isolated neural stem cells (NSCs) to proliferate as neurospheres is indicative of their competence as stem cells, and depends critically on the polycomb group (PcG) member Bmi1: knockdown of Bmi1 results in defective proliferation and self-renewal of isolated NSCs, whereas overexpression of Bmi1 enhances these properties. Here we report genome-wide changes in gene expression in embryonic and adult NSCs (eNSCs and aNSCs) caused by overexpression of Bmi1. We find that genes whose expression is altered by perturbations in Bmi1 levels in NSCs are mostly distinct from those affected in other multipotent stem/progenitor cells, such as those from liver and lung, aside from a small core of common targets that is enriched for genes associated with cell migration and mobility. We also show that genes differing in expression between prospectively isolated quiescent and activated NSCs are not affected by Bmi1 overexpression. In contrast, a comparison of genes showing altered expression upon Bmi1 overexpression in eNSCs and in aNSCs reveals considerable overlap, in spite of their different provenances in the brain and their differing developmental programs.
Overview
The claims and statistics of this paper haven’t been checked yet.
Run the check — free, no account needed. It reads the open-access text and checks the sources it cites.
Integrity signals
Registry
Cites
Statistics
Figures
Verification
Claims the paper makes
The claims and statistics of this paper haven’t been checked yet.
Run the check — free, no account needed. It reads the open-access text and checks the sources it cites.
Claims other papers make about this one
Each is checked against this paper’s own text: does it say what the citing paper says it does?
The source backs part of the claim, not all of it — or backs it for a different population, condition or comparison.
In the citing paper
“Five of the miR-132 targets (BMI1, FOXO1, SPRY1, DPYSL3, CITED2) displaying the highest betweenness centrality, a proxy of network connectivity, have all shown to be involved in cell cycle, and more specifically, in neurogenesis [68–72] (Fig. 5D) (Supplementary Table 7).”
From microRNA-132 attenuates inflammation in induced pluripotent stem cell-derived microglia from Alzheimer’s disease patients (2026) · cites this paper as [68]
Experimental — accuracy not yet measuredThe cited source says what the claim attributes to it.
In the citing paper
“Five of the miR-132 targets (BMI1, FOXO1, SPRY1, DPYSL3, CITED2) displaying the highest betweenness centrality, a proxy of network connectivity, have all shown to be involved in cell cycle, and more specifically, in neurogenesis [68–72] (Fig. 5D) (Supplementary Table 7).”
From microRNA-132 attenuates inflammation in induced pluripotent stem cell-derived microglia from Alzheimer’s disease patients (2026) · cites this paper as [68]
The cited source says what the claim attributes to it.
In the citing paper
“Our data indicate that while there are common ‘core’ miR-132 targets across conditions, possibly involved in ‘housekeeping’ cellular functions, like cell cycle [68–72], there are also context-dependent targets, specific to healthy control or sAD iMGs.”
From microRNA-132 attenuates inflammation in induced pluripotent stem cell-derived microglia from Alzheimer’s disease patients (2026) · cites this paper as [68]
Self-check
Percentages, sums and reported differences re-computed from the paper’s own numbers.
The self-check needs the paper’s full text.
Citations
Cites
Codega, P., Silva-Vargas, V., Paul, A., Maldonado-Soto, A. R., DeLeo, A. M., Pastrana, E., & Doetsch, F. (2014) · Neuron · doi:10.1016/j.neuron.2014.02.039 · Cited by 634
Bhlhb5 and Prdm8 form a repressor complex involved in neuronal circuit assembly
Ross, S. E., McCord, A. E., Jung, C., Atan, D., Mok, S. I., Hemberg, M., Kim, T.-K., Salogiannis, J., Hu, L., Cohen, S., et al. (2012) · Neuron · doi:10.1016/j.neuron.2011.09.035 · Cited by 137
Research works printed but not linked: 44
- Qian, X. et al. Timing of CNS cell generation: a programmed sequence of neuron and glial cell production from isolated murine cortical stem cells. Neuron 28, 69–80, https://doi.S0896-6273(00)00086-6/ (2000). · DOI
- Shen, Q. et al. The timing of cortical neurogenesis is encoded within lineages of individual progenitor cells. Nat Neurosci 9, 743–751, https://doi.org/10.1038/nn1694 (2006). · DOI
- Ming, G. L. & Song, H. Adult neurogenesis in the mammalian brain: significant answers and significant questions. Neuron 70, 687–702, https://doi.org/10.1016/j.neuron.2011.05.001 (2011). · DOI · Paper page
- Reynolds, B. A., Tetzlaff, W. & Weiss, S. A multipotent EGF-responsive striatal embryonic progenitor cell produces neurons and astrocytes. J Neurosci 12, 4565–4574 (1992). · DOI
- Capela, A. & Temple, S. LeX/ssea-1 is expressed by adult mouse CNS stem cells, identifying them as nonependymal. Neuron 35, 865–875 (2002). · DOI
- Louis, S. A. et al. Enumeration of neural stem and progenitor cells in the neural colony-forming cell assay. Stem Cells 26, 988–996, https://doi.org/10.1634/stemcells.2007-0867 (2008). · DOI
- Reynolds, B. A. & Rietze, R. L. Neural stem cells and neurospheres–re-evaluating the relationship. Nat Methods 2, 333–336 (2005). · DOI
- Gage, F. H. & Temple, S. Neural stem cells: generating and regenerating the brain. Neuron 80, 588–601, https://doi.org/10.1016/j.neuron.2013.10.037 (2013). · DOI
- He, S. et al. Bmi-1 over-expression in neural stem/progenitor cells increases proliferation and neurogenesis in culture but has little effect on these functions in vivo. Dev Biol 328, 257–272, https://doi.org/10.1016/j.ydbio.2009.01.020 (2009). · DOI
- Molofsky, A. V. et al. Bmi-1 dependence distinguishes neural stem cell self-renewal from progenitor proliferation. Nature 425, 962–967 (2003). · DOI
- Yadirgi, G. et al. Conditional activation of Bmi1 expression regulates self-renewal, apoptosis, and differentiation of neural stem/progenitor cells in vitro and in vivo. Stem Cells 29, 700–712, https://doi.org/10.1002/stem.614 (2011). · DOI
- Sauvageau, M. & Sauvageau, G. Polycomb group proteins: multi-faceted regulators of somatic stem cells and cancer. Cell Stem Cell 7, 299–313, https://doi.org/10.1016/j.stem.2010.08.002 (2010). · DOI · Paper page
- Surface, L. E., Thornton, S. R. & Boyer, L. A. Polycomb group proteins set the stage for early lineage commitment. Cell Stem Cell 7, 288–298, https://doi.org/10.1016/j.stem.2010.08.004 (2010). · DOI
- Simon, J. A. & Kingston, R. E. Mechanisms of polycomb gene silencing: knowns and unknowns. Nat Rev Mol Cell Biol 10, 697–708, https://doi.org/10.1038/nrm2763 (2009). · DOI
- Biehs, B. et al. BMI1 represses Ink4a/Arf and Hox genes to regulate stem cells in the rodent incisor. Nat Cell Biol 15, 846–852, https://doi.org/10.1038/ncb2766 (2013). · DOI
- Oguro, H. et al. Poised lineage specification in multipotential hematopoietic stem and progenitor cells by the polycomb protein Bmi1. Cell Stem Cell 6, 279–286, https://doi.org/10.1016/j.stem.2010.01.005 (2010). · DOI
- Zacharek, S. J. et al. Lung stem cell self-renewal relies on BMI1-dependent control of expression at imprinted loci. Cell Stem Cell 9, 272–281, https://doi.org/10.1016/j.stem.2011.07.007 (2011). · DOI
- Bruggeman, S. W. et al. Ink4a and Arf differentially affect cell proliferation and neural stem cell self-renewal in Bmi1-deficient mice. Genes Dev 19, 1438–1443, https://doi.org/10.1101/gad.1299305 (2005). · DOI · Paper page
- Subkhankulova, T., Zhang, X., Leung, C. & Marino, S. Bmi1 directly represses p21Waf1/Cip1 in Shh-induced proliferation of cerebellar granule cell progenitors. Mol Cell Neurosci 45, 151–162, https://doi.org/10.1016/j.mcn.2010.06.006 (2010). · DOI
- Ihrie, R. A. & Alvarez-Buylla, A. Lake-front property: a unique germinal niche by the lateral ventricles of the adult brain. Neuron 70, 674–686, https://doi.org/10.1016/j.neuron.2011.05.004 (2011). · DOI
- Kriegstein, A. & Alvarez-Buylla, A. The glial nature of embryonic and adult neural stem cells. Annu Rev Neurosci 32, 149–184, https://doi.org/10.1146/annurev.neuro.051508.135600 (2009). · DOI · Paper page
- Liu, T. et al. Cistrome: an integrative platform for transcriptional regulation studies. Genome Biol 12, R83, https://doi.org/10.1186/gb-2011-12-8-r83 (2011). · DOI
- Kole, A. J., Swahari, V., Hammond, S. M. & Deshmukh, M. miR-29b is activated during neuronal maturation and targets BH3-only genes to restrict apoptosis. Genes Dev 25, 125–130, https://doi.org/10.1101/gad.1975411 (2011). · DOI
- Acquati, S. et al. Epigenetic regulation of survivin by Bmi1 is cell type specific during corticogenesis and in gliomas. Stem Cells 31, 190–202, https://doi.org/10.1002/stem.1274 (2013). · DOI
- Lopez-Juarez, A. et al. Gsx2 controls region-specific activation of neural stem cells and injury-induced neurogenesis in the adult subventricular zone. Genes Dev 27, 1272–1287, https://doi.org/10.1101/gad.217539.113 (2013). · DOI
- Eom, G. H. et al. Histone methyltransferase PRDM8 regulates mouse testis steroidogenesis. Biochem Biophys Res Commun 388, 131–136, https://doi.org/10.1016/j.bbrc.2009.07.134 (2009). · DOI
- Inoue, M. et al. Prdm8 regulates the morphological transition at multipolar phase during neocortical development. PLoS One 9, e86356, https://doi.org/10.1371/journal.pone.0086356PONE-D-13-36585/ (2014). · DOI · Paper page
- Inoue, M. et al. Deletion of Prdm8 impairs development of upper-layer neocortical neurons. Genes Cells 20, 758–770, https://doi.org/10.1111/gtc.12274 (2015). · DOI
- Jung, C. C. et al. Transcription factor PRDM8 is required for rod bipolar and type 2 OFF-cone bipolar cell survival and amacrine subtype identity. Proc Natl Acad Sci USA 112, E3010–3019, https://doi.org/10.1073/pnas.1505870112 (2015). · DOI
- Cheloufi, S. et al. The histone chaperone CAF-1 safeguards somatic cell identity. Nature 528, 218–224, https://doi.org/10.1038/nature15749 (2015). · DOI
- Chiba, T. et al. Bmi1 promotes hepatic stem cell expansion and tumorigenicity in both Ink4a/Arf-dependent and -independent manners in mice. Hepatology 52, 1111–1123, https://doi.org/10.1002/hep.23793 (2010). · DOI
- Gonzales-Roybal, G. & Lim, D. A. Chromatin-based epigenetics of adult subventricular zone neural stem cells. Front Genet 4, 194, https://doi.org/10.3389/fgene.2013.00194 (2013). · DOI
- Breunig, J. J., Haydar, T. F. & Rakic, P. Neural stem cells: historical perspective and future prospects. Neuron 70, 614–625, https://doi.org/10.1016/j.neuron.2011.05.005 (2011). · DOI
- Goecks, J., Nekrutenko, A. & Taylor, J. Galaxy: a comprehensive approach for supporting accessible, reproducible, and transparent computational research in the life sciences. Genome Biol 11, R86, https://doi.org/10.1186/gb-2010-11-8-r86 (2010). · DOI
- Wang, X., Bryant, G., Zhao, A. & Ptashne, M. Nucleosome avidities and transcriptional silencing in yeast. Curr Biol 25, 1215–1220, https://doi.org/10.1016/j.cub.2015.03.004 (2015). · DOI
- Lois, C., Hong, E. J., Pease, S., Brown, E. J. & Baltimore, D. Germline transmission and tissue-specific expression of transgenes delivered by lentiviral vectors. Science 295, 868–872, https://doi.org/10.1126/science.1067081 (2002). · DOI
- Kusek, G. et al. Asymmetric segregation of the double-stranded RNA binding protein Staufen2 during mammalian neural stem cell divisions promotes lineage progression. Cell Stem Cell 11, 505–516, https://doi.org/10.1016/j.stem.2012.06.006 (2012). · DOI
- Ivanova, N. et al. Dissecting self-renewal in stem cells with RNA interference. Nature 442, 533–538, https://doi.org/10.1038/nature04915 (2006). · DOI
- Carpenter, A. E. et al. CellProfiler: image analysis software for identifying and quantifying cell phenotypes. Genome Biol 7, R100, https://doi.org/10.1186/gb-2006-7-10-r100 (2006). · DOI
- Storey, J. D. & Tibshirani, R. Statistical significance for genomewide studies. Proc Natl Acad Sci USA 100, 9440–9445 (2003). · DOI · Paper page
- Trapnell, C. et al. Transcript assembly and quantification by RNA-Seq reveals unannotated transcripts and isoform switching during cell differentiation. Nat Biotechnol 28, 511–515, https://doi.org/10.1038/nbt.1621 (2010). · DOI · Paper page
- Eisen, M. B., Spellman, P. T., Brown, P. O. & Botstein, D. Cluster analysis and display of genome-wide expression patterns. Proc Natl Acad Sci USA 95, 14863–14868 (1998). · DOI · Paper page
- Boyle, E. I. et al. GO::TermFinder–open source software for accessing Gene Ontology information and finding significantly enriched Gene Ontology terms associated with a list of genes. Bioinformatics 20, 3710–3715, https://doi.org/10.1093/bioinformatics/bth456bth456/ (2004). · DOI · Paper page
- Hirabayashi, Y. et al. Polycomb limits the neurogenic competence of neural precursor cells to promote astrogenic fate transition. Neuron 63, 600–613, https://doi.org/10.1016/j.neuron.2009.08.021 (2009). · DOI
Cited by
Sorted by citations
Penning, A., Snoeck, S., Ormaechea, O. R., Ayyildiz, D., Polzer, O., Buitrago-Arango, M., Capobianco, R., de Winter, F., Balusu, S., Verhaagen, J., et al. (2026) · Acta Neuropathologica Communications · doi:10.1186/s40478-026-02228-8 · Cited by 6
Metadata
- Authors
- Ganapathi, M., Boles, N. C., Charniga, C., Lotz, S., Campbell, M., Temple, S., & Morse, R. H.
- ORCID
- Morse, Randall H.
- Venue
- Scientific Reports
- Published
- 2018-05-10
- Volume
- 8
- Issue
- 1
- ISSN
- 2045-2322
- PMC
- PMC5945652
- Cited by
- 24
- References
- 2
- Language
- en
About these checks
Registry, retraction, Cites and statistics results are computed, not judged, with one exception: a printed reference that no index lists is read once by a model before it counts as a citation error. Claims are extracted by a model and kept only when their quote appears verbatim in the text; each cited source is then checked, with a model’s help, for whether it says what the claim relies on. Those verdicts can be wrong — read the claim’s quote and the cited source before relying on one.
Statistics and arithmetic are recomputed, not judged.
Confidence bands are shown only for fields calibrated on our annotated test set. None is calibrated yet, so no band is shown.
What counts as a claim ›How we measure confidence ›How we check this ›
Are you an author, or do you see a problem with this page? Request a review
