

The DOI matches its Crossref record; 6 of the 6 references it cites were found in a registry or an index.
A transgenic inducible GFP extracellular-vesicle reporter (TIGER) mouse illuminates neonatal cortical astrocytes as a source of immunomodulatory extracellular vesicles
Abstract
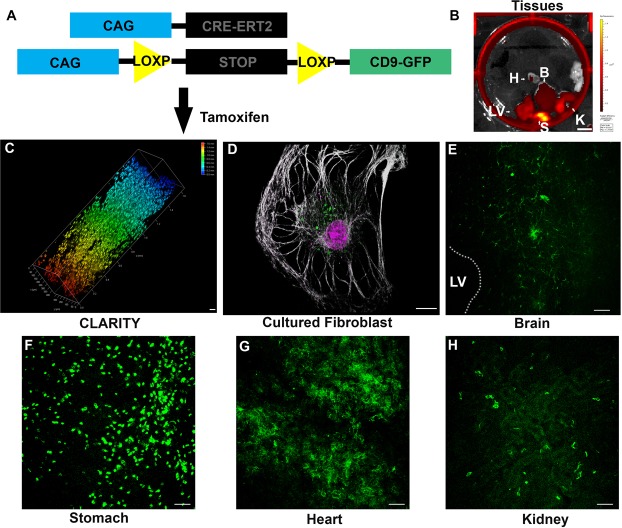
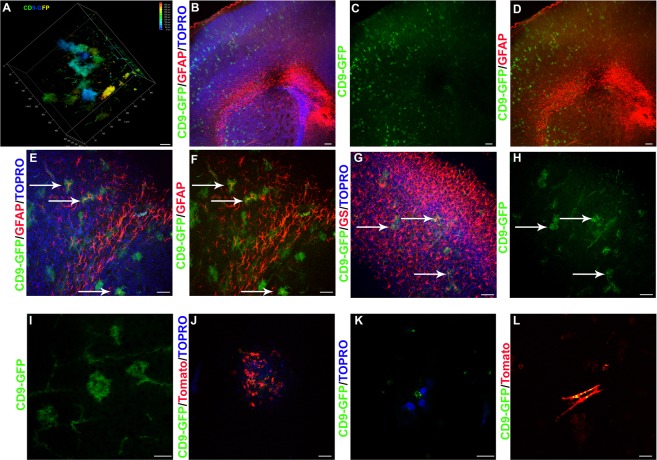
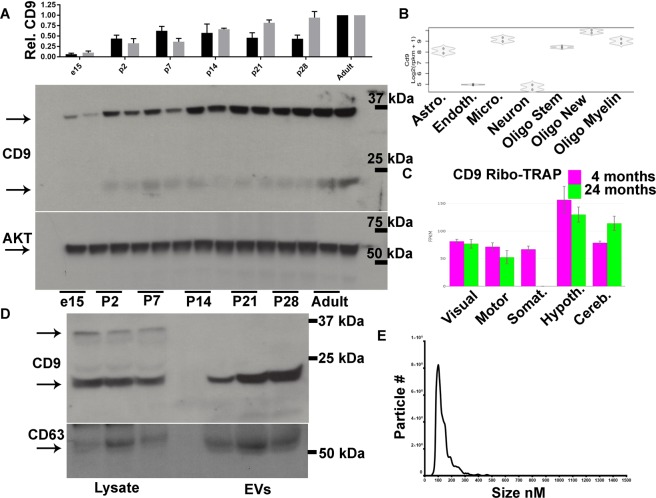
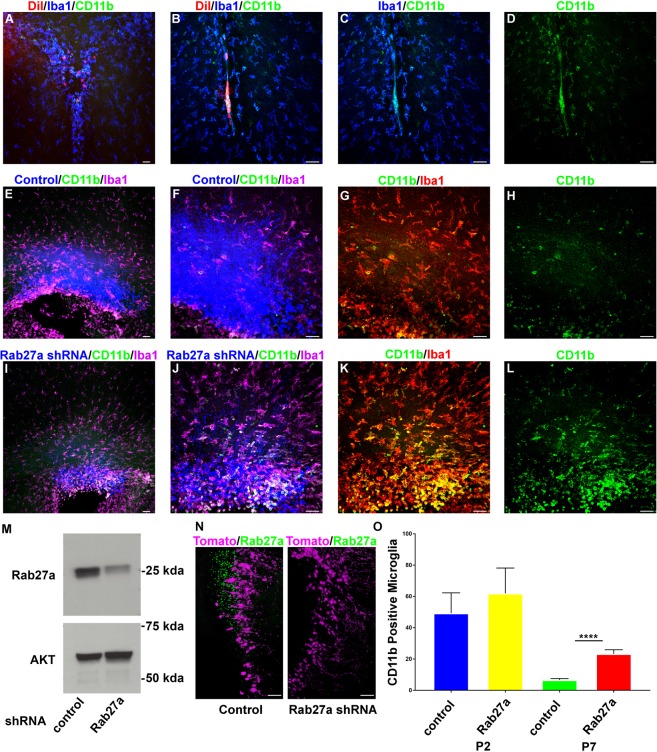
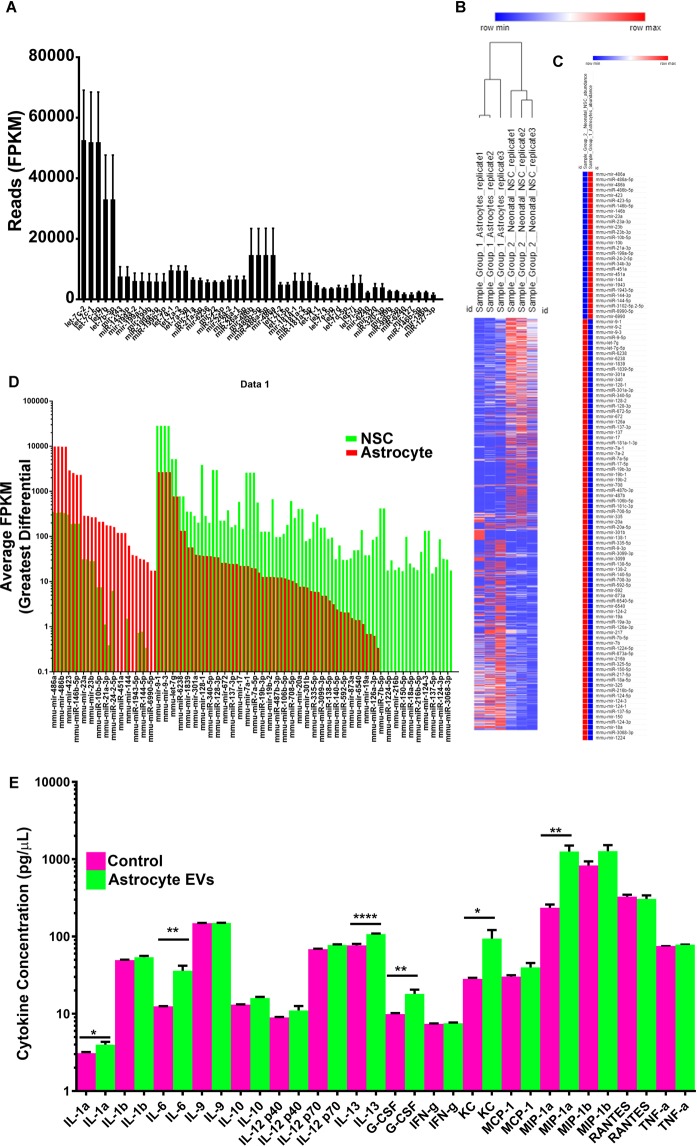
Extracellular vesicles (EVs) are cellular derived particles found throughout the body in nearly all tissues and bodily fluids. EVs contain biological molecules including small RNAs and protein. EVs are proposed to be transferred between cells, notably, cells of the immune system. Tools that allow for in vivo EV labeling while retaining the ability to resolve cellular sources and timing of release are required for a full understanding of EV functions. Fluorescent EV fusion proteins are useful for the study of EV biogenesis, release, and identification of EV cellular recipients. Among the most plentiful and frequently identified EV proteins is CD9, a tetraspanin protein. A transgenic mouse containing a CRE-recombinase inducible CAG promoter driven CD9 protein fused to Turbo-GFP derived from the copepod Pontellina plumata was generated as an EV reporter. The transgenic inducible GFP EV reporter (TIGER) mouse was electroporated with CAG-CRE plasmids or crossed with tamoxifen inducible CAG-CRE-ER T2 or nestin-CRE-ER T2 mice. CD9-GFP labeled cells included glutamine synthetase and glial fibrillary acidic protein positive astrocytes. Cortical astrocytes released ~136 nm EVs that contained CD9. Intraventricular injected EVs were taken up by CD11b/IBA1 positive microglia surrounding the lateral ventricles. Neonatal electroporation and shRNA mediated knockdown of Rab27a in dorsal subventricular zone NSCs and astrocytes increased the number of CD11b/IBA1 positive rounded microglia. Neonatal astrocyte EVs had a unique small RNA signature comprised of morphogenic miRNAs that induce microglia cytokine release. The results from this study demonstrate that inducible CD9-GFP mice will provide the EV community with a tool that allows for EV labeling in a cell-type specific manner while simultaneously allowing in vivo experimentation and provides evidence that EVs are required immunomodulators of the developing nervous system.
Overview
The claims and statistics of this paper haven’t been checked yet.
Run the check — free, no account needed. It reads the open-access text and checks the sources it cites.
Integrity signals
Registry
Cites
Statistics
Figures
Verification
Claims the paper makes
The claims and statistics of this paper haven’t been checked yet.
Run the check — free, no account needed. It reads the open-access text and checks the sources it cites.
Claims other papers make about this one
Each is checked against this paper’s own text: does it say what the citing paper says it does?
In the citing paper
“Thus, identifying miRNAs that are exclusively expressed in sEVs from distinct donor cells may enable us to define the cellular origin of the circulating sEVs [50, 51].”
From Differential RNA packaging into small extracellular vesicles by neurons and astrocytes (2021) · cites this paper as [51]
Self-check
Percentages, sums and reported differences re-computed from the paper’s own numbers.
The self-check needs the paper’s full text.
Citations
Cites
Kowal, J., Arras, G., Colombo, M., Jouve, M., Morath, J. P., Primdal-Bengtson, B., Dingli, F., Loew, D., Tkach, M., & Théry, C. (2016) · Proceedings of the National Academy of Sciences · doi:10.1073/pnas.1521230113 · Cited by 3,426
Friedman, B. A., Srinivasan, K., Ayalon, G., Meilandt, W. J., Lin, H., Huntley, M. A., Cao, Y., Lee, S.-H., Haddick, P. C. G., Ngu, H., et al. (2018) · Cell Reports · doi:10.1016/j.celrep.2017.12.066 · Cited by 662
Immune evasion mediated by PD-L1 on glioblastoma-derived extracellular vesicles
Ricklefs, F. L., Alayo, Q., Krenzlin, H., Mahmoud, A. B., Speranza, M. C., Nakashima, H., Hayes, J. L., Lee, K., Balaj, L., Passaro, C., et al. (2018) · Science Advances · doi:10.1126/sciadv.aar2766 · Cited by 610
Local generation of glia is a major astrocyte source in postnatal cortex
Ge, W.-P., Miyawaki, A., Gage, F. H., Jan, Y. N., & Jan, L. Y. (2012) · Nature · doi:10.1038/nature10959 · Cited by 507
Dickens, A. M., Tovar-y-Romo, L. B., Yoo, S.-W., Trout, A. L., Bae, M., Kanmogne, M., Megra, B., Williams, D. W., Witwer, K. W., Gacias, M., et al. (2017) · Science Signaling · doi:10.1126/scisignal.aai7696 · Cited by 285
Newborn cortical neurons: only for neonates?
Feliciano, D. M., & Bordey, A. (2013) · Trends in Neurosciences · doi:10.1016/j.tins.2012.09.004 · Cited by 51
Self-citation
Research works printed but not linked: 28
- Morton, M. C. & Feliciano, D. M. Neurovesicles in Brain Development. Cell. Mol. Neurobiol. 36 (2016). · DOI
- Feliciano, D. M., Zhang, S., Nasrallah, C. M., Lisgo, S. N. & Bordey, A. Embryonic cerebrospinal fluid nanovesicles carry evolutionarily conserved molecules and promote neural stem cell amplification. PLoS One 9 (2014). · DOI
- Tietje, A., Maron, K. N., Wei, Y. & Feliciano, D. M. Cerebrospinal fluid extracellular vesicles undergo age dependent declines and contain known and novel non-coding RNAs. PLoS One 9 (2014). · DOI
- Morton, M. C., Neckles, V. N., Seluzicki, C. M., Holmberg, J. C. & Feliciano, D. M. Neonatal Subventricular Zone Neural Stem Cells Release Extracellular Vesicles that Act as a Microglial Morphogen. Cell Rep., https://doi.org/10.1016/j.celrep.2018.03.037 (2018). · DOI · Paper page
- Morton, M. C., Neckles, V. N. & Feliciano, D. M. P. D. Isolation of Extracellular Vesicles from Subventricular Zone NeuralStem Cells. Methods Mol. Biol. STEM CELL (2018). · DOI
- Sanai, N. et al. Corridors of migrating neurons in the human brain and their decline during infancy. Nature 478, 382–386 (2011). · DOI · Paper page
- Shigemoto-Mogami, Y., Hoshikawa, K., Goldman, J. E., Sekino, Y. & Sato, K. Microglia Enhance Neurogenesis and Oligodendrogenesis in the Early Postnatal Subventricular Zone. J. Neurosci. 34, 2231–2243 (2014). · DOI
- Cunningham, C. L., Martínez-Cerdeño, V. & Noctor, S. C. Microglia regulate the number of neural precursor cells in the developing cerebral cortex. J. Neurosci. 33, 4216–33 (2013). · DOI · Paper page
- Barger, N. et al. Microglia: An Intrinsic Component of the Proliferative Zones in the Fetal Rhesus Monkey (Macaca mulatta) Cerebral Cortex. Cereb. Cortex, https://doi.org/10.1093/cercor/bhy145 (2018). · DOI
- Monier, A. et al. Entry and Distribution of Microglial Cells in Human Embryonic and Fetal Cerebral Cortex. J. Neuropathol. Exp. Neurol. 66, 372–382 (2007). · DOI · Paper page
- Wang, D. D. & Bordey, A. The astrocyte odyssey. Progress in Neurobiology 86, 342–367 (2008).
- Magnusson, J. P. & Frisen, J. Stars from the darkest night: unlocking the neurogenic potential of astrocytes in different brain regions. Development 143, 1075–1086 (2016). · DOI
- Niu, W. et al. SOX2 reprograms resident astrocytes into neural progenitors in the adult brain. Stem Cell Reports 4, 780–794 (2015). · DOI
- Feliciano, D. M., Lafourcade, C. A. & Bordey, A. Neonatal subventricular zone electroporation. J. Vis. Exp (2013). · DOI
- Nagy, A., Gertsenstein, M., Vintersten, K. & Behringer, R. Manipulating the Mouse Embryo. Cold Spring Harbor, NY: Cold Spring Harbor Laboratory Press (2003).
- Hayashi, S. & McMahon, A. P. Efficient recombination in diverse tissues by a tamoxifen-inducible form of Cre: A tool for temporally regulated gene activation/inactivation in the mouse. Dev. Biol. 244, 305–318 (2002). · DOI
- Lagace, D. C. et al. Dynamic Contribution of Nestin-Expressing Stem Cells to Adult Neurogenesis. J. Neurosci. 27, 12623–12629 (2007). · DOI · Paper page
- Boisvert, M. M., Erikson, G. A., Shokhirev, M. N. & Allen, N. J. The Aging Astrocyte Transcriptome from Multiple Regions of the Mouse Brain. Cell Rep. 22, 269–285 (2018). · DOI · Paper page
- Wubbolts, R. et al. Proteomic and biochemical analyses of human B cell-derived exosomes: Potential implications for their function and multivesicular body formation. J. Biol. Chem. 278, 10963–10972 (2003). · DOI
- Théry, C. et al. Molecular characterization of dendritic cell-derived exosomes: Selective accumulation of the heat shock protein hsc73. J. Cell Biol. 147, 599–610 (1999). · DOI
- Escola, J. M. et al. Selective enrichment of tetraspan proteins on the internal vesicles of multivesicular endosomes and on exosomes secreted by human B-lymphocytes. J. Biol. Chem. 273, 20121–20127 (1998). · DOI · Paper page
- Raposo, G. & Stoorvogel, W. Extracellular vesicles: Exosomes, microvesicles, and friends. Journal of Cell Biology 200, 373–383 (2013). · DOI · Paper page
- Panáková, D., Sprong, H., Marois, E., Thiele, C. & Eaton, S. Lipoprotein particles are required for Hedgehog and Wingless signalling. Nature 435, 58–65 (2005). · DOI
- Gross, J. C., Chaudhary, V., Bartscherer, K. & Boutros, M. Active Wnt proteins are secreted on exosomes. Nat. Cell Biol. 14, 1036–1045 (2012). · DOI
- Mittelbrunn, M. et al. Unidirectional transfer of microRNA-loaded exosomes from T cells to antigen-presenting cells. Nat. Commun. 2 (2011). · DOI
- Yoshimura, A. et al. Generation of a novel transgenic rat model for tracing extracellular vesicles in body fluids. Sci. Rep. 6 (2016). · DOI
- Yoshimura, A. et al. The Sox2 promoter-driven CD63-GFP transgenic rat model allows tracking of neural stem cell-derived extracellular vesicles. Dis. Model. Mech. 11, dmm028779 (2018). · DOI
- Haderk, F. et al. Tumor-derived exosomes modulate PD-L1 expression in monocytes. Sci. Immunol. 2, eaah5509 (2017). · DOI
Cited by
Sorted by citations
Astrocyte-derived extracellular vesicles: A double-edged sword in central nervous system disorders
Zhao, S., Sheng, S., Wang, Y., Ding, L., Xu, X., Xia, X., & Zheng, J. C. (2021) · Neuroscience & Biobehavioral Reviews · doi:10.1016/j.neubiorev.2021.02.027 · Cited by 90
Differential RNA packaging into small extracellular vesicles by neurons and astrocytes
Luo, X., Jean-Toussaint, R., Sacan, A., & Ajit, S. K. (2021) · Cell Communication and Signaling · doi:10.1186/s12964-021-00757-4 · Cited by 32
Metadata
- Authors
- Neckles, V. N., Morton, M. C., Holmberg, J. C., Sokolov, A. M., Nottoli, T., Liu, D., & Feliciano, D. M.
- Venue
- Scientific Reports
- Published
- 2019-02-28
- Volume
- 9
- Issue
- 1
- ISSN
- 2045-2322
- PMC
- PMC6395689
- Cited by
- 55
- References
- 6
- Language
- en
About these checks
Registry, retraction, Cites and statistics results are computed, not judged, with one exception: a printed reference that no index lists is read once by a model before it counts as a citation error. Claims are extracted by a model and kept only when their quote appears verbatim in the text; each cited source is then checked, with a model’s help, for whether it says what the claim relies on. Those verdicts can be wrong — read the claim’s quote and the cited source before relying on one.
Statistics and arithmetic are recomputed, not judged.
Confidence bands are shown only for fields calibrated on our annotated test set. None is calibrated yet, so no band is shown.
What counts as a claim ›How we measure confidence ›How we check this ›
Are you an author, or do you see a problem with this page? Request a review
