

The DOI matches its Crossref record; 3 of the 3 references it cites were found in a registry or an index.
RORγt+ Treg to Th17 ratios correlate with susceptibility to Giardia infection
Abstract
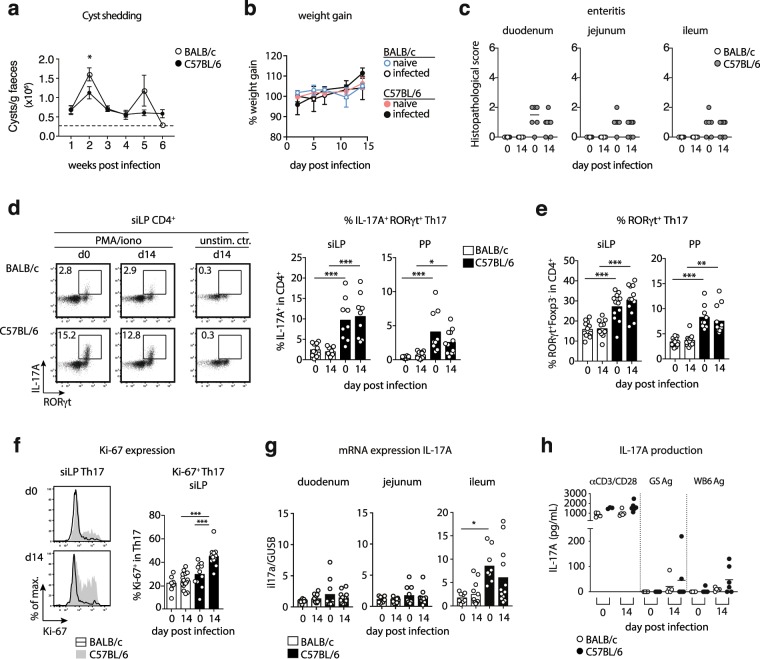
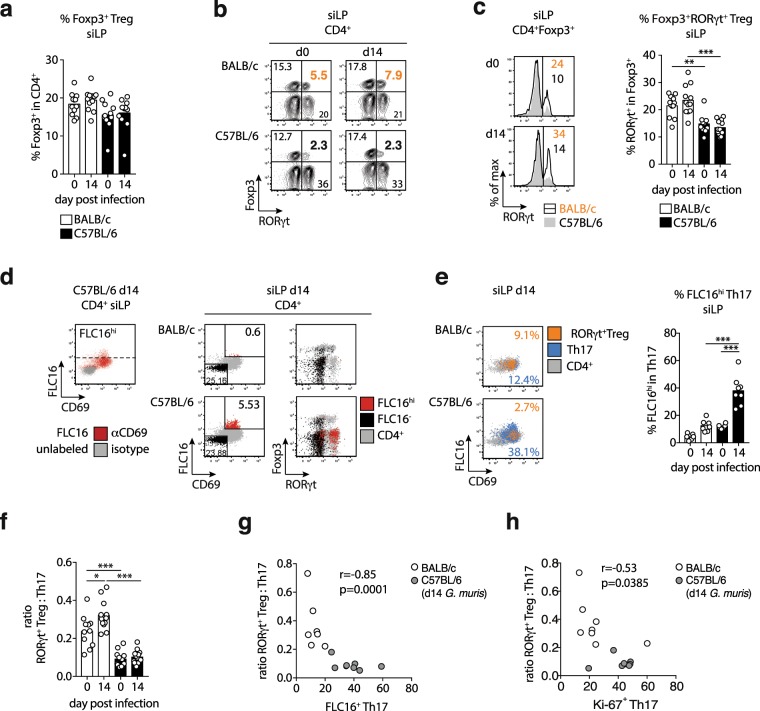
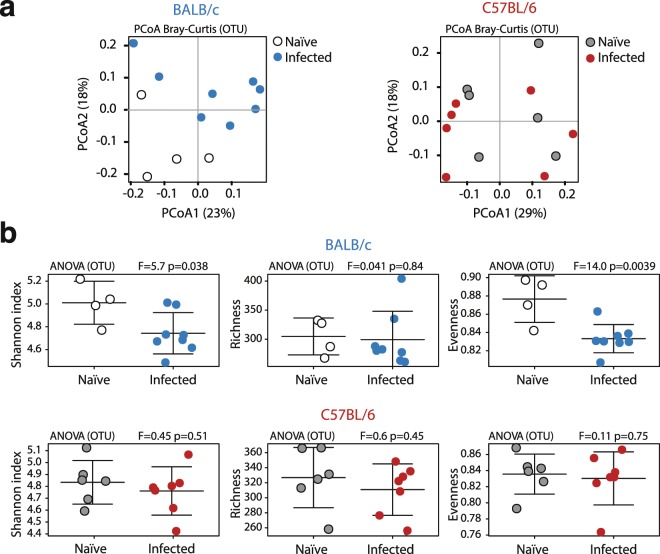
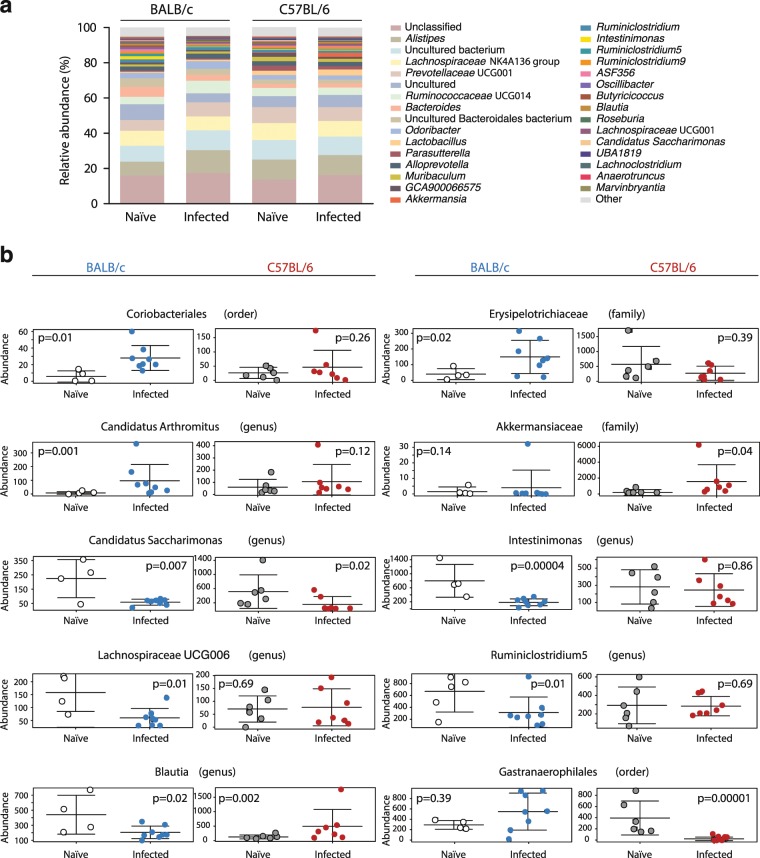
Infections with Giardia are among the most common causes of food and water-borne diarrheal disease worldwide. Here, we investigated Th17, Treg and IgA responses, and alterations in gut microbiota in two mouse lines with varying susceptibility to Giardia muris infection. Infected BALB/c mice shed significantly more cysts compared with C57BL/6 mice. Impaired control of infection in BALB/c mice was associated with lower Th17 activity and lower IgA levels compared with C57BL/6 mice. The limited metabolic activity, proliferation and cytokine production of Th17 cells in BALB/c mice was associated with higher proportions of intestinal Foxp3 + RORγt + regulatory T cells and BALB/c mice developed increased RORγt + Treg:Th17 ratios in response to G. muris infection. Furthermore, G. muris colonization led to a significantly reduced evenness in the gut microbial communities of BALB/c mice. Our data indicate that differential susceptibility to Giardia infections may be related to RORγt + Treg controlling Th17 activity and that changes in the microbiota composition upon Giardia infection partially depend on the host background.
Overview
The claims and statistics of this paper haven’t been checked yet.
Run the check — free, no account needed. It reads the open-access text and checks the sources it cites.
Integrity signals
Registry
Cites
Statistics
Figures
Verification
Claims the paper makes
The claims and statistics of this paper haven’t been checked yet.
Run the check — free, no account needed. It reads the open-access text and checks the sources it cites.
Claims other papers make about this one
Each is checked against this paper’s own text: does it say what the citing paper says it does?
In the citing paper
“Reduced regulatory T-cell activity, insufficient Th17-related responses, and altered sIgA production may increase susceptibility to G. intestinalis infection and contribute to persistent gastrointestinal inflammation (Aboulhoda et al. 2024; Singer et al. 2019; Yordanova et al. 2019; Zhao et al. 2023).”
From Parasites and allergies: a complex bidirectional relationship from evolutionary origins to modern therapeutics (2026) · cites this paper as Yordanova et al. 2019
Self-check
Percentages, sums and reported differences re-computed from the paper’s own numbers.
The self-check needs the paper’s full text.
Citations
Cites
Individual intestinal symbionts induce a distinct population of RORγ + regulatory T cells
Sefik, E., Geva-Zatorsky, N., Oh, S., Konnikova, L., Zemmour, D., McGuire, A. M., Burzyn, D., Ortiz-Lopez, A., Lobera, M., Yang, J., et al. (2015) · Science · doi:10.1126/science.aaa9420 · Cited by 879
The microbiota regulates type 2 immunity through RORγt + T cells
Ohnmacht, C., Park, J.-H., Cording, S., Wing, J. B., Atarashi, K., Obata, Y., Gaboriau-Routhiau, V., Marques, R., Dulauroy, S., Fedoseeva, M., et al. (2015) · Science · doi:10.1126/science.aac4263 · Cited by 863
c-MAF-dependent regulatory T cells mediate immunological tolerance to a gut pathobiont
Xu, M., Pokrovskii, M., Ding, Y., Yi, R., Au, C., Harrison, O. J., Galan, C., Belkaid, Y., Bonneau, R., & Littman, D. R. (2018) · Nature · doi:10.1038/nature25500 · Cited by 498
Research works printed but not linked: 63
- Torgerson, P. R. et al. World Health Organization estimates of the global and regional disease burden of 11 foodborne parasitic diseases, 2010: a data synthesis. PLoS Med. 12, e1001920; https://doi.org/10.1371/journal.pmed.1001920 (2015). · DOI
- Efstratiou, A., Ongerth, J. E. & Karanis, P. Waterborne transmission of protozoan parasites: Review of worldwide outbreaks - An update 2011-2016. Water Res. 114, 14–22, https://doi.org/10.1016/j.watres.2017.01.036 (2017). · DOI
- Lanata, C. F. et al. Global causes of diarrheal disease mortality in children <5 years of age: a systematic review. PloS ONE 8, e72788, https://doi.org/10.1371/journal.pone.0072788 (2013). · DOI
- Barash, N. R. et al. Giardia Colonizes and Encysts in High-Density Foci in the Murine Small Intestine. mSphere 2, e00343–16, https://doi.org/10.1128/mSphere.00343-16 (2017). · DOI
- Einarsson, E., Ma’aye, S. & Svärd, S. G. An up-date on Giardia and giardiasis. Curr. Opin. Microbiol. 34, 47–52, https://doi.org/10.1016/j.mib.2016.07.019 (2016). · DOI
- Cotton, J. A., Beatty, J. K. & Buret, A. G. Host parasite interactions and pathophysiology in Giardia infections. Int. J. Parasitol. 41, 925–933, https://doi.org/10.1016/j.ijpara.2011.05.002 (2011). · DOI
- Kohli, A. et al. Giardia duodenalis assemblage, clinical presentation and markers of intestinal inflammation in Brazilian children. Trans. R. Soc. Trop. Med. Hyg. 102, 718–725, https://doi.org/10.1016/j.trstmh.2008.03.002 (2008). · DOI
- Coklin, T. et al. Temporal changes in the prevalence and shedding patterns of Giardia duodenalis cysts and Cryptosporidium spp. oocysts in a herd of dairy calves in Ontario. Can. Vet. J. 51, 841–846 (2010).
- Ebert, E. C. Giardia induces proliferation and interferon gamma production by intestinal lymphocytes. Gut 44, 342–346 (1999). · DOI
- Saghaug, C. S. et al. Human Memory CD4+ T Cell Immune Responses against Giardia lamblia. Clin. Vaccine Immunol. 23, 11–18, https://doi.org/10.1128/CVI.00419-15 (2015). · DOI
- Dann, S. M. et al. IL-17A promotes protective IgA responses and expression of other potential effectors against the lumen-dwelling enteric parasite Giardia. Exp. Parasitol. 156, 68–78, https://doi.org/10.1016/j.exppara.2015.06.003 (2015). · DOI
- Dreesen, L. et al. Giardia muris infection in mice is associated with a protective interleukin 17A response and induction of peroxisome proliferator-activated receptor alpha. Infect. Immun. 82, 3333–3340, https://doi.org/10.1128/IAI.01536-14 (2014). · DOI
- Paerewijck, O. et al. Interleukin-17 receptor A (IL-17RA) as a central regulator of the protective immune response against Giardia. Sci. Rep. 7, 8520, https://doi.org/10.1038/s41598-017-08590-x (2017). · DOI
- Cao, A. T., Yao, S., Elson, C. O. & Cong, Y. Th17 cells upregulate polymeric Ig receptor and intestinal IgA and contribute to intestinal homeostasis. J. Immunol. 189, 4666–4673, https://doi.org/10.4049/jimmunol.1200955 (2012). · DOI
- Langford, T. D. et al. Central importance of Immunoglobulin A in host defense against Giardia spp. Infect. Immun. 70, 11–18 (2002). · DOI
- Davids, B. J. et al. Polymeric immunoglobulin receptor in intestinal immune defense against the lumen-dwelling protozoan parasite Giardia. J. Immunol. 177, 6281–6290 (2006). · DOI
- Shevach, E. M. Foxp3+ T Regulatory Cells: Still Many Unanswered Questions—A Perspective After 20 Years of Study. Front. Immunol. 9, 1048, https://doi.org/10.3389/fimmu.2018.01048 (2018). · DOI
- Koch, M. A. et al. The transcription factor T-bet controls regulatory T cell homeostasis and function during type 1 inflammation. Nat. Immunol. 10, 595–602, https://doi.org/10.1038/ni.1731 (2009). · DOI · Paper page
- Wang, Y., Su, M. A. & Wan, Y. Y. An essential role of the transcription factor GATA-3 for the function of regulatory T cells. Immunity 35, 337–348, https://doi.org/10.1016/j.immuni.2011.08.012 (2011). · DOI · Paper page
- Luu, M., Steinhoff, U. & Visekruna, A. A. functional heterogeneity of gut-resident regulatory T cells. Clin. Transl. Immunol. 6, e156, https://doi.org/10.1038/cti.2017.39 (2017). · DOI
- Omenetti, S. & Pizarro, T. T. The Treg/Th17 axis: A dynamic balance regulated by the gut microbiome. Front. Immunol. 6, 639, https://doi.org/10.3389/fimmu.2015.00639 (2015). · DOI
- Neumann, C. et al. c-Maf-dependent Treg cell control of intestinal Th17 cells and IgA establishes host–microbiota homeostasis. Nat. Immunol. 20, 471–481, https://doi.org/10.1038/s41590-019-0316-2 (2019). · DOI
- Yang, B.-H. et al. Foxp3+ T cells expressing RORγt represent a stable regulatory T-cell effector lineage with enhanced suppressive capacity during intestinal inflammation. Mucosal Immunol. 9, 444–457, https://doi.org/10.1038/mi.2015.74 (2016). · DOI
- Deenick, E. K., Hasbold, J. & Hodgkin, P. D. Switching to IgG3, IgG2b, and IgA is division linked and independent, revealing a stochastic framework for describing differentiation. J. Immunol. 163, 4707–4714 (1999). · DOI
- Coffman, R. L., Lebman, D. A. & Shrader, B. Transforming growth factor beta specifically enhances IgA production by lipopolysaccharide-stimulated murine B lymphocytes. J. Exp. Med. 170, 1039–1044 (1989). · DOI
- Pandiyan, P. et al. Microbiome dependent regulation of Tregs and Th17 cells in mucosa. Front. Immunol. 10, 426, https://doi.org/10.3389/fimmu.2019.00426 (2019). · DOI
- Nakajima, A. et al. IgA regulates the composition and metabolic function of gut microbiota by promoting symbiosis between bacteria. J. Exp. Med. 215, 2019–2034, https://doi.org/10.1084/jem.20180427 (2018). · DOI
- Belosevic, M., Faubert, G. M., Skamene, E. & MacLean, J. D. Susceptibility and resistance of inbred mice to Giardia muris. Infect. Immun. 44, 282–286 (1984). · DOI
- Li, E., Zhou, P., Petrin, Z. & Singer, S. M. Mast cell-dependent control of Giardia lamblia infections in mice. Infect. Immun. 72, 6642–6649, https://doi.org/10.1128/IAI.72.11.6642-6649.2004 (2004). · DOI
- Oberhuber, G., Kastner, N. & Stolte, M. Giardiasis: a histologic analysis of 567 cases. Scand. J. Gastroenterol. 32, 48–51 (1997). · DOI
- Fink, M. Y. & Singer, S. M. The intersection of immune responses, microbiota and pathogenesis in giardiasis. Trends Parasitol. 33, 901–913, https://doi.org/10.1016/j.pt.2017.08.001 (2017). · DOI
- Sano, T. et al. An IL-23R/IL-22 circuit regulates epithelial serum amyloid A to promote local effector Th17 responses. Cell 163, 381–393, https://doi.org/10.1016/j.cell.2015.08.061 (2015). · DOI · Paper page
- Schön, M. P. Mucosal T lymphocyte numbers are selectively reduced in integrin alpha E (CD103) deficient mice. J. Immunol. 162, 6641–6649 (1999). · DOI
- Mackay, L. K. Cutting edge: CD69 interference with sphingosine-1-phosphate receptor function regulates peripheral T cell retention. J. Immunol., https://doi.org/10.4049/jimmunol.1402256 (2015). · DOI
- Dann, S. M., Le, C. H. Y., Hanson, E. M., Ross, M. C. & Eckmann, L. Giardia infection of the small intestine induces chronic colitis in genetically-susceptible hosts. J. Immun. https://doi.org/10.4049/jimmunol.1700824 (2018). · DOI
- Barash, N. R., Maloney, J. G., Singer, S. M. & Dawson, S. C. Giardia alters commensal microbial diversity throughout the murine gut. Infect. Immun. 85, e00948–16, https://doi.org/10.1128/IAI.00948-16 (2017). · DOI
- Karimi, K. et al. Lactobacillus reuteri-induced regulatory T cells protect against an allergic airway response in mice. Am. J. Respir. Crit. Care Med. 179, 186–193, https://doi.org/10.1164/rccm.200806-951OC (2009). · DOI
- Atarashi, K. et al. Induction of colonic regulatory T cells by indigenous Clostridium species. Science 331, 337–341, https://doi.org/10.1126/science.1198469 (2011). · DOI · Paper page
- Reynolds, L. A. et al. Commensal-pathogen interactions in the intestinal tract; lactobacilli promote infection with, and are promoted by, helminth parasites. Gut Microbes 5, 522–532, https://doi.org/10.4161/gmic.32155 (2014). · DOI
- Yordanova, I. A. et al. Micromanaging immunity in the murine host vs. the mosquito vector: microbiota-dependent immune responses to intestinal parasites. Front. Cell. Infect. Microbiol. 8, 308, https://doi.org/10.3389/fcimb.2018.00308 (2018). · DOI
- Ivanov, I. I. et al. Induction of intestinal Th17 cells by Segmented Filamentous Bacteria. Cell 139, 485–498, https://doi.org/10.1016/j.cell.2009.09.033 (2009). · DOI · Paper page
- Atarashi, K. et al. Th17 cell induction by adhesion of microbes to intestinal epithelial cells. Cell 163, 367–380, https://doi.org/10.1016/j.cell.2015.08.058 (2015). · DOI · Paper page
- Singer, S. M. & Nash, T. E. The role of normal flora in Giardia lamblia infections in mice. J. Infect. Dis. 181, 1510–1512 (2000). · DOI
- Paerewijck, O., Maertens, B., Gagnaire, A., de Bosscher, K. & Geldhof, P. Delayed development of the protective IL-17A response following a Giardia muris infection in neonatal mice. Sci. Rep. 9, 8959, https://doi.org/10.1038/s41598-019-45544-x (2019). · DOI
- Davis, C. P. & Savage, D. C. Habitat, succession, attachment, and morphology of segmented, filamentous microbes indigenous to the murine gastrointestinal tract. Infect. Immun. 10, 948–956 (1974). · DOI
- Kumar, P. et al. Intestinal Interleukin-17 receptor signaling mediates reciprocal control of the gut microbiota and autoimmune inflammation. Immunity 44, 659–671, https://doi.org/10.1016/j.immuni.2016.02.007 (2016). · DOI · Paper page
- Suzuki, K. et al. Aberrant expansion of segmented filamentous bacteria in IgA-deficient gut. Proc. Natl. Acad. Sci. USA 101, 1981–1986 (2004). · DOI · Paper page
- Manko, A. et al. Giardia co-infection promotes the secretion of antimicrobial peptides beta-defensin 2 and trefoil factor 3 and attenuates attaching and effacing bacteria-induced intestinal disease. PLoS ONE, e0178647; https://doi.org/10.1371/journal.pone.0178647 (2017). · DOI
- Manko, A. et al. A292 NLRP3-dependent production of antimicrobial peptides during co-infection with Giardia intestinalis and E. coli. J. Canad. Ass. Gastroenterol. 1, 506–507, https://doi.org/10.1093/jcag/gwy008.293 (2018). · DOI
- Daniels, C. W. & Belosevic, M. Serum antibody responses by male and female C57BL/6 mice infected with Giardia muris. Clin. Exp. Immunol. 97, 424–429 (1994). · DOI
- Heyworth, M. F. & Pappo, J. Recognition of a 30,000 MW antigen of Giardia muris trophozoites by intestinal IgA from Giardia-infected mice. Immunology. 70, 535–539 (1990).
- Roberts-Thomson, I. C., Svenes, D. P., Mahmoud, A. A. & Warren, K. S. Giardiasis in the mouse: an animal model. Gastroenterology 71, 57–61 (1976). · DOI
- Strandmark, J. et al. Eosinophils are required to suppress Th2 responses in Peyer’s patches during intestinal infection by nematodes. Mucosal Immunol. 10, 661–672, https://doi.org/10.1038/mi.2016.93 (2017). · DOI
- Rausch, S. et al. Establishment of nematode infection despite increased Th2 responses and immunopathology after selective depletion of Foxp3+ cells. Eur. J. Immunol. https://doi.org/10.1002/eji.200939644 (2009). · DOI
- Heimesaat, M. M. et al. Intestinal microbiota changes in mice lacking pituitary adenylate cyclase activating polypeptide (PACAP) - Bifidobacteria make the difference. Eur. J. Microbiol. Immunol. 7, 187–199, https://doi.org/10.1556/1886.2017.00021 (2017). · DOI
- Klindworth, A. et al. Evaluation of general 16S ribosomal RNA gene PCR primers for classical and next-generation sequencing-based diversity studies. Nucleic Acids Res. 41, e1, https://doi.org/10.1093/nar/gks808 (2013). · DOI · Paper page
- Caporaso, J. G. et al. QIIME allows analysis of high-throughput community sequencing data. Nat. Methods 7, 335–336, https://doi.org/10.1038/nmeth.f.303 (2010). · DOI · Paper page
- Callahan, B. J. et al. DADA2: High-resolution sample inference from Illumina amplicon data. Nat. Methods 13, 581–583, https://doi.org/10.1038/nmeth.3869 (2016). · DOI · Paper page
- Quast, C. et al. The SILVA ribosomal RNA gene database project: improved data processing and web-based tools. Nucleic Acids Res. 41, D590–D596, https://doi.org/10.1093/nar/gks1219 (2013). · DOI · Paper page
- Zakrzewski, M. et al. Calypso: a user-friendly web-server for mining and visualizing microbiome–environment interactions. Bioinformatics 33, 782–783, https://doi.org/10.1093/bioinformatics/btw725 (2017). · DOI
- Clarke, K. R. Non-parametric multivariate analyses of changes in community structure. Aust. J. Ecol. 18, 117–143, https://doi.org/10.1111/j.1442-9993.1993.tb00438.x (1993). · DOI
- Segata, N. et al. Metagenomic biomarker discovery and explanation. Genome Biol. 12, R60, https://doi.org/10.1186/gb-2011-12-6-r60 (2011). · DOI · Paper page
- Love, M. I., Huber, W. & Anders, S. Moderated estimation of fold change and dispersion for RNA-seq data with DESeq. 2. Genome Biol. 15, 550 (2014). · DOI · Paper page
Cited by
Sorted by citations
Packi, K., Świerczewski, D., Klimczak, S., Ochab, D., Gałęziewska, J., Gromek, P., Kruczkowska, W., Płuciennik, E., Kałuzińska-Kołat, Ż., & Kołat, D. (2026) · Antonie van Leeuwenhoek · doi:10.1007/s10482-026-02425-4
Metadata
- Authors
- Yordanova, I. A., Cortés, A., Klotz, C., Kühl, A. A., Heimesaat, M. M., Cantacessi, C., Hartmann, S., & Rausch, S.
- Venue
- Scientific Reports
- Published
- 2019-12-30
- Volume
- 9
- Issue
- 1
- ISSN
- 2045-2322
- PMC
- PMC6937251
- Cited by
- 22
- References
- 3
- Language
- en
- Funders
- Fundacion Alfonso Martin Escudero
- Deutsche Forschungsgemeinschaft (GRK2046)
- Bundesministerium für Bildung und Forschung (IP7/01KI1725D)
- RCUK | Biotechnology and Biological Sciences Research Council
- Isaac Newton Trust
About these checks
Registry, retraction, Cites and statistics results are computed, not judged, with one exception: a printed reference that no index lists is read once by a model before it counts as a citation error. Claims are extracted by a model and kept only when their quote appears verbatim in the text; each cited source is then checked, with a model’s help, for whether it says what the claim relies on. Those verdicts can be wrong — read the claim’s quote and the cited source before relying on one.
Statistics and arithmetic are recomputed, not judged.
Confidence bands are shown only for fields calibrated on our annotated test set. None is calibrated yet, so no band is shown.
What counts as a claim ›How we measure confidence ›How we check this ›
Are you an author, or do you see a problem with this page? Request a review
How to cite
Cite CoChat for the checks on this page, and the paper for its own findings.
- This page
- CoChat. (2026). Citation check: RORγt+ Treg to Th17 ratios correlate with susceptibility to Giardia infection. https://app.cochat.ai/papers/10.1038/s41598-019-56416-9
- The paper
- Yordanova, I. A., Cortés, A., Klotz, C., Kühl, A. A., Heimesaat, M. M., Cantacessi, C., Hartmann, S., & Rausch, S. (2019). RORγt+ Treg to Th17 ratios correlate with susceptibility to Giardia infection. Scientific Reports. https://doi.org/10.1038/s41598-019-56416-9
