

The DOI matches its Crossref record; 59 of the 59 references it cites were found in a registry or an index.
A systematic review and meta-analysis of geographic differences in comorbidities and associated severity and mortality among individuals with COVID-19
Open accessAbstract
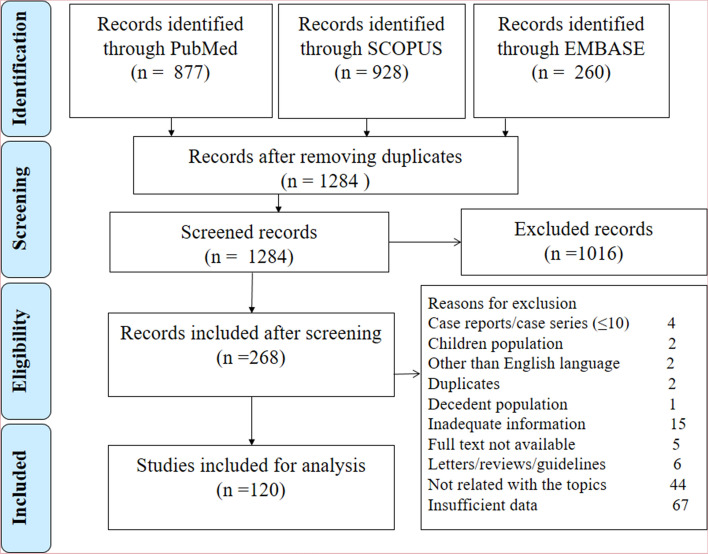
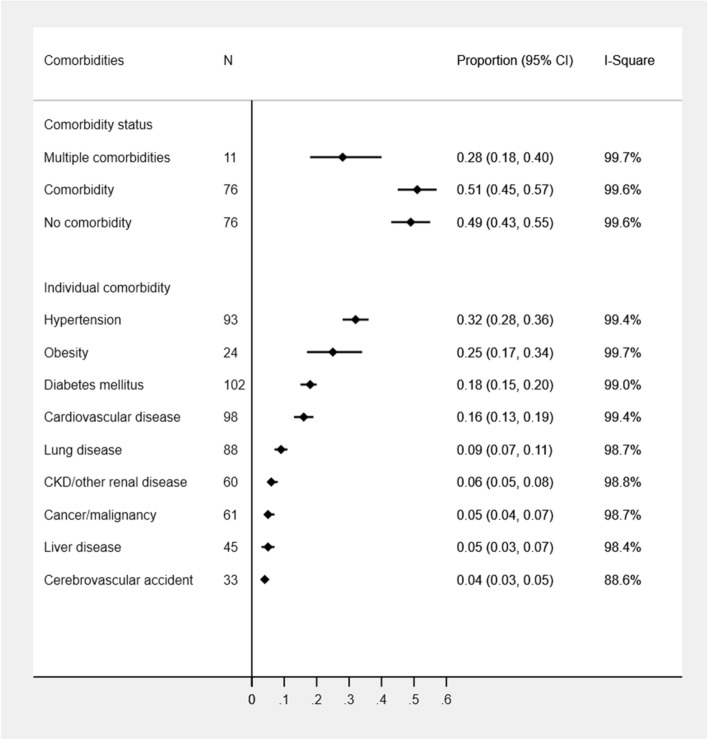
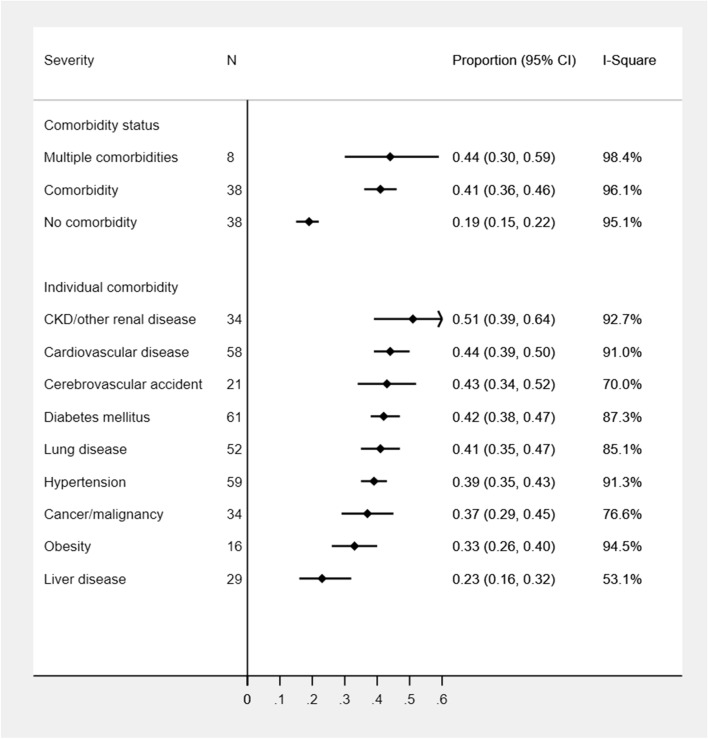
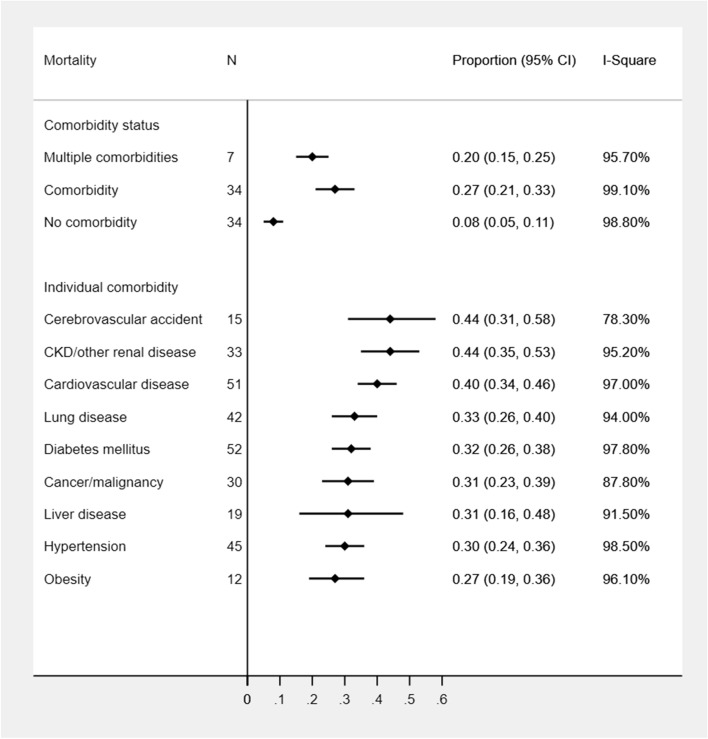
Several comorbidities have been shown to be associated with coronavirus disease 2019 (COVID-19) related severity and mortality. However, considerable variation in the prevalence estimates of comorbidities and their effects on COVID-19 morbidity and mortality have been observed in prior studies. This systematic review and meta-analysis aimed to determine geographical, age, and gender related differences in the prevalence of comorbidities and associated severity and mortality rates among COVID-19 patients. We conducted a search using PubMed, Scopus, and EMBASE to include all COVID-19 studies published between January 1st, 2020 to July 24th, 2020 reporting comorbidities with severity or mortality. We included studies reporting the confirmed diagnosis of COVID-19 on human patients that also provided information on comorbidities or disease outcomes. We used DerSimonian and Laird random effects method for calculating estimates. Of 120 studies with 125,446 patients, the most prevalent comorbidity was hypertension (32%), obesity (25%), diabetes (18%), and cardiovascular disease (16%) while chronic kidney or other renal diseases (51%, 44%), cerebrovascular accident (43%, 44%), and cardiovascular disease (44%, 40%) patients had more COVID-19 severity and mortality respectively. Considerable variation in the prevalence of comorbidities and associated disease severity and mortality in different geographic regions was observed. The highest mortality was observed in studies with Latin American and European patients with any medical condition, mostly older adults (≥ 65 years), and predominantly male patients. Although the US studies observed the highest prevalence of comorbidities in COVID-19 patients, the severity of COVID-19 among each comorbid condition was highest in Asian studies whereas the mortality was highest in the European and Latin American countries. Risk stratification and effective control strategies for the COVID-19 should be done according to comorbidities, age, and gender differences specific to geographical location.
Overview
The claims and statistics of this paper haven’t been checked yet.
Run the check — free, no account needed. It reads the open-access text and checks the sources it cites.
Integrity signals
Registry
Cites
Statistics
Figures
Verification
Claims the paper makes
The claims and statistics of this paper haven’t been checked yet.
Run the check — free, no account needed. It reads the open-access text and checks the sources it cites.
Self-check
Percentages, sums and reported differences re-computed from the paper’s own numbers.
The self-check needs the paper’s full text.
Citations
Cites
Preferred Reporting Items for Systematic Reviews and Meta-Analyses: the PRISMA statement
Moher, D., Liberati, A., Tetzlaff, J., Altman, D. G., & for the PRISMA Group (2009) · BMJ · doi:10.1136/bmj.b2535 · Cited by 83,823
Preferred Reporting Items for Systematic Reviews and Meta-Analyses: The PRISMA Statement
Moher, D., Liberati, A., Tetzlaff, J., Altman, D. G., & The PRISMA Group (2009) · PLoS Medicine · doi:10.1371/journal.pmed.1000097 · Cited by 64,042
Preferred reporting items for systematic reviews and meta-analyses: the PRISMA Statement.
(2009) · PubMed Central · Cited by 44,859
Meta-analysis in clinical trials
DerSimonian, R., & Laird, N. (1986) · Controlled Clinical Trials · doi:10.1016/0197-2456(86)90046-2 · Cited by 39,552
Wang, G., Ma, R., Qiao, G., Wada, K., Aizawa, Y., & Satoh, T. (2015) · Integrative Medicine International · doi:10.1159/000368408 · Cited by 18,762
Yang, X., Yu, Y., Xu, J., Shu, H., Xia, J., Liu, H., Wu, Y., Zhang, L., Yu, Z., Fang, M., et al. (2020) · The Lancet Respiratory Medicine · doi:10.1016/s2213-2600(20)30079-5 · Cited by 10,066
Wu, C., Chen, X., Cai, Y., Xia, J., Zhou, X., Xu, S., Huang, H., Zhang, L., Zhou, X., Du, C., et al. (2020) · JAMA Internal Medicine · doi:10.1001/jamainternmed.2020.0994 · Cited by 8,249
Slim, K., Nini, E., Forestier, D., Kwiatkowski, F., Panis, Y., & Chipponi, J. (2003) · ANZ Journal of Surgery · doi:10.1046/j.1445-2197.2003.02748.x · Cited by 7,603
Sex differences in immune responses
Klein, S. L., & Flanagan, K. L. (2016) · Nature Reviews Immunology · doi:10.1038/nri.2016.90 · Cited by 6,370
Ruan, Q., Yang, K., Wang, W., Jiang, L., & Song, J. (2020) · Intensive Care Medicine · doi:10.1007/s00134-020-05991-x · Cited by 4,898
Comorbidity and its impact on 1590 patients with covid-19 in China: a nationwide analysis
Guan, W.-J., Liang, W.-H., Zhao, Y., Liang, H.-R., Chen, Z.-S., Li, Y.-M., Liu, X.-Q., Chen, R.-C., Tang, C.-L., Wang, T., et al. (2020) · European Respiratory Journal · doi:10.1183/13993003.00547-2020 · Cited by 3,680
Docherty, A. B., Harrison, E. M., Green, C. A., Hardwick, H. E., Pius, R., Norman, L., Holden, K. A., Read, J. M., Dondelinger, F., Carson, G., et al. (2020) · BMJ · doi:10.1136/bmj.m1985 · Cited by 3,481
Petrilli, C. M., Jones, S. A., Yang, J., Rajagopalan, H., O’Donnell, L., Chernyak, Y., Tobin, K. A., Cerfolio, R. J., François, F., & Horwitz, L. I. (2020) · BMJ · doi:10.1136/bmj.m1966 · Cited by 3,045
Are patients with hypertension and diabetes mellitus at increased risk for COVID-19 infection?
Fang, L., Karakiulakis, G., & Roth, M. (2020) · The Lancet Respiratory Medicine · doi:10.1016/s2213-2600(20)30116-8 · Cited by 2,947
Simonnet, A., Chetboun, M., Poissy, J., Raverdy, V., Noulette, J., Duhamel, A., Labreuche, J., Mathieu, D., Pattou, F. N., Jourdain, M., et al. (2020) · Obesity · doi:10.1002/oby.22831 · Cited by 2,150
Driggin, E., Madhavan, M. V., Bikdeli, B., Chuich, T., Laracy, J. C., Biondi‐Zoccai, G., Brown, T. S., Der-Nigoghossian, C. A., Zidar, D. A., Haythe, J. H., et al. (2020) · Journal of the American College of Cardiology · doi:10.1016/j.jacc.2020.03.031 · Cited by 2,086
COVID-19 and cardiovascular disease: from basic mechanisms to clinical perspectives
Nishiga, M., Wang, D. W., Han, Y., Lewis, D. B., & Wu, J. C. (2020) · Nature Reviews Cardiology · doi:10.1038/s41569-020-0413-9 · Cited by 1,436
Does comorbidity increase the risk of patients with COVID-19: evidence from meta-analysis
Wang, B., Li, R., Lu, Z., & Huang, Y. (2020) · Aging · doi:10.18632/aging.103000 · Cited by 1,304
Fu, L., Wang, B., Yuan, T., Chen, X., Ao, Y., Fitzpatrick, T., Li, P., Zhou, Y., Lin, Y., Duan, Q., et al. (2020) · Journal of Infection · doi:10.1016/j.jinf.2020.03.041 · Cited by 1,141
Palaiodimos, L., Kokkinidis, D. G., Li, W., Karamanis, D., Ognibene, J., Arora, S., Southern, W. N., & Mantzoros, C. S. (2020) · Metabolism · doi:10.1016/j.metabol.2020.154262 · Cited by 864
Covid-19: WHO declares pandemic because of “alarming levels” of spread, severity, and inaction
Mahase, E. (2020) · BMJ · doi:10.1136/bmj.m1036 · Cited by 660
Prevention, Diagnosis, and Treatment of VTE in Patients With Coronavirus Disease 2019
Moores, L. K., Tritschler, T., Brosnahan, S. B., Carrier, M., Collen, J. F., Doerschug, K. C., Holley, A. B., Jiménez, D., Gal, G. L., Rali, P. M., et al. (2020) · CHEST Journal · doi:10.1016/j.chest.2020.05.559 · Cited by 653
Raghupathi, W., & Raghupathi, V. (2018) · International Journal of Environmental Research and Public Health · doi:10.3390/ijerph15030431 · Cited by 587
Ssentongo, P., Ssentongo, A. E., Heilbrunn, E. S., Ba, D. M., & Chinchilli, V. M. (2020) · PLoS ONE · doi:10.1371/journal.pone.0238215 · Cited by 557
The impact of ethnicity on clinical outcomes in COVID-19: A systematic review
Pan, D., Sze, S., Minhas, J. S., Bangash, M. N., Pareek, N., Divall, P., Williams, C., Oggioni, M. R., Squire, I. B., Nellums, L. B., et al. (2020) · EClinicalMedicine · doi:10.1016/j.eclinm.2020.100404 · Cited by 541
Biswas, M., Rahaman, S., Biswas, T. K., Haque, Z., & Ibrahim, B. (2020) · Intervirology · doi:10.1159/000512592 · Cited by 532
COVID‐19 in a designated infectious diseases hospital outside Hubei Province, China
Cai, Q., Huang, D., Ou, P., Yu, H., Zhu, Z., Zhang, X., Su, Y., Ma, Z., Zhang, Y., Li, Z., et al. (2020) · Allergy · doi:10.1111/all.14309 · Cited by 507
Preexisting Comorbidities Predicting COVID-19 and Mortality in the UK Biobank Community Cohort
Atkins, J. L., Masoli, J. A. H., Delgado, J., Pilling, L. C., Kuo, C., Kuchel, G. A., & Melzer, D. R. (2020) · The Journals of Gerontology Series A · doi:10.1093/gerona/glaa183 · Cited by 497
Fang, X., Shen, L., Yu, H., Wang, P., Zhang, Y., Chen, Z., Li, Y., Cheng, L., Li, W., Jia, H., et al. (2020) · Aging · doi:10.18632/aging.103579 · Cited by 492
CDC COVID-19 Response Team, CDC COVID-19 Response Team, Bialek, S. R., Bowen, V. B., Chow, N. A., Curns, A. T., Gierke, R., Hall, A. J., Hughes, M. M., Pilishvili, T., et al. (2020) · MMWR Morbidity and Mortality Weekly Report · doi:10.15585/mmwr.mm6915e4 · Cited by 461
Pancreatic Injury Patterns in Patients With Coronavirus Disease 19 Pneumonia
Wang, F., Wang, H., Fan, J., Zhang, Y., Wang, H., & Zhao, Q. (2020) · Gastroenterology · doi:10.1053/j.gastro.2020.03.055 · Cited by 460
Epidemiological and clinical characteristics of the COVID-19 epidemic in Brazil
de Souza, W. M., Buss, L., Cândido, D. D. S., Carrera, J., Li, S., Zarebski, A. E., Pereira, R. H. M., Junior, C. A. P., Santos, A. A. D. S., Parag, K. V., et al. (2020) · Nature Human Behaviour · doi:10.1038/s41562-020-0928-4 · Cited by 444
Singh, A. K., Gillies, C., Singh, R., Singh, A., Chudasama, Y., Coles, B., Seidu, S., Zaccardi, F., Davies, M. J., & Khunti, K. (2020) · Diabetes Obesity and Metabolism · doi:10.1111/dom.14124 · Cited by 427
Pranata, R., Huang, I., Lim, M. A., Wahjoepramono, E. J., & July, J. (2020) · Journal of Stroke and Cerebrovascular Diseases · doi:10.1016/j.jstrokecerebrovasdis.2020.104949 · Cited by 364
Prevalence of comorbidities among individuals with COVID-19: A rapid review of current literature
Bajgain, K. T., Badal, S., Bajgain, B. B., & Santana, M. J. (2021) · American Journal of Infection Control · doi:10.1016/j.ajic.2020.06.213 · Cited by 328
Prevalence and Associated Risk Factors of Mortality Among COVID-19 Patients: A Meta-Analysis
Noor, F. M., & Islam, M. M. (2020) · Journal of Community Health · doi:10.1007/s10900-020-00920-x · Cited by 303
NANDY, K., Salunke, A. A., Pathak, S. K., Pandey, A. K., Doctor, C., Puj, K. S., Sharma, M. R., Jain, A., & Warikoo, V. (2020) · Diabetes & Metabolic Syndrome Clinical Research & Reviews · doi:10.1016/j.dsx.2020.06.064 · Cited by 226
Aggarwal, G., Cheruiyot, I., Aggarwal, S., Wong, J., Lippi, G., Lavie, C. J., Henry, B. M., & Sanchis‐Gomar, F. (2020) · Current Problems in Cardiology · doi:10.1016/j.cpcardiol.2020.100617 · Cited by 189
Dubey, P., Reddy, S., Manuel, S. L., & Dwivedi, A. K. (2020) · European Journal of Obstetrics & Gynecology and Reproductive Biology · doi:10.1016/j.ejogrb.2020.07.034 · Cited by 185
Self-citationMartins‐Filho, P. R., Tavares, C. S. S., & Santos, V. S. (2020) · European Journal of Internal Medicine · doi:10.1016/j.ejim.2020.04.043 · Cited by 182
Mahil, S. K., Dand, N., Mason, K. J., Yiu, Z. Z. N., Tsakok, T., Meynell, F., Coker, B., McAteer, H., Moorhead, L., Mackenzie, T., et al. (2020) · Journal of Allergy and Clinical Immunology · doi:10.1016/j.jaci.2020.10.007 · Cited by 153
Li, J., He, X., Yuan, Y., Zhang, W., Li, X., Zhang, Y., Li, S., Guan, C., Gao, Z., & Dong, G. (2020) · American Journal of Infection Control · doi:10.1016/j.ajic.2020.06.008 · Cited by 142
Sundemo, D., Hamrin Senorski, E., Karlsson, L., Horvath, A., Juul-Kristensen, B., Karlsson, J., Ayeni, O. R., & Samuelsson, K. (2019) · BMJ Open Sport & Exercise Medicine · doi:10.1136/bmjsem-2019-000620 · Cited by 108
Covid-19: what treatments are being investigated?
Mahase, E. (2020) · BMJ · doi:10.1136/bmj.m1252 · Cited by 108
Chand, S., Kapoor, S., Orsi, D., Fazzari, M. J., Tanner, T., Umeh, G., Islam, M., & Dicpinigaitis, P. V. (2020) · Journal of Intensive Care Medicine · doi:10.1177/0885066620946692 · Cited by 95
Luo, L., Fu, M., Li, Y., Hu, S., Luo, J., Chen, Z., Yu, J., Li, W., Dong, R., Yang, Y., et al. (2020) · Clinical Cardiology · doi:10.1002/clc.23465 · Cited by 84
Pablos-Méndez, A., Vega, J., Petersen-Aranguren, F., Tabish, H. B., & Raviglione, M. C. (2020) · BMJ · doi:10.1136/bmj.m2939 · Cited by 77
Dwivedi, A. K., & Shukla, R. (2019) · Cancer Reports · doi:10.1002/cnr2.1211 · Cited by 58
Self-citationFilardo, T. D., Khan, M. R., Krawczyk, N., Galitzer, H., Karmen-Tuohy, S., Coffee, M. P., Schaye, V. E., Eckhardt, B. J., & Cohen, G. M. (2020) · PLoS ONE · doi:10.1371/journal.pone.0242760 · Cited by 48
Predictors of Severity in Covid-19 Patients in Casablanca, Morocco
Aidaoui, K. E., Haoudar, A., Khalis, M., Kantri, A., Ziati, J., Ghanmi, A. E., Bennis, G., Yamani, K. E., Dini, N., & Kettani, C. E. (2020) · Cureus · doi:10.7759/cureus.10716 · Cited by 46
Yazdanpanah, Y., & French COVID cohort investigators and study group (2020) · Journal of Medical Virology · doi:10.1002/jmv.26601 · Cited by 40
Which is the Preferred Measure of Heterogeneity in Meta-Analysis and Why? A Revisit
Dwivedi, S. N. (2017) · Biostatistics and Biometrics Open Access Journal · doi:10.19080/bboaj.2017.01.555555 · Cited by 39
Pharmacotherapy for Hospitalized Patients with COVID-19: Treatment Patterns by Disease Severity
Lin, K. J., Schneeweiß, S., Tesfaye, H., D’Andrea, E., Liu, J., Lii, J., Murphy, S. N., & Gagne, J. J. (2020) · Drugs · doi:10.1007/s40265-020-01424-7 · Cited by 35
Dubey, P., Thakur, B., Reddy, S., Martinez, C. A., Nurunnabi, M., Manuel, S. L., Chheda, S., Bracamontes, C., & Dwivedi, A. K. (2021) · BMC Pregnancy and Childbirth · doi:10.1186/s12884-021-03685-w · Cited by 28
Self-citationDyslipidemias and Elevated Cardiovascular Risk on Lopinavir-Based Antiretroviral Therapy in Cambodia
Limsreng, S., Marcy, O., Ly, S., Ouk, V., Hak, C., Thavary, S., Ban, B., Canestri, A., Viretto, G., Delfraissy, J., et al. (2016) · PLoS ONE · doi:10.1371/journal.pone.0160306 · Cited by 22
Barbu, M. G., Thompson, R. J., Thompson, D. C., Crețoiu, D., & Suciu, N. (2020) · Frontiers in Medicine · doi:10.3389/fmed.2020.567199 · Cited by 21
El papel de la inmunidad innata en la obesidad
Fortis, Á., García-Macedo, R., Maldonado‐Bernal, C., Alarcón-Aguilar, F. J., & Cruz, M. (2012) · Salud Pública de México · doi:10.1590/s0036-36342012000200014 · Cited by 20
Cervantes, J., Sureen, A., Galura, G. M., Dodoo, C., Dwivedi, A. K., Bashashati, M., Zuckerman, M. J., & Meza, A. D. (2021) · Journal of Investigative Medicine · doi:10.1136/jim-2020-001667 · Cited by 9
Self-citation(2018) · Oncology Times · doi:10.1097/01.cot.0000531934.84793.bb · Cited by 3
Cited by
Sorted by citations
Oral Nirmatrelvir for High-Risk, Nonhospitalized Adults with Covid-19
Hammond, J., Leister-Tebbe, H., Gardner, A., Abreu, P., Bao, W., Wisemandle, W., Baniecki, M., Hendrick, V. M., Damle, B., Simón-Campos, A., et al. (2022) · New England Journal of Medicine · doi:10.1056/nejmoa2118542 · Cited by 2,323
The Lancet Commission on lessons for the future from the COVID-19 pandemic
Sachs, J. D., Karim, S. S. A., Aknin, L., Allen, J., Brosbøl, K., Colombo, F., Barron, G. C., Espinosa, M. F., Gaspar, V., Gaviria, A., et al. (2022) · The Lancet · doi:10.1016/s0140-6736(22)01585-9 · Cited by 842
Life expectancy changes since COVID-19
Schöley, J., Aburto, J. M., Kashnitsky, I., Kniffka, M. S., Zhang, L., Jaadla, H., Dowd, J. B., & Kashyap, R. (2022) · Nature Human Behaviour · doi:10.1038/s41562-022-01450-3 · Cited by 282
COVID-19 and metabolic disease: mechanisms and clinical management
Steenblock, C., Schwarz, P. E. H., Ludwig, B., Linkermann, A., Zimmet, P., Kulebyakin, K. Y., Va, T., Markov, A. G., Lehnert, H., de Angelis, M. H., et al. (2021) · The Lancet Diabetes & Endocrinology · doi:10.1016/s2213-8587(21)00244-8 · Cited by 256
Mahamat‐Saleh, Y., Fiolet, T., Rebeaud, M. E., Mulot, M., Guihur, A., Fatouhi, D. E., Laouali, N., Peiffer‐Smadja, N., Aune, D., & Severi, G. (2021) · BMJ Open · doi:10.1136/bmjopen-2021-052777 · Cited by 205
Metadata
- Authors
- Thakur, B., Dubey, P., Benitez, J., Torres, J. P., Reddy, S., Shokar, N., Aung, K., Mukherjee, D., & Dwivedi, A. K.
- Affiliations
- Texas Tech University Health Sciences Center (US)
- Texas Tech University (US)
- Corresponding author
- Dwivedi, Alok Kumar
- ORCID
- Venue
- Scientific Reports
- Published
- 2021-04-20
- Volume
- 11
- Issue
- 1
- Pages
- 8562-8562
- ISSN
- 2045-2322 (ISSN-L)
- PMC
- PMC8058064
- OpenAlex
- W3152572687
- Cited by
- 284
- References
- 59
- Citations by year
- 2026: 11 · 2025: 17 · 2024: 53 · 2023: 66 · 2022: 95 · 2021: 41
- FWCI
- 7.45
- Type
- journal article
- Language
- en
- Open access
- gold
- doi.org
- Locations
- Scientific Reports (publishedVersion, cc-by)
- PubMed Central (publishedVersion, cc-by)
- PubMed (publishedVersion)
- DOAJ (DOAJ: Directory of Open Access Journals) (submittedVersion, cc-by-sa)
- Topics
- Health Sciences › Medicine › Infectious Diseases › COVID-19 Clinical Research Studies
- Physical Sciences › Mathematics › Modeling and Simulation › COVID-19 epidemiological studies
- Health Sciences › Medicine › Clinical Neurology › Long-Term Effects of COVID-19
- Keywords
- COVID-19 pandemic, comorbidities, disease severity, mortality, regional variation, hypertension, obesity, diabetes mellitus, cardiovascular disease, chronic kidney disease, cerebrovascular disease, age differences, sex differences, risk stratification
- MeSH terms
- COVID-19, Age Factors, Aged, Aged, 80 and over, Asia, Europe, Female, Humans, Latin America, Male, Severity of Illness Index, Sex Factors, Comorbidity, Prevalence
About these checks
Registry, retraction, Cites and statistics results are computed, not judged, with one exception: a printed reference that no index lists is read once by a model before it counts as a citation error. Claims are extracted by a model and kept only when their quote appears verbatim in the text; each cited source is then checked, with a model’s help, for whether it says what the claim relies on. Those verdicts can be wrong — read the claim’s quote and the cited source before relying on one.
Statistics and arithmetic are recomputed, not judged.
Confidence bands are shown only for fields calibrated on our annotated test set. None is calibrated yet, so no band is shown.
What counts as a claim ›How we measure confidence ›How we check this ›
Are you an author, or do you see a problem with this page? Request a review
