

The DOI matches its Crossref record; 49 of the 57 references it cites were found in a registry or an index.
Evaluation of domain generalization and adaptation on improving model robustness to temporal dataset shift in clinical medicine
Open accessPublished version of a preprint
Abstract
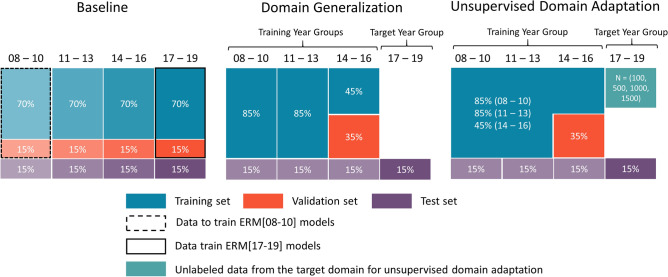
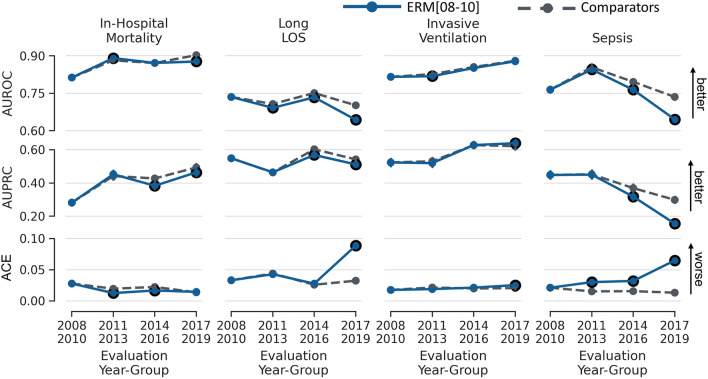
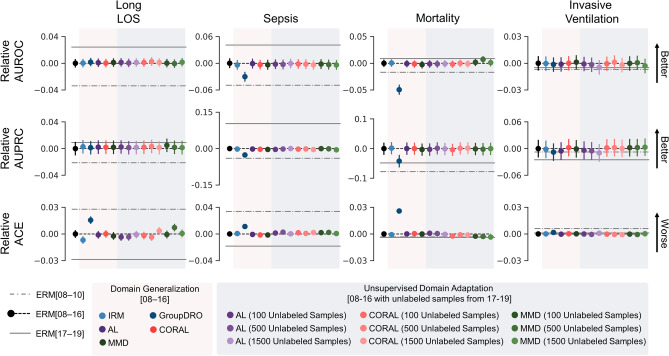
Temporal dataset shift associated with changes in healthcare over time is a barrier to deploying machine learning-based clinical decision support systems. Algorithms that learn robust models by estimating invariant properties across time periods for domain generalization (DG) and unsupervised domain adaptation (UDA) might be suitable to proactively mitigate dataset shift. The objective was to characterize the impact of temporal dataset shift on clinical prediction models and benchmark DG and UDA algorithms on improving model robustness. In this cohort study, intensive care unit patients from the MIMIC-IV database were categorized by year groups (2008–2010, 2011–2013, 2014–2016 and 2017–2019). Tasks were predicting mortality, long length of stay, sepsis and invasive ventilation. Feedforward neural networks were used as prediction models. The baseline experiment trained models using empirical risk minimization (ERM) on 2008–2010 (ERM[08–10]) and evaluated them on subsequent year groups. DG experiment trained models using algorithms that estimated invariant properties using 2008–2016 and evaluated them on 2017–2019. UDA experiment leveraged unlabelled samples from 2017 to 2019 for unsupervised distribution matching. DG and UDA models were compared to ERM[08–16] models trained using 2008–2016. Main performance measures were area-under-the-receiver-operating-characteristic curve (AUROC), area-under-the-precision-recall curve and absolute calibration error. Threshold-based metrics including false-positives and false-negatives were used to assess the clinical impact of temporal dataset shift and its mitigation strategies. In the baseline experiments, dataset shift was most evident for sepsis prediction (maximum AUROC drop, 0.090; 95% confidence interval (CI), 0.080–0.101). Considering a scenario of 100 consecutively admitted patients showed that ERM[08–10] applied to 2017–2019 was associated with one additional false-negative among 11 patients with sepsis, when compared to the model applied to 2008–2010. When compared with ERM[08–16], DG and UDA experiments failed to produce more robust models (range of AUROC difference, − 0.003 to 0.050). In conclusion, DG and UDA failed to produce more robust models compared to ERM in the setting of temporal dataset shift. Alternate approaches are required to preserve model performance over time in clinical medicine.
Overview
The claims and statistics of this paper haven’t been checked yet.
Run the check — free, no account needed. It reads the open-access text and checks the sources it cites.
Integrity signals
Registry
Cites
Statistics
Figures
Verification
Claims the paper makes
The claims and statistics of this paper haven’t been checked yet.
Run the check — free, no account needed. It reads the open-access text and checks the sources it cites.
Claims other papers make about this one
Each is checked against this paper’s own text: does it say what the citing paper says it does?
The cited source says what the claim attributes to it.
In the citing paper
“When it comes to the concrete behaviour change of the DL algorithm, most of the DL papers in the literature corpus investigate the robustness of a model, i.e. the stable behaviour of a model when facing erroneous or a limited amount of inputs. Only few records investigate generalisability119,144,145 or distribution shift139,192, a model’s capability of coping with new, unseen data.”
From The METRIC-framework for assessing data quality for trustworthy AI in medicine: A systematic review (2024) · cites this paper as [192]
Self-check
Percentages, sums and reported differences re-computed from the paper’s own numbers.
The self-check needs the paper’s full text.
Citations
Cites
PyTorch: An Imperative Style, High-Performance Deep Learning Library
Paszke, A., Gross, S., Massa, F., Lerer, A., Bradbury, J., Chanan, G., Killeen, T., Lin, Z., Gimelshein, N., Antiga, L., et al. (2019) · arXiv · doi:10.48550/arxiv.1912.01703 · Cited by 31,473
The third international consensus definitions for sepsis and septic shock (Sepsis-3).
Singer, M., Deutschman, C. S., Seymour, C. W., Shankar-Hari, M., Annane, D., Bauer, M., Bellomo, R., Bernard, G. R., Chiche, J.-D., Coopersmith, C. M., et al. (2016) · JAMA · doi:10.1001/jama.2016.0287 · Cited by 28,250 · cited 1×
“Sepsis corresponded to the development of sepsis according to the Sepsis-3 criteria 14 within 7 days from the prediction time.”
MethodGoldberger, A. L., Amaral, L. A. N., Glass, L., Hausdorff, J. M., Ivanov, P. C., Mark, R. G., Mietus, J. E., Moody, G. B., Peng, C.-K., & Stanley, H. E. (2000) · Circulation · doi:10.1161/01.cir.101.23.e215 · Cited by 14,809
Scikit-learn: Machine Learning in Python
(2011) · Journal of Machine Learning Research · doi:10.5555/1953048.2078195 · Cited by 8,539
Domain-Adversarial Training of Neural Networks
Ganin, Y., Ustinova, E., Ajakan, H., Germain, P., Larochelle, H., Laviolette, F., Marchand, M., & Lempitsky, V. (2017) · Advances in Computer Vision and Pattern Recognition · doi:10.1007/978-3-319-58347-1_10 · Cited by 8,318
Domain Adaptation via Transfer Component Analysis
Pan, S. J., Tsang, I. W.-H., Kwok, J. T.-Y., & Yang, Q. (2010) · IEEE Transactions on Neural Networks · doi:10.1109/tnn.2010.2091281 · Cited by 4,809 · cited 1×
“…the target environment 43 , data augmentation including the use of adversarial examples 44 , similarities between the source and target environments 45,46 , and semi-supervised learning that alternatively generate pseudo labels and incorporate them into re-training the model 47,48 have all…”
BackgroundDeep CORAL: Correlation Alignment for Deep Domain Adaptation
Sun, B., & Saenko, K. (2016) · Lecture Notes in Computer Science · doi:10.1007/978-3-319-49409-8_35 · Cited by 3,757
On the Opportunities and Risks of Foundation Models
Bommasani, R., Hudson, D. A., Adeli, E., Altman, R., Arora, S., von Arx, S., Bernstein, M. S., Bohg, J., Bosselut, A., Brunskill, E., et al. (2021) · arXiv · doi:10.48550/arxiv.2108.07258 · Cited by 2,676 · cited 1×
“For instance, models adapted from foundation models pre-trained on diverse datasets have displayed impressive performance gains in addition to robustness to various types of dataset shifts 42 .”
MethodScalable and accurate deep learning with electronic health records
Rajkomar, A., Oren, E., Chen, K., Dai, A. M., Hajaj, N., Hardt, M., Liu, P. J., Liu, X., Marcus, J., Sun, M., et al. (2018) · npj Digital Medicine · doi:10.1038/s41746-018-0029-1 · Cited by 2,648
Self-citationKhot, P. P., & Satav, S. (2015) · doi:10.21275/v4i11.nov151644 · Cited by 2,449
Research works printed but not linked: 3
- Varnik, V. Principles of risk minimization for learning theory. In Advances in Neural Information Processing Systems Vol. 4 (eds Moody, J. E. et al.) 831–838 (NeurIPS, 1991).
- Efron, B. & Tibshirani, R. An Introduction to the Bootstrap (Chapman & Hall, 1993). · DOI · Paper page
- Zhao, H., Combes, R. T. D., Zhang, K. & Gordon, G. On learning invariant representations for domain adaptation. In 36th International Conference on Machine Learning, ICML 2019 7523–7532 (PMLR, 2019).
Cited by
Sorted by citations
Algorithmic fairness in artificial intelligence for medicine and healthcare
Chen, R. J., Wang, J. J., Williamson, D. F. K., Chen, T. Y., Lipkova, J., Lu, M. Y., Sahai, S., & Mahmood, F. (2023) · Nature Biomedical Engineering · doi:10.1038/s41551-023-01056-8 · Cited by 750
“…dataset shift occurs when there is a mismatch between the distributions of the training and test datasets during algorithm development, (that is, P train ( X ) ≠ P test ( X ) and P train ( Y ) ≠ P test ( Y ) ), and may lead to disparate performance at the subgroup level 86,107,119,122,123 .”
BackgroundThe METRIC-framework for assessing data quality for trustworthy AI in medicine: A systematic review
Schwabe, D., Becker, K., Seyferth, M., Klaß, A., & Schaeffter, T. (2024) · npj Digital Medicine · doi:10.1038/s41746-024-01196-4 · Cited by 169
“3), which is based on our literature corpus 57, 74 – 192 .”
BackgroundWild-Time: A Benchmark of in-the-Wild Distribution Shift over Time
Yao, H., Choi, C., Cao, B.-C., Lee, Y., Koh, P. W., & Finn, C. (2022) · Neural Information Processing Systems · doi:10.48550/arxiv.2211.14238 · Cited by 150
“, 2021), and sepsis prediction (Guo et al., 2022) (see detailed comparison in Appendix A).”
BackgroundSujon, K. M., Hassan, R., Towshi, Z. T., Othman, M. A., Samad, M. A., & Choi, K. (2024) · IEEE Access · doi:10.1109/access.2024.3462434 · Cited by 143
“Various normalization methods with varying algorithms including NN were also tested in studies [17], [18], and [19] and improved forecasting accuracy was obtained in these studies.”
MethodEHR foundation models improve robustness in the presence of temporal distribution shift
Guo, L., Steinberg, E., Fleming, S. L., Posada, J., Lemmon, J., Pfohl, S. R., Shah, N. H., Fries, J., & Sung, L. (2023) · Scientific Reports · doi:10.1038/s41598-023-30820-8 · Cited by 65
Self-citationExplainable, Domain-Adaptive, and Federated Artificial Intelligence in Medicine
Chaddad, A., Lu, Q., Li, J., Katib, Y., Kateb, R., Tanougast, C., Bouridane, A., & Abdulkadir, A. (2023) · IEEE/CAA Journal of Automatica Sinica · doi:10.1109/jas.2023.123123 · Cited by 114
“1) Supervised, Semi-Supervised, and Unsupervised Domain Adaptation: Depending on the availability of annotation, DA applications can be classified as supervised [30], semisupervised [31], and unsupervised [32].”
MethodTowards Risk‐Free Trustworthy Artificial Intelligence: Significance and Requirements
Alzubaidi, L., Al-Sabaawi, A., Bai, J., Dukhan, A., Alkenani, A. H., Al‐Asadi, A., Alwzwazy, H. A., Manoufali, M., Fadhel, M. A., Albahri, A. S., et al. (2023) · International Journal of Intelligent Systems · doi:10.1155/2023/4459198 · Cited by 116
Akrout, M., Feriani, A., Bellili, F., Mezghani, A., & Hossain, E. (2023) · IEEE Communications Surveys & Tutorials · doi:10.1109/comst.2023.3326399 · Cited by 72
“Some work looked at temporal distributional shifts in clinical healthcare [182], [183] and climate [184] applications, but none of the prior work explored it in wireless communication.”
BackgroundWang, H. E., Landers, M., Adams, R., Subbaswamy, A., Kharrazi, H., Gaskin, D. J., & Saria, S. (2022) · Journal of the American Medical Informatics Association · doi:10.1093/jamia/ocac065 · Cited by 63
Piva, F. J., de Geus, D., & Dubbelman, G. (2023) · IEEE Winter Conference on Applications of Computer Vision · doi:10.1109/wacv56688.2023.00057 · Cited by 19
“In line with this, a recent study has proposed a setting to compare UDA and DG methods in a practical fashion [13], but it is focused on clinical medicine and addresses the effect of a temporal dataset shift, i.”
ResultAlgorithm Fairness in AI for Medicine and HealthcarePreprint
Chen, R. J., Chen, T., Lipková, J., Wang, J. J., Williamson, D. F. K., Lu, M. Y., Sahai, S., & Mahmood, F. (2021) · arXiv (Cornell University) · doi:10.48550/arxiv.2110.00603 · Cited by 31
“P train ( X ) (cid:54) = P test ( X ) , and has important intersections with fairness as differences between train and test distributions at the subgroup-level may lead to disparate performance 56,58–61 .”
BackgroundWOODS: Benchmarks for Out-of-Distribution Generalization in Time SeriesPreprint
Gagnon-Audet, J.-C., Ahuja, K., Darvishi-Bayazi, M.-J., Mousavi, P., Dumas, G., & Rish, I. (2022) · arXiv (Cornell University) · doi:10.48550/arxiv.2203.09978 · Cited by 30
“[37] investigated shifts when data is grouped according to the year in which they were gathered: the former used in-hospital mortality records and X-rays of the lungs, while the later used patients health record in the ICU.”
BackgroundMethodMachine Learning Operations in Health Care: A Scoping Review
Rajagopal, A., Ayanian, S., Ryu, A. J., Qian, R., Legler, S. R., Peeler, E. A., Issa, M., Coons, T. J., & Kawamoto, K. (2024) · Mayo Clinic Proceedings: Digital Health · doi:10.1016/j.mcpdig.2024.06.009 · Cited by 52
“32,33 Of these approaches, results from the transfer learning method were promising but were more complex to achieve than simple re fi tting.”
Expectations for Artificial Intelligence (AI) in Psychiatry
Monteith, S., Glenn, T., Geddes, J. R., Whybrow, P. C., Achtyes, E. D., & Bauer, M. (2022) · Current Psychiatry Reports · doi:10.1007/s11920-022-01378-5 · Cited by 61
“Since healthcare practices change over time, temporal dataset shifts occur, and the size of the shifts vary with the clinical outcome being predicted [102, 103].”
BackgroundArtificial intelligence in cancer: applications, challenges, and future perspectives
Cheng, H., & Shi, S.-S. (2025) · Molecular Cancer · doi:10.1186/s12943-025-02450-3 · Cited by 64
Huang, J., Xiang, Y., Gan, S., Wu, L., Yan, J., Dong, Y., & Zhang, J. (2025) · Discover Oncology · doi:10.1007/s12672-025-03307-3 · Cited by 61
“In parallel, Guo et al. proposed domain adaptation strategies that align latent feature distributions across domains using deep neural networks, effectively mitigating data drift across time and institutions [79].”
"Why did the Model Fail?": Attributing Model Performance Changes to Distribution ShiftsPreprint
Zhang, H., Singh, H., Ghassemi, M., & Joshi, S. D. (2022) · arXiv (Cornell University) · doi:10.48550/arxiv.2210.10769 · Cited by 3
“Such environments are prone to distribution shifts, which may lead to serious degradations in model performance (Guo et al., 2022; Chirra et al., 2018; When the performance of a model does degrade during deployment, it is crucial for the model developer to know not only which distributions have…”
BackgroundManyDG: Many-domain Generalization for Healthcare Applications
Yang, C., Westover, M., & Sun, J. (2023) · International Conference on Learning Representations · doi:10.48550/arxiv.2301.08834 · Cited by 40
“…Zhang et al., 2021; Gao et al., 2021) consider model generalization or adaptation across multiple clinical institutes (Reps et al., 2022; Zhang et al., 2021) or different time frames (Guo et al., 2022) with heuristic assumptions such as linear dependency (Li et al., 2020) in the feature space.”
BackgroundSilva, G. D. S., Barcellos, F., Wichmann, R. M., da Silva, F. C., & Chiavegatto, A. D. P. (2025) · Journal of Biomedical Informatics · doi:10.1016/j.jbi.2025.104902 · Cited by 37
MIRA: Medical Time Series Foundation Model for Real-World Health Data
Li, H., Deng, B., Xu, C., Feng, Z., Schlegel, V., Huang, Y.-H., Sun, Y.-Z., Sun, J.-Y., Yang, K.-L., Yu, Y.-Y., et al. (2025) · Neural Information Processing Systems · doi:10.48550/arxiv.2506.07584 · Cited by 32
“Moreover, such data is often collected in an irregular and asynchronous manner [10, 11], further complicating efforts to build generalizable models.”
Hama, T., Alsaleh, M. M., Allery, F., Choi, J. W., Tomlinson, C., Wu, H., Lai, A. G., Pontikos, N., & Thygesen, J. H. (2025) · Journal of Medical Internet Research · doi:10.2196/57358 · Cited by 35
“Assessing performance on different data distributions is crucial for outcome prediction [19,114].”
Salman, S. G., Phadke, R. A., Kumar, R., Momin, A. A., & Tavakkoli, A. (2026) · Spine Deformity · doi:10.1007/s43390-026-01365-3 · Cited by 24
Machine learning in biosignal analysis from wearable devices
Jeong, I., Chung, W. G., Kim, E., Park, W., Song, H., Lee, J., Oh, M., Kim, E., Paek, J., Lee, T., et al. (2025) · Materials Horizons · doi:10.1039/d5mh00451a · Cited by 40
Stable Cox regression for survival analysis under distribution shifts
Fan, S., Xu, R., Dong, Q., He, Y., Chang, C., & Cui, P. (2024) · Nature Machine Intelligence · doi:10.1038/s42256-024-00932-5 · Cited by 28
“Distribution shifts are inevitable in healthcare scenarios owing to training and test data that may be collected from different centres, standards of quantification method and subpopulation heterogeneity 6 .”
Ki, M., Kim, D. H., Abdelhamid, M. A. A., & Pack, S. P. (2025) · Biosensors · doi:10.3390/bios15110737 · Cited by 33
The Data Addition DilemmaPreprint
Shen, J. H., Raji, I. D., & Chen, I. Y. (2024) · arXiv (Cornell University) · doi:10.48550/arxiv.2408.04154 · Cited by 18
A roadmap to implementing machine learning in healthcare: from concept to practice
Yan, A. P., Guo, L. L., Inoue, J., Arciniegas, S. E., Vettese, E., Wolochacz, A., Crellin‐Parsons, N., Purves, B., Wallace, S., Patel, A., et al. (2025) · Frontiers in Digital Health · doi:10.3389/fdgth.2025.1462751 · Cited by 24
Self-citationGuo, L. L., Morse, K., Aftandilian, C. C., Steinberg, E., Fries, J., Posada, J., Fleming, S. L., Lemmon, J., Jessa, K., Shah, N. H., et al. (2024) · BMC Medical Informatics and Decision Making · doi:10.1186/s12911-024-02449-8 · Cited by 25
“It might be useful to characterize practice differences over time as temporal distribution shift can negatively impact model performance over time [28, 37].”
BackgroundSelf-citationContinual learning of longitudinal health records
Armstrong, J., & Clifton, D. A. (2022) · 2022 IEEE-EMBS International Conference on Biomedical and Health Informatics (BHI) · doi:10.1109/bhi56158.2022.9926878 · Cited by 21
A Textbook Remedy for Domain Shifts: Knowledge Priors for Medical Image Analysis
Yang, Y., Gandhi, M., Wang, Y.-F., Wu, Y., Yao, M. S., Callison-Burch, C., Gee, J. C., & Yatskar, M. (2024) · Neural Information Processing Systems · doi:10.48550/arxiv.2405.14839 · Cited by 21
“However, many studies show those methods do not improve over standard Empirical Risk Minimization (ERM) [67, 26, 33, 27].”
Guo, Y., Hu, C.-X., & Yang, Y. (2023) · Conference on Empirical Methods in Natural Language Processing · doi:10.48550/arxiv.2310.12620 · Cited by 21
“While temporal distribution shift has been studied in other contexts such as healthcare (Guo et al., 2022), there is no systematic empirical study of temporal distribution shift in the finance domain.”
BackgroundOut of distribution learning in bioinformatics: advancements and challenges
Shi, Y., Xu, W., & Hu, P. (2025) · Briefings in Bioinformatics · doi:10.1093/bib/bbaf294 · Cited by 25
Wang, H., & Xia, Y. (2022) · Biomedical Signal Processing and Control · doi:10.1016/j.bspc.2022.104488 · Cited by 20
Vatsal, S., Dubey, H., & Singh, A. (2026) · IEEE Access · doi:10.1109/access.2026.3651218 · Cited by 27
“Their necessity is evidenced by temporal dataset shifts degrading ICU prediction models in EHRs [108].”
Santosh, T. Y. S. S., Vuong, T.-Q., & Grabmair, M. (2024) · Annual Meeting of the Association for Computational Linguistics · doi:10.48550/arxiv.2405.14211 · Cited by 17
“…document classification (Röttger and Pierrehumbert, 2021; Chalkidis and Søgaard, 2022; Huang and Paul, 2018), abusive language detection (Jin et al., 2023; Florio et al., 2020), topic modeling (Zhang et al., 2023) and readmission prediction in the health care context (Guo et al., 2022, 2023a).”
BackgroundAI for colon cancer: A focus on classification, detection, and predictive modeling
Merabet, A., Saighi, A., Harous, S., Ferradji, M. A., Laboudi, Z., Almaktoom, A. T., Mousavirad, S. J., Elbatal, I., & Mohamed, A. W. (2025) · International Journal of Medical Informatics · doi:10.1016/j.ijmedinf.2025.106115 · Cited by 19
“This phenomenon, often termed model drift , has been documented to erode performance for clinical prediction and imag ing models across hospitals and time periods [98,99].”
Ma, Q.-H., Zhang, J., Li, Z.-K., Qi, L., Yu, Q., & Shi, Y.-H. (2025) · Computer Vision and Pattern Recognition · doi:10.1109/cvpr52734.2025.00488 · Cited by 15
“In recent years, domain shifts in real-world clinical scenarios have garnered significant attention, where labeled and unlabeled data are drawn from different distributions due to variations in equipment parameters, patient populations, and disease severity [18, 53, 57].”
Diagnosing and remediating harmful data shifts for the responsible deployment of clinical AI modelsPreprint
Subasri, V., Krishnan, A., Dhalla, A., Pandya, D., Malkin, D. M., Razak, F. A., Verma, A. A., Goldenberg, A., & Dolatabadi, E. (2023) · medRxiv · doi:10.1101/2023.03.26.23286718 · Cited by 14
“Instead, alternative ERM approaches (i.e. those that use stratified training, balanced subpopulation sampling, or worst-case model selection) outperform DG methods and show promise in mitigating model bias 50,51,60 .”
BackgroundMethodTime Matters: Examine Temporal Effects on Biomedical Language Models
Liu, W., He, Z., & Huang, X.-L. (2024) · AMIA ... Annual Symposium proceedings. AMIA Symposium · doi:10.48550/arxiv.2407.17638 · Cited by 13
“One line of close work 26, 27, 14 explored performance temporal variations of biomedical language models on the text classification task.”
BackgroundFerri, P., Lomonaco, V., Passaro, L., Castro, A. F.-D., Sánchez-Cuesta, P., Sáez, C., & Garcia-Gomez, J. M. (2024) · Computers in Biology and Medicine · doi:10.1016/j.compbiomed.2024.108548 · Cited by 13
Lee, M. K., Allareddy, V., Rampa, S., Elnagar, M. H., Oubaidin, M., Yadav, S., & Venugopalan, S. R. (2024) · Seminars in Orthodontics · doi:10.1053/j.sodo.2024.01.005 · Cited by 19
Cao, D.-F., El-Laham, Y., Trinh, L., Vyetrenko, S., & Liu, Y. (2022) · arXiv.org · doi:10.48550/arxiv.2211.11513 · Cited by 13
“For the time series dataset, [40] used in-hospital death records and lung x-rays to build distributional shift in the clinical setting, and [14] used patient health records from the ICU in grouping according to a year of data collection.”
MethodLemmon, J., Guo, L., Posada, J., Pfohl, S. R., Fries, J., Fleming, S., Aftandilian, C. C., Shah, N., & Sung, L. (2022) · Methods of Information in Medicine · doi:10.1055/s-0043-1762904 · Cited by 12
Self-citationAn Iterative Self-Learning Framework for Medical Domain Generalization
Wu, Z., Yao, H., Liebovitz, D., & Sun, J.-M. (2023) · Neural Information Processing Systems · doi:10.52202/075280-2393 · Cited by 12
“This assumption can become problematic when models are applied to new domains, such as data from different hospitals or future time points [17, 59, 20, 37].”
BackgroundMou, C., Yang, J., Wu, Q., Qin, L., & Lu, J. (2026) · Frontiers in Medicine · doi:10.3389/fmed.2026.1732164 · Cited by 12
MLHOps: Machine Learning Health Operations
Khattak, F. K., Subasri, V., Krishnan, A., Pou-Prom, C., Koçak, S. A., Dolatabadi, E., Pandya, D., Seyyed-Kalantari, L., & Rudzicz, F. (2024) · IEEE Access · doi:10.1109/access.2024.3521279 · Cited by 31
“However, it has been shown that for clinical AI models subject to real life data shifts, in contrast to synthetic perturbations, empirical risk minimization outperforms domain generalization and unsupervised domain adaptation methods [107], [323].”
Steinfeldt, J., Wild, B., Buergel, T., Pietzner, M., zu Belzen, J. U., Vauvelle, A., Hegselmann, S., Denaxas, S., Hemingway, H., Langenberg, C., et al. (2025) · Nature Communications · doi:10.1038/s41467-025-55879-x · Cited by 11
“Thus,predictivemodels can fail to learn robust and generalizable information 44 – 46 .”
Wang, R., Erus, G., Chaudhari, P., & Davatzikos, C. A. (2023) · PubMed · doi:10.48550/arxiv.2308.03175 · Cited by 1
Self-Aware SGD: Reliable Incremental Adaptation Framework for Clinical AI Models
Thakur, A., Armstrong, J., Youssef, A., Eyre, D. W., & Clifton, D. A. (2023) · IEEE Journal of Biomedical and Health Informatics · doi:10.1109/jbhi.2023.3237592 · Cited by 9
“Guo et al. [29] and Alves et al. [30] also tackled the problem of temporal shifts in the target population.”
BackgroundMalign Overfitting: Interpolation Can Provably Preclude Invariance
Wald, Y., Yona, G., Shalit, U., & Carmon, Y. (2022) · arXiv.org · doi:10.48550/arxiv.2211.15724 · Cited by 9
“This is especially noticeable when these methods are used with overparameterized deep models capable of interpolating , i.e., perfectly fitting the training data [20, 18, 21, 69, 37, 59, 12].”
MethodA Comprehensive Review of Trends, Applications and Challenges In Out-of-Distribution Detection
Ghassemi, N., & Fazl-Ersi, E. (2022) · arXiv.org · doi:10.48550/arxiv.2209.12935 · Cited by 9
Galuzio, P. P., & Cherif, A. (2022) · Advances in Chronic Kidney Disease · doi:10.1053/j.ackd.2022.07.002 · Cited by 12
Haberal, M., & Hançerlioğulları, D. (2026) · BMC Oral Health · doi:10.1186/s12903-025-07612-9 · Cited by 9
“…in the 2012/1 DUS examination, several models exhibited comparatively lower accuracy rates, which may suggest that the questions from this initial period possessed a distinctive level of difficulty or that the models had been trained less extensively on datasets reflective of that era [25, 32].”
Xiao, Y., Zhu, X., Wu, J., Luo, J., Quan, L., Xiong, R., & Chen, W. (2025) · Energy · doi:10.1016/j.energy.2025.138228 · Cited by 6
Diagnostic framework to validate clinical machine learning models locally on temporally stamped data
Schuessler, M., Fleming, S. L., Meyer, S., Seto, T., & Hernandez‐Boussard, T. (2025) · Communications Medicine · doi:10.1038/s43856-025-00965-w · Cited by 13
Fernández-Narro, D., Ferri, P., Gutiérrez‐Sacristán, A., Garcia-Gomez, J. M., & Sáez, C. (2025) · JMIR Medical Informatics · doi:10.2196/78309 · Cited by 5
What is different between these datasets?
Babbar, V., Guo, Z., & Rudin, C. (2024) · Journal of machine learning research · doi:10.48550/arxiv.2403.05652 · Cited by 7
“…about data generation and comparisons are important: they arise when we generate medical datasets to protect patient privacy [7, 51, 17], generate data to augment small datasets, study data from multiple related sources, or try to determine whether distribution shift has occurred [19, 8, 16, 59].”
BackgroundBhaskhar, N., Ip, W., Chen, J. H., & Rubin, D. L. (2023) · Journal of Biomedical Informatics · doi:10.1016/j.jbi.2023.104522 · Cited by 6
MLHOps: Machine Learning for Healthcare Operations
Khattak, F. K., Subasri, V., Krishnan, A., Dolatabadi, E., Pandya, D., Seyyed-Kalantari, L., & Rudzicz, F. (2023) · arXiv.org · doi:10.48550/arxiv.2305.02474 · Cited by 7
“minimization outperforms domain generalization and unsupervised domain adaptation methods [97] [294].”
DeepJoint: Robust Survival Modelling Under Clinical Presence Shift
Jeanselme, V., Martin, G., Peek, N., Sperrin, M., Tom, B. D. M., & Barrett, J. (2022) · arXiv.org · doi:10.48550/arxiv.2205.13481 · Cited by 7
“Detecting and measuring shifts have led to methodologies to alleviate these phenomena [41, 42], and to more robust clinical embeddings [37, 39, 43].”
BackgroundDomain Generalization and Adaptation in Intensive Care with Anchor Regression
Londschien, M., Burger, M., Rätsch, G., & Bühlmann, P. (2025) · Robotics: Science and Systems Conference · doi:10.48550/arxiv.2507.21783 · Cited by 6
“In contrast, large-scale empirical studies show mixed or negative results, with domain generalization models often failing to outperform simple baselines (Gulrajani and Lopez-Paz, 2021; Guo et al., 2022; Rockenschaub et al., 2024).”
Sun, X., Brouwer, E. D., Liu, C., Krishnaswamy, S., & Batra, R. (2025) · Scientific Reports · doi:10.1038/s41598-025-95079-7 · Cited by 5
Large-Scale Study of Temporal Shift in Health Insurance Claims
Ji, C. X., Alaa, A. M., & Sontag, D. (2023) · ACM Conference on Health, Inference, and Learning · doi:10.48550/arxiv.2305.05087 · Cited by 6
Decoupling Clinical and Class-Agnostic Features for Reliable Few-Shot Adaptation under Shift
Rahman, U., Imam, R., Yaqub, M., & Mahapatra, D. (2025) · UNSURE@MICCAI · doi:10.48550/arxiv.2509.09397 · Cited by 5
“Our contributions can be summarized as follows: Related Works: As healthcare data diversifies, domain generalization strategies [14,15,16] become essential for robust performance across patient populations and imaging conditions.”
Non-stationary Domain Generalization: Theory and AlgorithmPreprint
Pham, T.-H., Zhang, X., & Zhang, P. (2024) · PubMed · doi:10.48550/arxiv.2405.06816 · Cited by 3
“As evidenced by Guo et al. [2022], clinical predictive models trained under existing DA/DG methods cannot perform better on future clinical data compared to empirical risk minimization.”
BackgroundMethodXu, W., Huo, J., Cheng, G., Fu, J., Huang, X., Feng, J., & Jiang, J. (2022) · Frontiers in Pharmacology · doi:10.3389/fphar.2022.1037893 · Cited by 5
“The data used in this retrospective study were extracted from the Medical Information Mart for Intensive Care IV (MIMICIV) database (Guo et al., 2022), which contains comprehensive information on patients admitted in the Beth Israel Deaconess Medical Center (BIDMC) between 2008 and 2019, including 76,943 adult patient…”
MethodHarnessing Synthetic Data from Generative AI for Statistical InferencePreprint
Abdel-Azim, A., Wang, R., & Lin, X. (2026) · arXiv (Cornell University) · doi:10.48550/arxiv.2603.05396 · Cited by 8
“In a multi-site biomedical prediction task for example, a model may be trained on a “source” hospital dataset but deployed at a “target” hospital with different covariate distributions, measurement practices, or prevalence, so that predictors and outcomes follow different joint laws [41, 110].”
Out-of-distribution reject option method for dataset shift problem in early disease onset prediction
Tosaki, T., Uchino, E., Kojima, R., Mineharu, Y., Okamoto, Y., Arita, M., Miyai, N., Tamada, Y., Mikami, T., Murashita, K., et al. (2024) · Scientific Reports · doi:10.1038/s41598-025-01811-8 · Cited by 4
“Although domain adaptation and generalization techniques 34,35 have been explored for constructing such models, they require retraining neural network models, necessitating large sample sizes and data sharing across sites for fine-tuning.”
The Ethics of Going Deep: Challenges in Machine Learning for Sensitive Security Domains
Eusebi, A., Vasek, M., Cockbain, E., & Mariconti, E. (2022) · IEEE European Symposium on Security and Privacy Workshops (EuroS&PW) · doi:10.1109/eurospw55150.2022.00063 · Cited by 5
“There are other complementary approaches often developed for domain generalisation and unsupervised domain adaptation that instead “learn robust models by using data from multiple environments to identify invariant properties” (Guo et al., 2022).”
BackgroundT.y.s.s, S., & Vuong, T.-Q. (2025) · Proceedings of the conference - Association for Computational Linguistics. Meeting · doi:10.18653/v1/2025.acl-long.329 · Cited by 2
“…(Röttger and Pierrehumbert, 2021; Chalkidis and Søgaard, 2022; Huang and Paul, 2018; Santosh et al., 2024c), abusive language detection (Jin et al., 2023; Florio et al., 2020), topic modeling (Zhang et al., 2023b) and readmission prediction in the health care context (Guo et al., 2022, 2023a).”
Discovering Hierarchy-Grounded Domains with Adaptive Granularity for Clinical Domain Generalization
Hu, P., Han, X., Wang, F., & Ning, Y. (2026) · ACM International Conference on Information and Knowledge Management (CIKM) · doi:10.1145/3799682.3840625 · Cited by 3
“Thus, some studies treat each patient as a unique domain [11, 57], which is overly fine-grained and unstable for model training, and others rely on broader partitions (e.g. institute & admission year), which overlook clinical heterogeneity [14, 61].”
Steinfeldt, J., Wild, B., Buergel, T., Pietzner, M., zu Belzen, J. U., Vauvelle, A., Hegselmann, S., Denaxas, S., Hemingway, H., Langenberg, C., et al. (2024) · Nature Communications · doi:10.1038/s41467-024-48568-8 · Cited by 5
RetractedJeong, H., Jabbour, S., Yang, Y., Thapta, R., Mozannar, H., Han, W., Mehandru, N., Wornow, M., Lialin, V., Liu, X., et al. (2024) · arXiv (Cornell University) · doi:10.48550/arxiv.2403.01628 · Cited by 4
“Such shifts may occur slowly, as clinical guidelines and population characteristics change over time (Guo et al., 2022).”
BackgroundSelf-citationChamarthi, S., Fogelberg, K., Maron, R. C., Brinker, T., & Niebling, J. (2023) · arXiv.org · doi:10.48550/arxiv.2310.03432 · Cited by 3
“For this reason, we compare all UDA results to our unadapted baseline method (Src) trained on source dataset H, which is a basic ResNet50 model He et al. [2016] pretrained on ImageNet.”
BackgroundResultInfluentialGeneralization of finetuned transformer language models to new clinical contexts
Xie, K., Terman, S. W., Gallagher, R. S., Hill, C. E., Davis, K. A., Litt, B., Roth, D., & Ellis, C. A. (2023) · JAMIA Open · doi:10.1093/jamiaopen/ooad070 · Cited by 5
Steinfeldt, J., Wild, B., Buergel, T., Pietzner, M., zu Belzen, J. U., Vauvelle, A., Hegselmann, S., Denaxas, S., Hemingway, H., Langenberg, C., et al. (2023) · medRxiv · doi:10.1101/2023.03.10.23286918 · Cited by 1
“Thus, predictive models can fail to learn robust and generalisable information 39–41 .”
BackgroundLooking for Out-of-Distribution Environments in Critical Care: A case study with the eICU Database
Spathis, D., & Hyland, S. L. (2022) · arXiv.org · doi:10.48550/arxiv.2205.13398 · Cited by 2
Onah, C. O., Chukwuemeka, O. A., Yusuff, T. A., Abraham, E. E., Mounange-Badimi, M. S., Oladosu, T. A., & Okpalanwaka, I. F. (2025) · Cureus · doi:10.7759/cureus.95928 · Cited by 3
“Performance can drift over time as formularies, prescribing patterns, and patient behavior change; periodic updating/recalibration and shift monitoring are therefore required [10].”
Ferri, P., Sáez, C., Castro, A. F.-D., Sánchez-Cuesta, P., & Garcia-Gomez, J. M. (2025) · Artificial Intelligence in Medicine · doi:10.1016/j.artmed.2025.103264 · Cited by 3
Prediction of Survival Outcomes under Clinical Presence Shift: A Joint Neural Network Architecture
Jeanselme, V., Martin, G., Sperrin, M., Peek, N., Tom, B. D. M., & Barrett, J. (2025) · arXiv.org · doi:10.48550/arxiv.2508.05472 · Cited by 2
“Similarly, [25] show that domain generalisation or adaption techniques fail to improve trans-portability in the Mimic dataset across years.”
Optimal Empirical Risk Minimization under Temporal Distribution Shifts
Jeong, Y., Johari, R., Rothenhäusler, D., & Fox, E. B. (2025) · arXiv.org · doi:10.48550/arxiv.2507.13287 · Cited by 2
“Recent studies have demonstrated the impact of temporal distribution shifts across diverse domains, such as large language models, drug discovery, and visual recognition (Yao et al., 2023; Lazaridou et al., 2021; Huang et al., 2021; Guo et al., 2022).”
Robust Predictive Modeling Under Unseen Data Distribution Shifts: A Methodological Commentary
Duan, H., Yang, Y., Abbasi, A. F., & Tam, K. Y. (2026) · Information Systems Research · doi:10.1287/isre.2022.0537 · Cited by 2
“Although it does not incorporate robustness considerations, ERM remains the most widely used approach in predictive modeling and often achieves competitive results in practice (Cha et al. 2021, Zhang et al. 2021b, Guo et al. 2022, Pfohl et al. 2022). ii.”
Adversarial Validation in Image Classification Datasets by Means of Cumulative Spectral Gradient
Renza, D., Moya-Albor, E., & Chavarro, A. (2024) · Algorithms · doi:10.3390/a17110531 · Cited by 2
Ameen, S., Balachandran, R., & Theodoridis, T. (2024) · arXiv.org · doi:10.48550/arxiv.2406.13015 · Cited by 2
“Johnson et al. (2022) highlighted issues like data non-stationarity, model interpretability, and the quest for appropriate data representations [15, 16].”
BackgroundDumas, E., Hamy, A., Houzard, S., Hernández, E., Toussaint, A., Guérin, J., Chanas, L., de Castelbajac, V., Saint-Ghislain, M., Grandal, B., et al. (2022) · arXiv.org · doi:10.48550/arxiv.2211.08077 · Cited by 2
Wang, F., Xie, P.-L., Lin, X.-Q., Guan, J.-H., Liu, C., He, X.-X., Lee, T.-Y., Wei, L.-Y., Liu, X.-R., & Yao, L.-T. (2026) · BMC Biology · doi:10.1186/s12915-026-02508-8 · Cited by 1
“Real-world neurotoxin data are typically imbalanced and temporally dynamic, posing additional challenges for predictive modeling [24, 25].”
Hu, P.-F., Lu, C., Liu, F.-F., & Ning, Y. (2026) · arXiv.org · doi:10.48550/arxiv.2602.12542 · Cited by 1
“…potential in supporting predictive healthcare by learning longitudinal patient data from electronic health records (EHR), there is evidence that a model trained on one patient cohort often does not work well for another patient population (Pfohl et al., 2019; Guo et al., 2022; Yang et al., 2023a).”
Clinician-in-the-loop screening saturation: predicting annotation yield for efficient EHR review
Landschaft, A., Abdelmoity, L., Chafjiri, F. M. A., Puckett, M. A., Gettings, J. V., & Loddenkemper, T. (2025) · BMC Medical Informatics and Decision Making · doi:10.1186/s12911-025-03241-y · Cited by 1
“…prediction model trained on the data from 2008 to 2010 experienced a marked decline in AUROC (Area Under the Receiver Operating Characteristic curve) when tested on the data from 2017 to 2019 [15], thus underscoring the risks associated with using static models in temporally dynamic environments.”
Babel, S., Vanderpool, J., Inkel, M., Farach, S. M., Diaz, J. J., & Behbahaninia, M. (2025) · Journal of Surgical Research · doi:10.1016/j.jss.2025.05.014 · Cited by 2
A Multi-Centric Anthropomorphic 3D CT Phantom-Based Benchmark Dataset for Harmonization
Amirian, M., Bach, M., Jimenez-del-Toro, O., Aberle, C., Schaer, R., Andrearczyk, V., Maestrati, J.-F., Asiain, M. M., Flouris, K., Obmann, M., et al. (2025) · arXiv.org · doi:10.48550/arxiv.2507.01539 · Cited by 1
“Furthermore, deploying the models developed in practical applications demonstrated that generalization to training distribution data is not sufficient because the data distribution can also change over time [12].”
Guneysu, S., & Ayaz, A. M. B. (2026) · Healthcare · doi:10.3390/healthcare14213575
Zhao, J., Yang, Y., Zhu, P., Zheng, S., Xu, X., & zhou, X. (2026) · Frontiers in Public Health · doi:10.3389/fpubh.2026.1944057
AutoAdapt: Reliable Few-Shot Adaptation under Clinical Distribution Shifts
Wang, S., Peng, J., Hobley, D., Plotkin, Z., & Chen, T.-L. (2026) · doi:10.48550/arxiv.2610.11162
“This distinction is especially important in medicine because performance can vary with site, time, and care process (Zhang et al., 2021; Guo et al., 2022).”
Sun, H., Zhang, Y., Shi, Y., Ji, B., Li, C., Yang, J., Grzegorzek, M., & 郭启勇 (2026) · Medical Review · doi:10.1515/mr-2025-0083
“In addition, many reported results are derived from retrospective datasets, and performance can degrade under real-world conditions characterized by domain shifts, variable image quality, and heterogeneous patient populations [112].”
Model generalizability considerations in development and evaluation of SaMD
Leng, N., Lu, Y., Fridlyand, J., Tang, T. M., Qi, N. T., Wei, Y., Sanchez, R. R., Simon, N., & Alexander, G. (2026) · Journal of Biopharmaceutical Statistics · doi:10.1080/10543406.2026.2729800
Geis, R., & Erickson, B. J. (2026) · European Radiology · doi:10.1007/s00330-026-12879-9
Zheng, H., & Chen, W. (2026) · PLoS ONE · doi:10.1371/journal.pone.0357585
“The external-adaptation arm was also informed by clinical dataset-shift work, where robustness depends on how distributional change is handled at evaluation time [20].”
Beyond the Algorithm: A Stewardship Framework for the Hand Surgeon Adopting Artificial Intelligence
Cievet‐Bonfils, M., Burnier, M., & Locquet, V. (2026) · The Journal Of Hand Surgery · doi:10.1016/j.jhsa.2026.08.006
Thongprayoon, C., Aiumtrakul, N., Pesce, F., & Cheungpasitporn, W. (2026) · Risk Management and Healthcare Policy · doi:10.2147/rmhp.s618968
Gaikwad, A. S. (2026) · Current Pharmaceutical Analysis · doi:10.1016/j.cpan.2026.08.004
Metadata
- Authors
- Guo, L. L., Pfohl, S. R., Fries, J., Johnson, A. E. W., Posada, J., Aftandilian, C., Shah, N., & Sung, L.
- Affiliations
- Hospital for Sick Children (CA)
- Stanford University (US)
- Corresponding author
- Sung, Lillian
- ORCID
- Venue
- Scientific Reports
- Published
- 2022-02-17
- Volume
- 12
- Issue
- 1
- Pages
- 2726-2726
- ISSN
- 2045-2322 (ISSN-L)
- PMC
- PMC8854561
- OpenAlex
- W4221077687
- Cited by
- 103
- References
- 57
- Citations by year
- 2026: 34 · 2025: 29 · 2024: 15 · 2023: 15 · 2022: 9
- FWCI
- 5.59
- Type
- journal article
- Language
- en
- Open access
- gold
- doi.org
- Locations
- Scientific Reports (publishedVersion, cc-by)
- medRxiv (acceptedVersion, cc-by)
- PubMed Central (publishedVersion, cc-by)
- PubMed (publishedVersion)
- DOAJ (DOAJ: Directory of Open Access Journals) (submittedVersion, cc-by-sa)
- Topics
- Physical Sciences › Computer Science › Artificial Intelligence › Machine Learning in Healthcare
- Physical Sciences › Computer Science › Artificial Intelligence › Domain Adaptation and Few-Shot Learning
- Health Sciences › Medicine › Critical Care and Intensive Care Medicine › Sepsis Diagnosis and Treatment
- Keywords
- domain generalization, unsupervised domain adaptation, model robustness, clinical prediction model, intensive care unit patients, MIMIC-IV, sepsis prediction, mortality prediction, length of stay prediction, empirical risk minimization, clinical decision support systems, model calibration, feedforward neural networks
- MeSH terms
- Aged, Aged, 80 and over, Female, Humans, Intensive Care Units, Length of Stay, Male, Middle Aged, Models, Biological, Databases, Factual, Neural Networks, Computer, Sepsis
About these checks
Registry, retraction, Cites and statistics results are computed, not judged, with one exception: a printed reference that no index lists is read once by a model before it counts as a citation error. Claims are extracted by a model and kept only when their quote appears verbatim in the text; each cited source is then checked, with a model’s help, for whether it says what the claim relies on. Those verdicts can be wrong — read the claim’s quote and the cited source before relying on one.
Statistics and arithmetic are recomputed, not judged.
Confidence bands are shown only for fields calibrated on our annotated test set. None is calibrated yet, so no band is shown.
What counts as a claim ›How we measure confidence ›How we check this ›
Are you an author, or do you see a problem with this page? Request a review
