

The DOI matches its Crossref record; 10 of the 10 references it cites were found in a registry or an index.
Accurate prediction by AlphaFold2 for ligand binding in a reductive dehalogenase and implications for PFAS (per-and polyfluoroalkyl substance) biodegradation
Published version of a preprint
Abstract
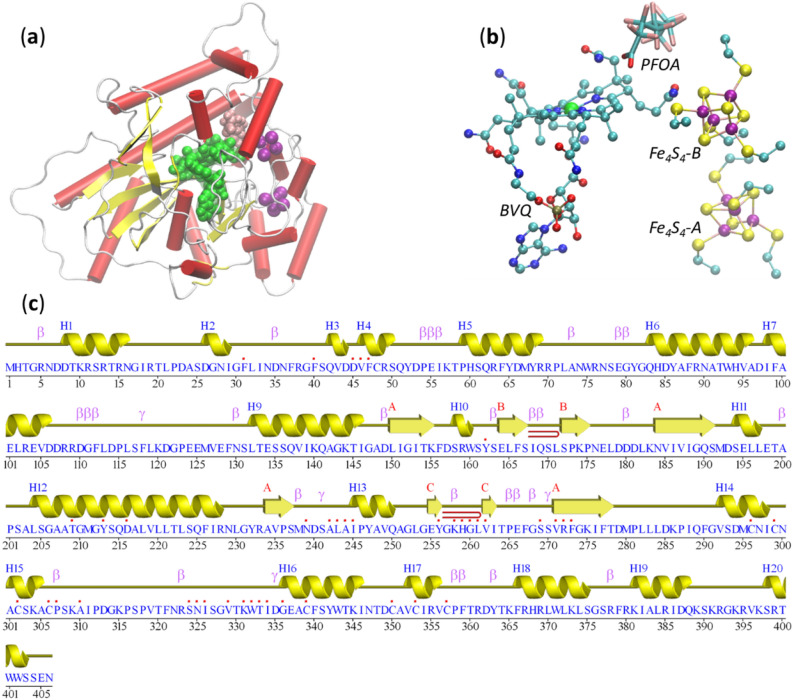
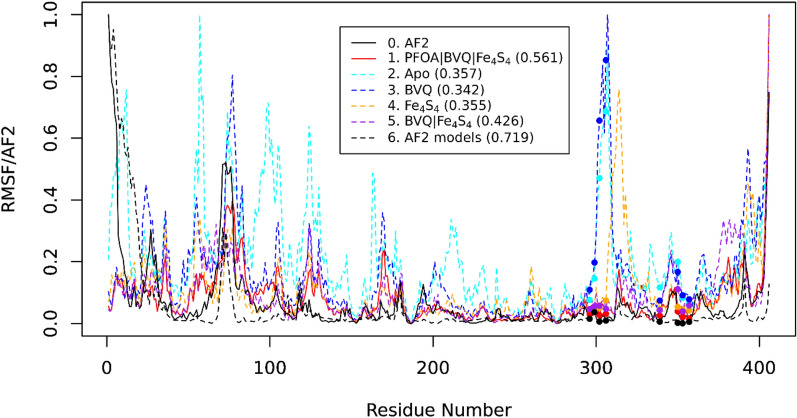
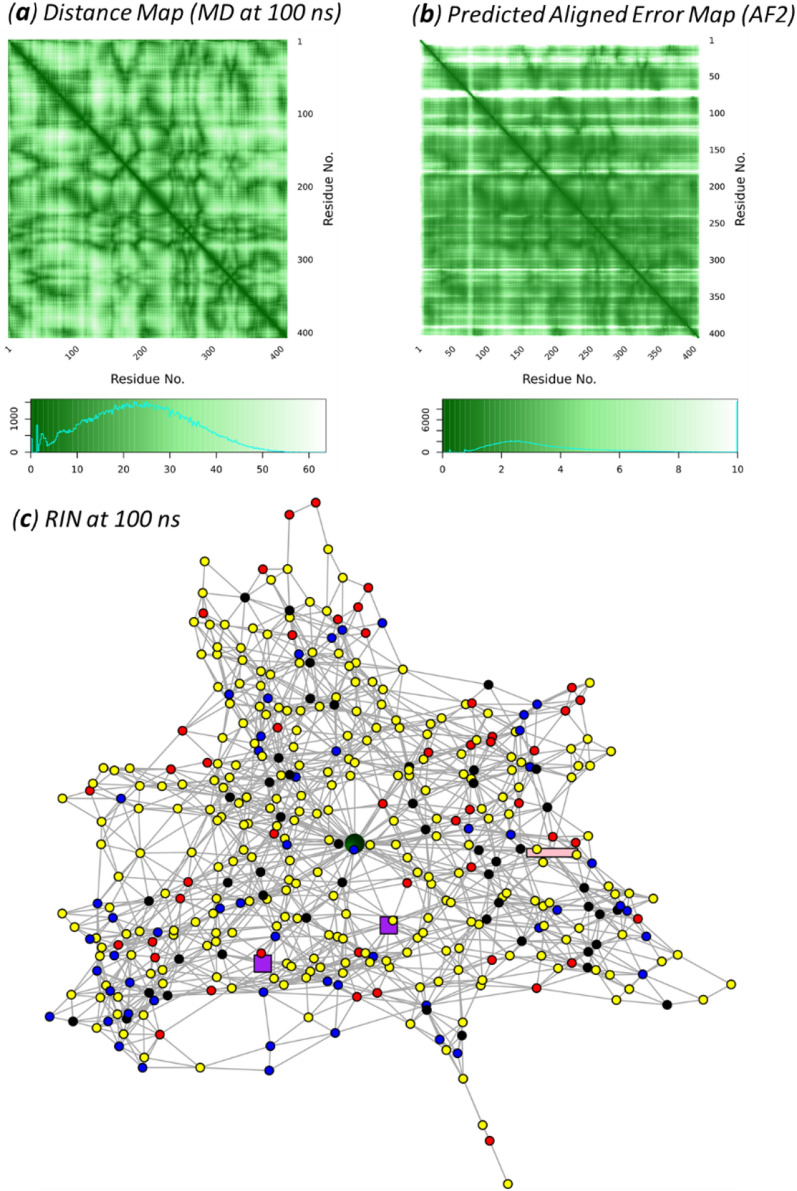
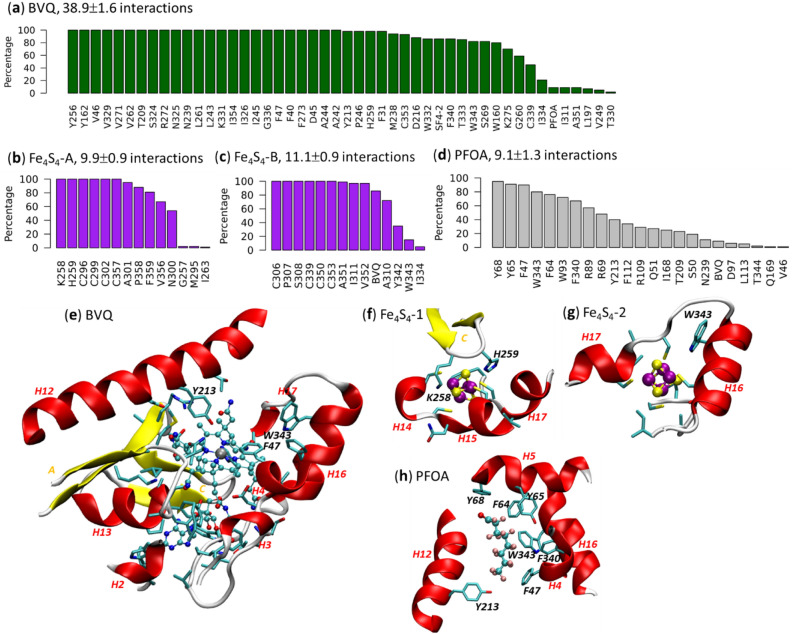
Despite the success of AlphaFold2 (AF2), it is unclear how AF2 models accommodate for ligand binding. Here, we start with a protein sequence from Acidimicrobiaceae TMED77 (T7RdhA) with potential for catalyzing the degradation of per- and polyfluoroalkyl substances (PFASs). AF2 models and experiments identified T7RdhA as a corrinoid iron-sulfur protein (CoFeSP) which uses a norpseudo-cobalamin (BVQ) cofactor and two Fe 4 S 4 iron-sulfur clusters for catalysis. Docking and molecular dynamics simulations suggest that T7RdhA uses perfluorooctanoic acetate (PFOA) as a substrate, supporting the reported defluorination activity of its homolog, A6RdhA. We showed that AF2 provides processual (dynamic) predictions for the binding pockets of ligands (cofactors and/or substrates). Because the pLDDT scores provided by AF2 reflect the protein native states in complex with ligands as the evolutionary constraints, the Evoformer network of AF2 predicts protein structures and residue flexibility in complex with the ligands, i.e., in their native states. Therefore, an apo-protein predicted by AF2 is actually a holo-protein awaiting ligands.
Overview
The claims and statistics of this paper haven’t been checked yet.
Run the check — free, no account needed. It reads the open-access text and checks the sources it cites.
Integrity signals
Registry
Cites
Statistics
Figures
Verification
Claims the paper makes
The claims and statistics of this paper haven’t been checked yet.
Run the check — free, no account needed. It reads the open-access text and checks the sources it cites.
Claims other papers make about this one
Each is checked against this paper’s own text: does it say what the citing paper says it does?
In the citing paper
“Moreover, results from docking and molecular dynamics simulations implied that T7RdhA could potentially use PFOA as a substrate (105).”
From Toward the development of a molecular toolkit for the microbial remediation of per-and polyfluoroalkyl substances (2024) · cites this paper as [105]
In the citing paper
“However, in subsequent sequence mining using the incomplete Acidimicrobium sp. strain A6 gene (referred to as A6RdhA), Guo et al. (105) found a full-length gene encoding a protein named T7RdhA from the Acidimicrobium strain TMED77 in a metagenomic assembly of marine microorganisms that shares 97.67% sequence identity with the partial A6RdhA protein.”
From Toward the development of a molecular toolkit for the microbial remediation of per-and polyfluoroalkyl substances (2024) · cites this paper as [105]
Self-check
Percentages, sums and reported differences re-computed from the paper’s own numbers.
The self-check needs the paper’s full text.
Citations
Cites
Highly accurate protein structure prediction with AlphaFold
Jumper, J., Evans, R., Pritzel, A., Green, T., Figurnov, M., Ronneberger, O., Tunyasuvunakool, K., Bates, R., Žídek, A., Potapenko, A., et al. (2021) · Nature · doi:10.1038/s41586-021-03819-2 · Cited by 43,764
Accurate prediction of protein structures and interactions using a 3-track network
Baek, M., DiMaio, F., Anishchenko, I., Dauparas, J., Ovchinnikov, S., Lee, G. R., Wang, J., Cong, Q., Kinch, L. N., Schaeffer, R. D., et al. (2021) · doi:10.1101/2021.06.14.448402 · Cited by 5,549
Protein complex prediction with AlphaFold-Multimer
Evans, R., O’Neill, M., Pritzel, A., Antropova, N., Senior, A., Green, T., Žídek, A., Bates, R., Blackwell, S., Yim, J., et al. (2021) · doi:10.1101/2021.10.04.463034 · Cited by 3,808
Highly accurate protein structure prediction for the human proteome
Tunyasuvunakool, K., Adler, J., Wu, Z., Green, T., Zielinski, M., Žídek, A., Bridgland, A., Cowie, A., Meyer, C., Laydon, A., et al. (2021) · Nature · doi:10.1038/s41586-021-03828-1 · Cited by 3,025
Iron-sulfur clusters: nature's modular, multipurpose structures
Beinert, H., Holm, R. H., & Münck, E. (1997) · Science · doi:10.1126/science.277.5326.653 · Cited by 1,944
Improved prediction of protein-protein interactions using AlphaFold2
Bryant, P., Pozzati, G., & Elofsson, A. (2021) · doi:10.1101/2021.09.15.460468 · Cited by 1,022
Huang, S., & Jaffé, P. R. (2019) · Environmental Science & Technology · doi:10.1021/acs.est.9b04047 · Cited by 524
Using AlphaFold to predict the impact of single mutations on protein stability and function
Pak, M. A., Markhieva, K. A., Novikova, M. S., Petrov, D. S., Vorobyev, I. S., Maksimova, E. S., Kondrashov, F. A., & Ivankov, D. N. (2023) · PLOS One · doi:10.1371/journal.pone.0282689 · Cited by 322 · cited 2×
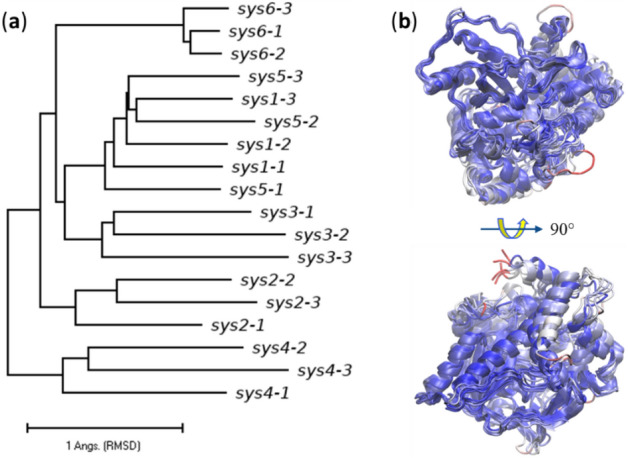
“To answer this question, we performed MD simulations on five different systems: (1) T7RdhA complexed with BVQ, two Fe4S4 clusters (Fe4S4-A and Fe4S4-B) and the PFOA substrate; (2) apo-T7RdhA with no ligand; (3) T7RdhA complexed with BVQ; (4) T7RdhA complexed with two Fe4S4 clusters; and (5) T7RdhA complexed 3 Vol.:(01…”
MethodInfluentialAlphaFold2 Can Predict Single-Mutation Effects
McBride, J. M., Polev, K., Abdirasulov, A., Reinharz, V., Grzybowski, B. A., & Tlusty, T. (2023) · Physical Review Letters · doi:10.1103/physrevlett.131.218401 · Cited by 87
Predicting the pathogenicity of missense variants using features derived from AlphaFold2
Schmidt, A., Röner, S., Mai, K., Klinkhammer, H., Kircher, M., & Ludwig, K. U. (2023) · Bioinformatics · doi:10.1093/bioinformatics/btad280 · Cited by 79
Research works printed but not linked: 58
- Buel, G. R. & Walters, K. J. Can alphafold2 predict the impact of missense mutations on structure?. Nat. Struct. Mol. Biol. 29, 1–2 (2022). · DOI · Paper page
- Bagdonas, H., Fogarty, C. A., Fadda, E. & Agirre, J. The case for post-predictional modifications in the AlphaFold protein structure database. Nat. Struct. Mol. Biol. 28, 869–870 (2021). · DOI
- Guo, H.-B. et al. AlphaFold2 models indicate that protein sequence determines both structure and dynamics. Sci. Rep. 12, 10696 (2022). · DOI · Paper page
- Kendrew, J. C. et al. A three-dimensional model of the myoglobin molecule obtained by X-ray analysis. Nature 181, 662–666 (1958). · DOI
- Fischer, E. Einfluss der configuration auf die wirkung der enzyme. Ber. Dtsch. Chem. Ges. 27, 2985–2993 (1894). · DOI
- Koshland, D. E. Jr. Application of a theory of enzyme specificity to protein synthesis. Proc. Natl. Acad. Sci. USA 44, 98–104 (1958). · DOI
- Koshland, D. E. Jr. The key-lock theory and the induced fit theory. Angew. Chem. Int. Ed. Engl. 33, 2375–2378 (1994). · DOI
- Monod, J., Wyman, J. & Changeux, J.-P. On the nature of allosteric transitions: a plausible model. J. Mol. Biol. 12, 88–118 (1965). · DOI
- Changeux, J.-P. & Edelstein, S. Conformational selection or induced fit? 50 years of debate resolved. F1000 Biol. Rep. 3, 19 (2011). · DOI
- Najmanovich, R. J. Evolutionary studies of ligand binding sites in proteins. Curr. Opin. Struct. Biol. 45, 85–90 (2017). · DOI
- Skolnick, J. & Gao, M. Interplay of physics and evolution in the likely origin of protein biochemical function. Proc. Natl. Acad. Sci. USA 110, 9344–9349 (2013). · DOI
- Lu, H. et al. Machine learning-aided engineering of hydrolases for PET depolymerization. Nature 604, 662–667 (2022). · DOI
- Wackett, L. P. & Robinson, S. L. The ever-expending limits of enzyme catalysis and biodegradation: Polyaromatic, poly chlorinated, polyfluorinated and polymeric compounds. Biochem. J. 477, 2875–2891 (2020). · DOI · Paper page
- Varadi, M. et al. AlphaFold Protein Structure Database: Massively expanding the structural coverage of protein-sequence space with high-accuracy models. Nucleic Acids Res. 50, D439–D444 (2022). · DOI · Paper page
- Berman, H. M. et al. The protein data bank. Nucleic Acids Res. 28, 235–242 (2000). · DOI · Paper page
- Goodsell, D. S. et al. RCSB protein data bank: Enabling biomedical research and drug discovery. Protein Sci. 29, 52–65 (2020). · DOI
- Duarte, J. M., Dutta, S., Goodsell, D. S. & Burley, S. K. Exploring protein symmetry at the RCSB protein data bank. Emerg. Top. Life Sci. https://doi.org/10.1042/ETLS20210267 (2022). · DOI
- Mukhopadhyay, A. et al. Finding enzyme cofactors in protein data bank. Bioinformatics 35, 3510–3511 (2019). · DOI
- Stierand, S. & Rarey, M. Drawing the PDB: Protein–ligand complexes in two dimensions. ACS Med. Chem. Lett. 1, 540–545 (2010). · DOI
- Gao, M., An, D. N., Parks, J. M. & Skolnick, J. AF2Complex predicts physical interactions in multimeric proteins with deep learning. Nature Commun. 13, 1744 (2022). · DOI · Paper page
- Bommer, M. et al. Structural basis for organohalide respiration. Science 346, 455–458 (2014). · DOI · Paper page
- Payne, K. A. et al. Reductive dehalogenase structure suggests a mechanism for B12-dependent dehalogenation. Nature 517, 513–516 (2015). · DOI
- Tully, B. J., Sachdeva, R., Graham, E. D. & Heidelberg, J. F. 290 metagenome-assembled genomes from the Mediterranean Sea: A resource for marine microbiology. PeerJ 5, e3558 (2017). · DOI
- Stank, A., Kokh, D. B., Fuller, J. C. & Wade, R. C. Protein binding pocket dynamics. Acc. Chem. Res. 49, 809–815 (2016). · DOI
- Pruitt, K. D., Tatusova, T. & Maglott, D. R. NCBI Reference Sequence (RefSeq): A curated non-redundant sequence database of genomes, transcripts and proteins. Nucleic Acids Res. 33, D501–D504 (2005). · DOI
- Cooper, C. J. et al. Structure determination of the HgcAB complex using metagenome sequence data: Insights into microbial mercury methylation. Commun. Biol. 3, 320 (2020). · DOI
- Halliwell, T., Fisher, K., Payne, K. A. P., Rigby, S. E. J. & Leys, D. Catabolic reductive dehalogenase substrate complex structures underpin rational repurposing of substrate scope. Microorganisms 8, 1344 (2020). · DOI · Paper page
- Kunze, C. et al. Cobamide-mediated enzymatic reductive dehalogenation via long-range electron transfer. Nat. Commun. 8, 15858 (2017). · DOI · Paper page
- Laskowski, R. A. & Thornton, J. M. PDBsum extras: SARS-CoV-2 and AlphaFold models. Prot. Sci. 31, 283–289 (2022). · DOI
- Du, Z. et al. The trRosetta server for fast and accurate protein structure prediction. Nat. Protoc. 16, 5634–5651 (2022). · DOI
- Clementel, D. et al. Ring 30: Fast generation of probabilistic residue interaction networks from structural ensembles. Nucleic Acids Res. 50, W651–W656 (2022). · DOI
- Wittung-Stafshede, P. Role of cofactors in protein folding. Acc. Chem. Res. 35, 201–208 (2002). · DOI
- Xu, Q., Guo, H.-B., Wlodawer, A. & Guo, H. The importance of dynamics in substrate-assisted catalysis and specificity. J. Am. Chem. Soc. 128, 5994–5995 (2006). · DOI
- Hekkelman, M. L., de Vries, I., Joosten, R. P. & Perrakis, A. AlphaFill: Enriching the AlphaFold models with ligands and co-factors. bioRxiv 2021. https://doi.org/10.1101/2021.11.26.470110. · DOI · Paper page
- Chang, L. & Perez, A. AlphaFold encodes the principles to identify high affinity peptide binders. bioRxiv 2022. https://doi.org/10.1101/2022.03.18.484931. · DOI
- Krautler, B. et al. The cofactor of tetrachloroethene reductive dehalogenase of Dehalospirillum multivorans is norpseudo-B12, a new type of natural corrinoid. Helvetica 86, 3698–3716 (2003). · DOI · Paper page
- Jaeger, J. & Monk, N. Everything flows: A process perspective of life. EMBO Rep. 16, 1064–1067 (2015). · DOI
- Buck, R. C. et al. Perfluoroalkyl and polyfluoroalkyl substances in the environment: Terminology, classification, and origins. Integr. Environ. Assess. Manag. 7, 513–541 (2011). · DOI · Paper page
- Ruiz-Uriguen, M., Shuai, W., Huang, S. & Jaffe, P. R. Biodegradation of PFOA in microbial electrolysis cells by Acidimicrobiaceae sp. Strain A6. Chemosphere 292, 133506 (2022). · DOI · Paper page
- Katoh, K. & Standley, D. M. MAFFT multiple sequence alignment software version 7: Improvements in performance and usability. Mol. Biol. Evol. 30, 772–780 (2013). · DOI · Paper page
- Finn, R. D., Clements, J. & Eddy, S. R. HMMER web server: Interactive sequence similarity searching. Nucleic Acids Res. 39, W29–W37 (2011). · DOI · Paper page
- Zallot, R., Oberg, N. & Gerlt, J. A. The EFI web resource for genomic enzymology tools: Leveraging protein, genome, and metagenome databases to discover novel enzymes and metabolic pathways. Biochemistry 58, 4169–4182 (2019). · DOI
- Han, W.-S., Lee, J., Pham, M.-D. & Yu, J. X. iGraph: A framework for comparisons of disk-based graph indexing techniques. Proc. VLDB Endow. 3, 449–459 (2010). · DOI
- Crooks, G. E., Hon, G., Chandonia, J.-M. & Brenner, S. E. WebLogo: A sequence logo generator. Genome Res. 14, 1188–1190 (2004). · DOI
- Zhang, Y. & Skolnick, J. TM-align: A protein structure alignment algorithm based on the TM-score. Nucleic Acids Res. 33, 2302–2309 (2005). · DOI · Paper page
- Paradis, E., Claude, J. & Strimmer, K. APE: Analyses of phylogenetics and evolution in R language. Bioinformatics 20, 289–290 (2004). · DOI · Paper page
- Kumar, S., Stecher, G., Li, M., Knyaz, C. & Tamura, K. MEGA X: Molecular evolutionary genetics analysis across computing platforms. Mol. Biol. Evol. 35, 1547–1549 (2018). · DOI
- Phillips, J. C. et al. Scalable molecular dynamics with NAMD. J. Comput. Chem. 26, 1781–1802 (2005). · DOI · Paper page
- Huang, J. et al. CHARMM36m: An improved force field for folded and intrinsically disordered proteins. Nat. Methods 14, 71–73 (2017). · DOI
- MacKerell, A. D. et al. All-atom empirical potential for molecular modeling and dynamics studies of proteins. J. Phys. Chem. B 102, 3586–3616 (1998). · DOI
- Price, D. J. & Brooks, C. L. 3rd. A modified TIP3P water potential for simulation with Ewald summation. J. Chem. Phys. 121, 10096–10103 (2004). · DOI
- Pavlova, A., Parks, J. M. & Gumbart, J. C. Development of CHARMM-compatible force-field parameters for cobalamin and related cofactors from quantum mechanical calculations. J. Chem. Theory Comput. 14, 784–798 (2018). · DOI
- Carvalho, A. T. P. & Swart, M. Electronic structure investigation and parametrization of biologically relevant iron-sulfur clusters. J. Chem. Inf. Model. 54, 613–620 (2014). · DOI
- Brooks, B. R. et al. CHARMM: the biomolecular simulation program. J. Comput. Chem. 30, 1545–1614 (2009). · DOI
- Humphrey, W., Dalke, A. & Schulten, K. VMD: Visual molecular dynamics. J. Mol. Graph. 14, 33–38 (1996). · DOI · Paper page
- Guo, H.-B., Beahm, R. F. & Guo, H. Stabilization and destabilization of the Cδ-H…OC hydrogen bonds involving proline residues in helices. J. Phys. Chem. B. 108, 18065–18072 (2004). · DOI
- Grant, B. J., Skjaerven, L. & Yao, X.-Q. The Bio3D packages for structural bioinformatics. Protein Sci. 30, 20–30 (2021). · DOI
- Trott, O. & Olson, A. J. AutoDock Vina: Improving the speed and accuracy of docking with a new scoring function, efficient optimization and multithreading. J. Comput. Chem. 31, 455–461 (2010). · DOI · Paper page
Cited by
Sorted by citations
Hu, M., & Scott, C. (2024) · Applied and Environmental Microbiology · doi:10.1128/aem.00157-24 · Cited by 63
AlphaFold2 modeling and molecular dynamics simulations of an intrinsically disordered protein
Guo, H.-B., Huntington, B., Perminov, A., Smith, K., Hastings, N., Dennis, P., Kelley-Loughnane, N., & Berry, R. (2024) · PLOS ONE · doi:10.1371/journal.pone.0301866 · Cited by 13
Self-citation
Metadata
- Authors
- Guo, H.-B., Varaljay, V. A., Kedziora, G., Taylor, K., Farajollahi, S., Lombardo, N., Harper, E., Hung, C., Gross, M., Perminov, A., Dennis, P., Kelley-Loughnane, N., & Berry, R.
- Venue
- Scientific Reports
- Published
- 2023-03-11
- Volume
- 13
- Issue
- 1
- ISSN
- 2045-2322
- PMC
- PMC10008544
- Cited by
- 22
- References
- 10
- Language
- en
- Funders
- OUSD (R&E) ARAP Program
About these checks
Registry, retraction, Cites and statistics results are computed, not judged, with one exception: a printed reference that no index lists is read once by a model before it counts as a citation error. Claims are extracted by a model and kept only when their quote appears verbatim in the text; each cited source is then checked, with a model’s help, for whether it says what the claim relies on. Those verdicts can be wrong — read the claim’s quote and the cited source before relying on one.
Statistics and arithmetic are recomputed, not judged.
Confidence bands are shown only for fields calibrated on our annotated test set. None is calibrated yet, so no band is shown.
What counts as a claim ›How we measure confidence ›How we check this ›
Are you an author, or do you see a problem with this page? Request a review
