

The DOI matches its Crossref record; 10 of the 10 references it cites were found in a registry or an index.
Predicting the probability of death using proteomics
Abstract
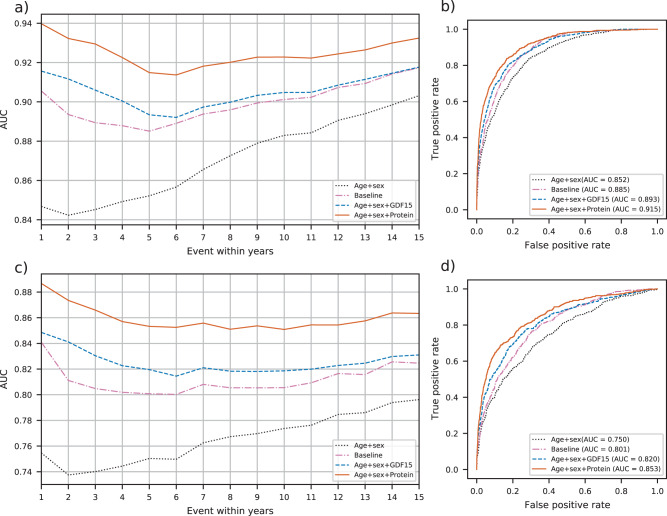
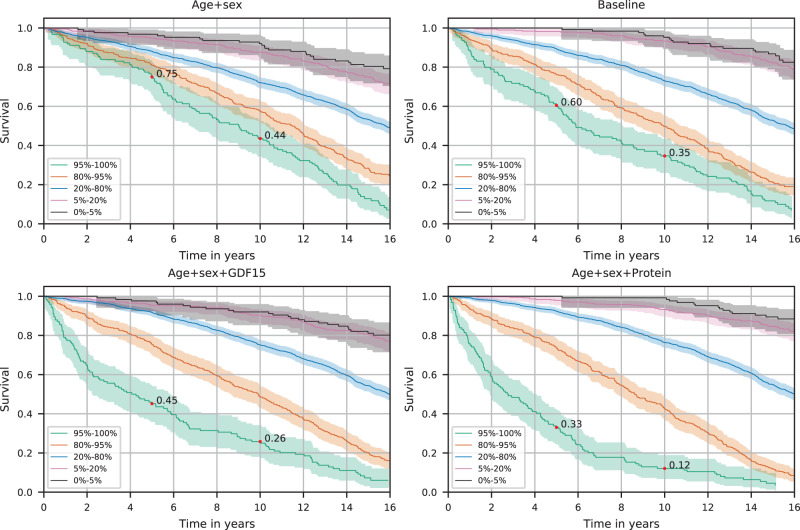
Predicting all-cause mortality risk is challenging and requires extensive medical data. Recently, large-scale proteomics datasets have proven useful for predicting health-related outcomes. Here, we use measurements of levels of 4,684 plasma proteins in 22,913 Icelanders to develop all-cause mortality predictors both for short- and long-term risk. The participants were 18-101 years old with a mean follow up of 13.7 (sd. 4.7) years. During the study period, 7,061 participants died. Our proposed predictor outperformed, in survival prediction, a predictor based on conventional mortality risk factors. We could identify the 5% at highest risk in a group of 60-80 years old, where 88% died within ten years and 5% at the lowest risk where only 1% died. Furthermore, the predicted risk of death correlates with measures of frailty in an independent dataset. Our results show that the plasma proteome can be used to assess general health and estimate the risk of death.
Overview
The claims and statistics of this paper haven’t been checked yet.
Run the check — free, no account needed. It reads the open-access text and checks the sources it cites.
Integrity signals
Registry
Cites
Statistics
Figures
Verification
Claims the paper makes
The claims and statistics of this paper haven’t been checked yet.
Run the check — free, no account needed. It reads the open-access text and checks the sources it cites.
Claims other papers make about this one
Each is checked against this paper’s own text: does it say what the citing paper says it does?
The source backs part of the claim, not all of it — or backs it for a different population, condition or comparison.
In the citing paper
“For example, Huan et. al 32,33 and Deelen et al 34 reported increased mortality risk (HRs of 1.85 and 2.73) for their epigenetic and metabolomic biomarkers, respectively.”
From Validation of biomarkers of aging (2024) · cites this paper as [34]
Experimental — accuracy not yet measuredThe check wasn’t confident either way, so it gives no verdict — never disputed.
In the citing paper
“Similarly, metabolomic or proteomic data could be collected from plasma or serum, leading to different data distributions 34; measured using different technologies (e.g. mass spectrometry or aptamer-based assays); or tagged using different nomenclature39.”
From Validation of biomarkers of aging (2024) · cites this paper as [34]
Experimental — accuracy not yet measured
Self-check
Percentages, sums and reported differences re-computed from the paper’s own numbers.
The self-check needs the paper’s full text.
Citations
Cites
Assarsson, E., Lundberg, M., Holmquist, G., Björkesten, J., Bucht Thorsen, S., Ekman, D., Eriksson, A., Rennel Dickens, E., Ohlsson, S., Edfeldt, G., et al. (2014) · PLoS ONE · doi:10.1371/journal.pone.0095192 · Cited by 1,874
Association between telomere length in blood and mortality in people aged 60 years or older
Cawthon, R. M., Smith, K. R., O'Brien, E., Sivatchenko, A., & Kerber, R. A. (2003) · The Lancet · doi:10.1016/s0140-6736(03)12384-7 · Cited by 1,761
Aptamer-Based Multiplexed Proteomic Technology for Biomarker Discovery
Gold, L., Ayers, D., Bertino, J., Bock, C., Bock, A., Brody, E. N., Carter, J., Dalby, A. B., Eaton, B. E., Fitzwater, T., et al. (2010) · PLoS ONE · doi:10.1371/journal.pone.0015004 · Cited by 1,754
Undulating changes in human plasma proteome profiles across the lifespan
Lehallier, B., Gate, D., Schaum, N., Nanasi, T., Lee, S. E., Yousef, H., Moran Losada, P., Berdnik, D., Keller, A., Verghese, J., et al. (2019) · Nature Medicine · doi:10.1038/s41591-019-0673-2 · Cited by 981
Plasma protein patterns as comprehensive indicators of health
Williams, S. A., Kivimaki, M., Langenberg, C., Hingorani, A. D., Casas, J. P., Bouchard, C., Jonasson, C., Sarzynski, M. A., Shipley, M. J., Alexander, L., et al. (2019) · Nature Medicine · doi:10.1038/s41591-019-0665-2 · Cited by 506
DNA methylation signatures in peripheral blood strongly predict all-cause mortality
Zhang, Y., Wilson, R., Heiss, J., Breitling, L. P., Saum, K.-U., Schöttker, B., Holleczek, B., Waldenberger, M., Peters, A., & Brenner, H. (2017) · Nature Communications · doi:10.1038/ncomms14617 · Cited by 382
Fischer, K., Kettunen, J., Würtz, P., Haller, T., Havulinna, A. S., Kangas, A. J., Soininen, P., Esko, T., Tammesoo, M.-L., Mägi, R., et al. (2014) · PLoS Medicine · doi:10.1371/journal.pmed.1001606 · Cited by 344
Plasma proteomic biomarker signature of age predicts health and life span
Tanaka, T., Basisty, N., Fantoni, G., Candia, J., Moore, A. Z., Biancotto, A., Schilling, B., Bandinelli, S., & Ferrucci, L. (2020) · eLife · doi:10.7554/elife.61073 · Cited by 213
Baek, S. J., & Eling, T. (2019) · Pharmacology & Therapeutics · doi:10.1016/j.pharmthera.2019.02.008 · Cited by 194
Stability and reproducibility of proteomic profiles measured with an aptamer-based platform
Kim, C. H., Tworoger, S. S., Stampfer, M. J., Dillon, S. T., Gu, X., Sawyer, S. J., Chan, A. T., Libermann, T. A., & Eliassen, A. H. (2018) · Scientific Reports · doi:10.1038/s41598-018-26640-w · Cited by 170
Research works printed but not linked: 41
- Glare, P. et al. Predicting survival in patients with advanced disease. Eur. J. Cancer 44, 1146–1156 (2008). · DOI
- Hippisley-Cox, J. & Coupland, C. Development and validation of QMortality risk prediction algorithm to estimate short term risk of death and assess frailty: cohort study. BMJ 358, j4208 (2017). · DOI
- Flegal, K. M., Kit, B. K., Orpana, H. & Graubard, B. I. Association of all-cause mortality with overweight and obesity using standard body mass index categories: a systematic review and meta-analysis. JAMA 309, 71–82 (2013). · DOI · Paper page
- Danaei, G. et al. The preventable causes of death in the United States: comparative risk assessment of dietary, lifestyle, and metabolic risk factors. PLoS Med. 6, e1000058 (2009). · DOI · Paper page
- Puterman, E. et al. Predicting mortality from 57 economic, behavioral, social, and psychological factors. Proc. Natl. Acad. Sci. https://doi.org/10.1073/pnas.1918455117 (2020). · DOI
- Wang, T. J. et al. Multiple biomarkers for the prediction of first major cardiovascular events and death. N. Engl. J. Med. 355, 2631–2639 (2006). · DOI
- Deelen, J. et al. A metabolic profile of all-cause mortality risk identified in an observational study of 44,168 individuals. Nat. Commun. 10, 3346 (2019). · DOI · Paper page
- Cole, J. H. et al. Brain age predicts mortality. Mol. Psychiatry 23, 1385–1392 (2018). · DOI
- Ho, J. E. et al. Protein biomarkers of cardiovascular disease and mortality in the community. J. Am. Heart Assoc. 7, e008108 (2018). · DOI
- Orwoll, E. S. et al. High-throughput serum proteomics for the identification of protein biomarkers of mortality in older men. Aging Cell 17, e12717 (2018). · DOI
- Rohloff, J. C. et al. Nucleic acid ligands with protein-like side chains: modified aptamers and their use as diagnostic and therapeutic agents. Mol. Ther. Nucleic Acids 3, e201 (2014). · DOI · Paper page
- Menni, C. et al. Circulating proteomic signatures of chronological age. J. Gerontol. A. Biol. Sci. Med. Sci. 70, 809–816 (2015). · DOI · Paper page
- Tanaka, T. et al. Plasma proteomic signature of age in healthy humans. Aging Cell 17, e12799 (2018). · DOI · Paper page
- Sathyan, S. et al. Plasma proteomic profile of age, health span, and all-cause mortality in older adults. Aging Cell 19, e13250 (2020). · DOI
- Ganz, P. et al. Development and validation of a protein-based risk score for cardiovascular outcomes among patients with stable coronary heart disease. JAMA 315, 2532–2541 (2016). · DOI · Paper page
- Rafnar, T. et al. The Icelandic Cancer Project—a population-wide approach to studying cancer. Nat. Rev. Cancer 4, 488–492 (2004). · DOI
- Ivarsdottir, E. V. et al. Sequence variation at ANAPC1 accounts for 24% of the variability in corneal endothelial cell density. Nat. Commun. 10, 1284 (2019). · DOI
- Kursa, M. B. & Rudnicki, W. R. Feature selection with the Boruta Package. JSS J. Stat. Softw. 36, 1–13 (2010).
- Tibshirani, R. Regression shrinkage and selection via the Lasso. J. R. Stat. Soc. Ser. B Methodol. 58, 267–288 (1996). · DOI · Paper page
- Jassal, B. et al. The reactome pathway knowledgebase. Nucleic Acids Res. 48, D498–D503 (2020).
- Ebaid, D., Crewther, S. G., MacCalman, K., Brown, A. & Crewther, D. P. Cognitive processing speed across the lifespan: beyond the influence of motor speed. Front. Aging Neurosci. 9, 62 (2017). · DOI
- Reitan, R. M. Validity of the trail making test as an indicator of organic brain damage. Percept. Mot. Skills 8, 271–276 (1958). · DOI
- Wiklund, F. E. et al. Macrophage inhibitory cytokine-1 (MIC-1/GDF15): a new marker of all-cause mortality: Serum MIC-1/GDF15 and mortality risk. Aging Cell 9, 1057–1064 (2010). · DOI
- Coll, A. P. et al. GDF15 mediates the effects of metformin on body weight and energy balance. Nature 578, 444–448 (2020). · DOI · Paper page
- Moon, J. S. et al. Growth differentiation factor 15 protects against the aging-mediated systemic inflammatory response in humans and mice. Aging Cell 19, e13195 (2020). · DOI · Paper page
- Lara, J. et al. Towards measurement of the healthy ageing phenotype in lifestyle-based intervention studies. Maturitas 76, 189–199 (2013). · DOI
- Nishiwaki, Y. et al. Association of thoracic kyphosis with subjective poor health, functional activity and blood pressure in the community-dwelling elderly. Environ. Health Prev. Med. 12, 246–250 (2007). · DOI
- Hynes, R. O. The extracellular matrix: not just pretty fibrils. Science 326, 1216–1219 (2009). · DOI · Paper page
- Le Roith, D. Insulin-like growth factors. N. Engl. J. Med. 336, 633–640 (1997). · DOI · Paper page
- Helgadottir, A. et al. Genetic variability in the absorption of dietary sterols affects the risk of coronary artery disease. Eur. Heart J. 41, 2618–2628 (2020). · DOI
- Brody, E. et al. Life’s simple measures: unlocking the proteome. J. Mol. Biol. 422, 595–606 (2012). · DOI · Paper page
- Candia, J. et al. Assessment of variability in the SOMAscan assay. Sci. Rep. 7, 14248 (2017). · DOI
- The Emerging Risk Factors Collaboration. Major lipids, apolipoproteins, and risk of vascular disease. JAMA 302, 1993–2000 (2009). · DOI · Paper page
- Pencina, M. J., D’Agostino, R. B., D’Agostino, R. B. & Vasan, R. S. Evaluating the added predictive ability of a new marker: From area under the ROC curve to reclassification and beyond. Stat. Med. 27, 157–172 (2008). · DOI · Paper page
- Harrell, F. E., Califf, R. M., Pryor, D. B., Lee, K. L. & Rosati, R. A. Evaluating the yield of medical tests. JAMA 247, 2543–2546 (1982). · DOI · Paper page
- DeLong, E. R., DeLong, D. M. & Clarke-Pearson, D. L. Comparing the areas under two or more correlated receiver operating characteristic curves: a nonparametric approach. Biometrics 44, 837–845 (1988). · DOI · Paper page
- Zou, H. & Hastie, T. Regularization and variable selection via the elastic net. J. R. Stat. Soc. Ser. B Stat. Methodol. 67, 301–320 (2005). · DOI · Paper page
- Chen, T. & Guestrin, C. XGBoost: a scalable tree boosting system. In Proc. 22nd ACM SIGKDD International Conference on Knowledge Discovery and Data Mining 785–794 (Association for Computing Machinery, 2016). https://doi.org/10.1145/2939672.2939785. · DOI · Paper page
- Mi, H. et al. PANTHER version 16: a revised family classification, tree-based classification tool, enhancer regions and extensive API. Nucleic Acids Res. 49, D394–D403 (2021). · DOI · Paper page
- Pedregosa, F. et al. Scikit-learn: machine learning in Python. J. Mach. Learn. Res. 12, 2825–2830 (2011).
- Robin, X. et al. pROC: an open-source package for R and S+ to analyze and compare ROC curves. BMC Bioinform. 12, 77 (2011). · DOI · Paper page
Cited by
Sorted by citations
Validation of biomarkers of aging
Moqri, M., Herzog, C., Poganik, J. R., Ying, K., Justice, J. N., Belsky, D. W., Higgins-Chen, A. T., Chen, B. H., Cohen, A. A., Fuellen, G., et al. (2024) · Nature Medicine · doi:10.1038/s41591-023-02784-9 · Cited by 361
Metadata
- Authors
- Eiriksdottir, T., Ardal, S., Jonsson, B. A., Lund, S. H., Ivarsdottir, E. V., Norland, K., Ferkingstad, E., Stefansson, H., Jonsdottir, I., Holm, H., Rafnar, T., Saemundsdottir, J., Norddahl, G. L., Thorgeirsson, G., Gudbjartsson, D. F., Sulem, P., Thorsteinsdottir, U., Stefansson, K., & Ulfarsson, M. O.
- Venue
- Communications Biology
- Published
- 2021-06-18
- Volume
- 4
- Issue
- 1
- ISSN
- 2399-3642
- PMC
- PMC8213855
- Cited by
- 30
- References
- 10
- Language
- en
About these checks
Registry, retraction, Cites and statistics results are computed, not judged, with one exception: a printed reference that no index lists is read once by a model before it counts as a citation error. Claims are extracted by a model and kept only when their quote appears verbatim in the text; each cited source is then checked, with a model’s help, for whether it says what the claim relies on. Those verdicts can be wrong — read the claim’s quote and the cited source before relying on one.
Statistics and arithmetic are recomputed, not judged.
Confidence bands are shown only for fields calibrated on our annotated test set. None is calibrated yet, so no band is shown.
What counts as a claim ›How we measure confidence ›How we check this ›
Are you an author, or do you see a problem with this page? Request a review
