

The DOI matches its Crossref record; 69 of the 69 references it cites were found in a registry or an index.
Agricultural input shocks affect crop yields more in the high-yielding areas of the world
Open accessPublished version of a preprint
Abstract
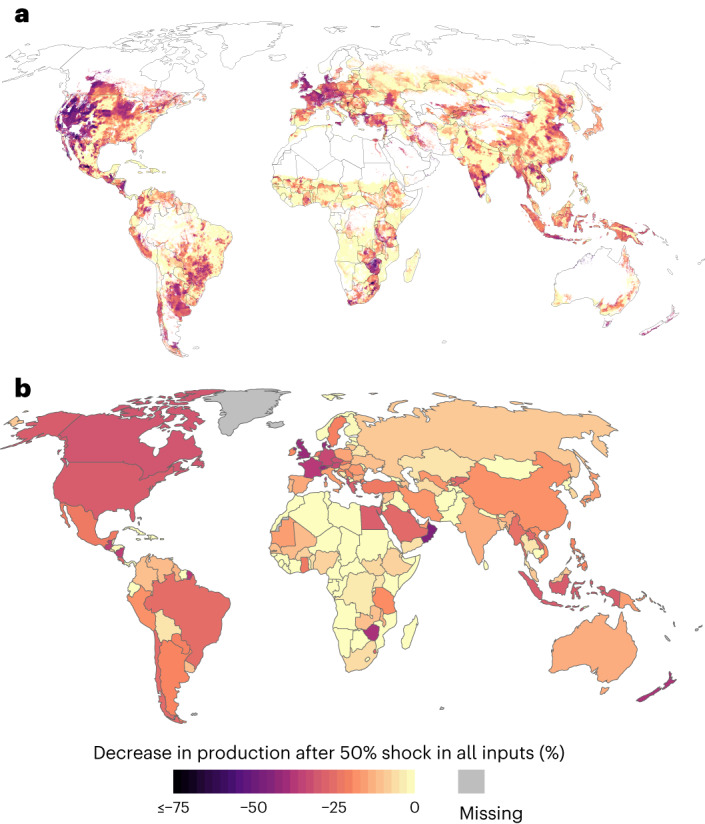
The industrialization of agriculture has led to an increasing dependence on non-locally sourced agricultural inputs. Hence, shocks in the availability of agricultural inputs can be devastating to food crop production. There is also a pressure to decrease the use of synthetic fertilizers and pesticides in many areas. However, the combined impact of the agricultural input shocks on crop yields has not yet been systematically assessed globally. Here we modelled the effects of agricultural input shocks using a random forest machine learning algorithm. We show that shocks in fertilizers cause the most drastic yield losses. Under the scenario of 50% shock in all studied agricultural inputs, global maize production could decrease up to 26%, and global wheat production up to 21%, impacting particularly the high-yielding ‘breadbasket’ areas of the world. Our study provides insights into global food system resilience and can be useful for preparing for potential future shocks or agricultural input availability decreases at local and global scales.
Overview
The claims and statistics of this paper haven’t been checked yet.
Run the check — free, no account needed. It reads the open-access text and checks the sources it cites.
Integrity signals
Registry
Cites
Statistics
Figures
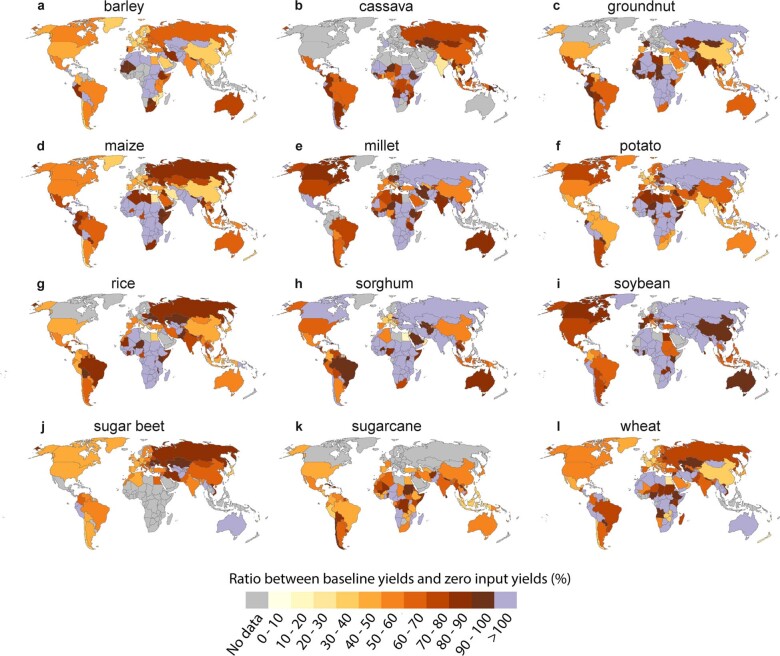
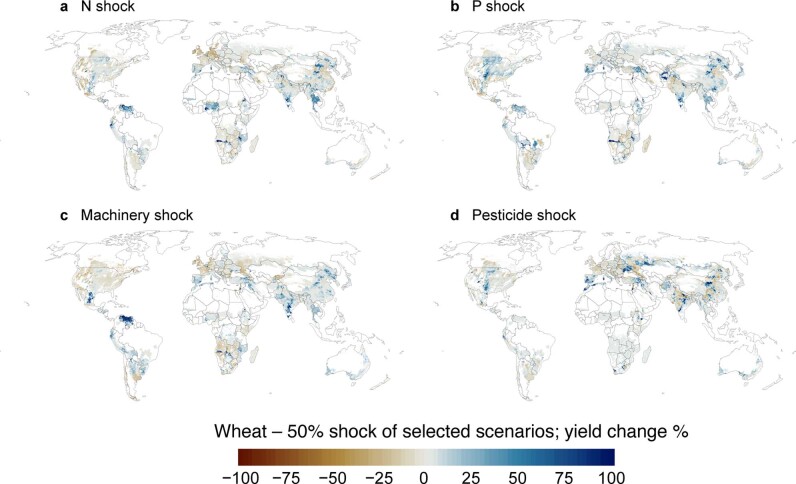
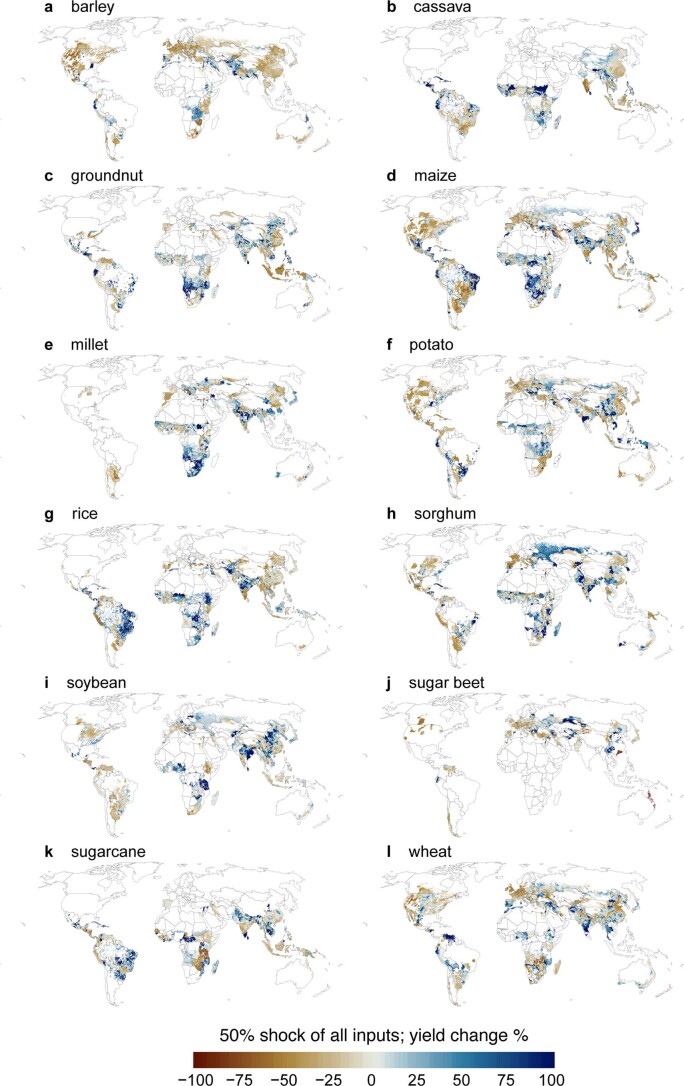
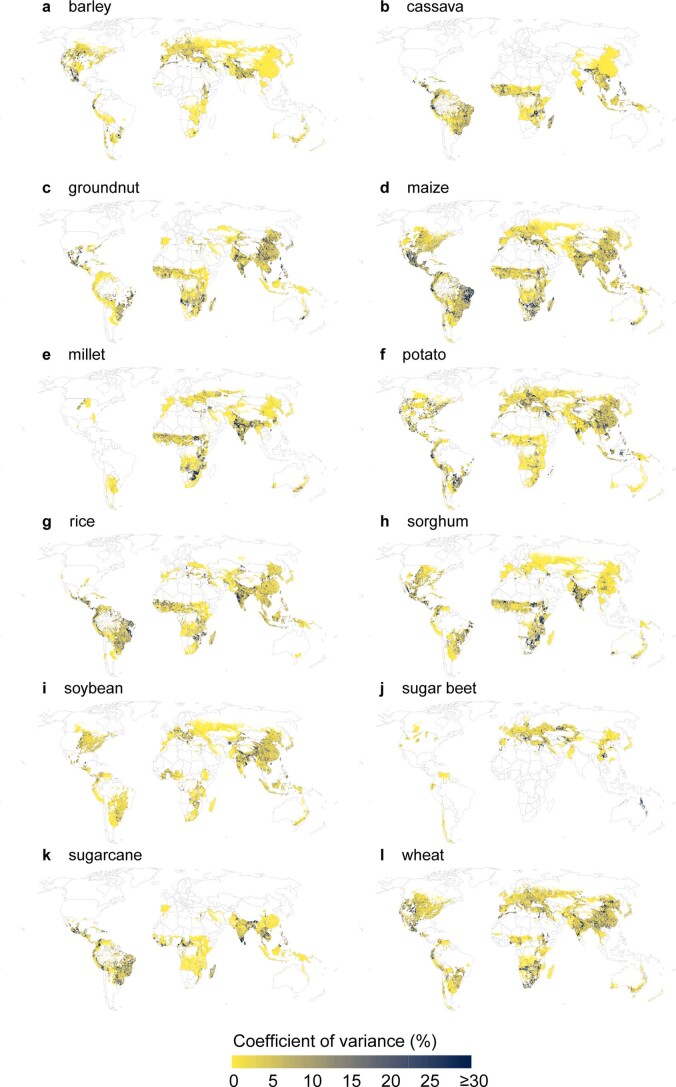
Verification
Claims the paper makes
The claims and statistics of this paper haven’t been checked yet.
Run the check — free, no account needed. It reads the open-access text and checks the sources it cites.
Self-check
Percentages, sums and reported differences re-computed from the paper’s own numbers.
The self-check needs the paper’s full text.
Citations
Cites
Breiman, L. (2001) · Machine Learning · doi:10.1023/a:1010933404324 · Cited by 133,538 · cited 2×
“We used a random forest machine learning model 10 to conduct the assessment.”
BackgroundMethodClassification and Regression by randomForest
Liaw, A. I., & Wiener, M. C. (2007) · Cited by 18,594
WorldClim 2: new 1‐km spatial resolution climate surfaces for global land areas
Fick, S. E., & Hijmans, R. J. (2017) · International Journal of Climatology · doi:10.1002/joc.5086 · Cited by 16,088
Model Evaluation Guidelines for Systematic Quantification of Accuracy in Watershed Simulations
Moriasi, D. N., Arnold, J. G., Liew, M. W. V., Bingner, R. L., Harmel, R. D., & Veith, T. L. (2007) · Transactions of the ASABE · doi:10.13031/2013.23153 · Cited by 13,446 · cited 3×
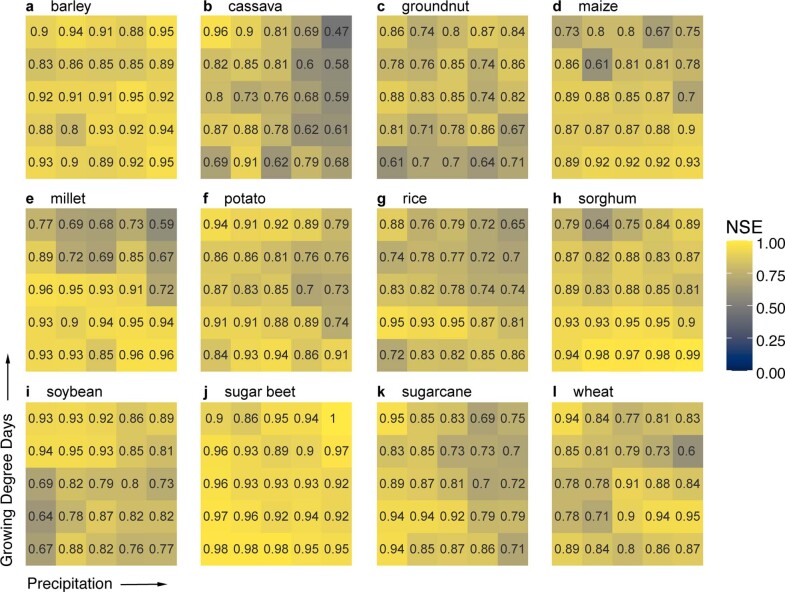
“3), indicating good or very good model performance 21 , respectively.”
BackgroundInfluentialClassification And Regression Trees
Breiman, L., Friedman, J. H., Olshen, R. A., & Stone, C. J. (2017) · doi:10.1201/9781315139470 · Cited by 11,417
How a century of ammonia synthesis changed the world
Erisman, J. W., Sutton, M. A., Galloway, J. N., Klimont, Z., & Winiwarter, W. (2008) · Nature Geoscience · doi:10.1038/ngeo325 · Cited by 4,630
Closing yield gaps through nutrient and water management
Mueller, N. D., Gerber, J., Johnston, M., Ray, D. K., Ramankutty, N., & Foley, J. A. (2012) · Nature · doi:10.1038/nature11420 · Cited by 2,942 · cited 10×
“…aspect that could have affected the model performances is some details of the model input data: for a wheat climate bin with 28,000 observations, there are only 30 unique values for N rate or P rate, and furthermore, many of the fertilizer rates are known only at subnational or county level 12 .”
BackgroundMethodResultInfluentialSoilGrids 2.0: producing soil information for the globe with quantified spatial uncertainty
de Sousa, L. M., Poggio, L., Batjes, N. H., Heuvelink, G. B. M., Kempen, B., Ribeiro, E., & Rossiter, D. G. (2021) · SOIL · doi:10.5194/soil-7-217-2021 · Cited by 2,776 · cited 2×
“For that we used organic carbon density (hg m −3 ) from SoilGrid v2 35 for the topsoil (0–30 cm).”
MethodHyperparameters and tuning strategies for random forest
Probst, P., Wright, M. N., & Boulesteix, A. (2019) · Wiley Interdisciplinary Reviews Data Mining and Knowledge Discovery · doi:10.1002/widm.1301 · Cited by 2,319 · cited 1×
“Random forest can be adjusted with different hyperparameter values 45 .”
BackgroundMonfreda, C., Ramankutty, N., & Foley, J. A. (2008) · Global Biogeochemical Cycles · doi:10.1029/2007gb002947 · Cited by 1,895 · cited 1×
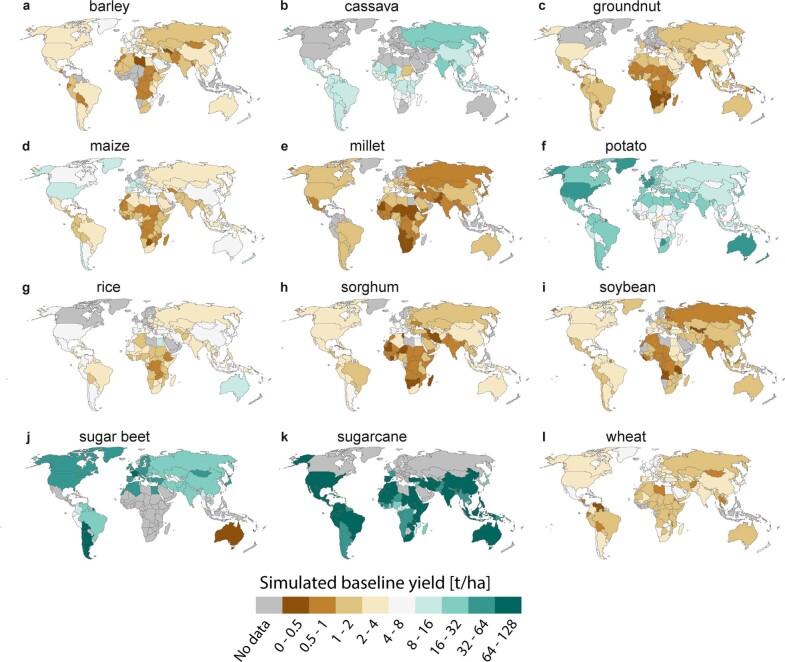
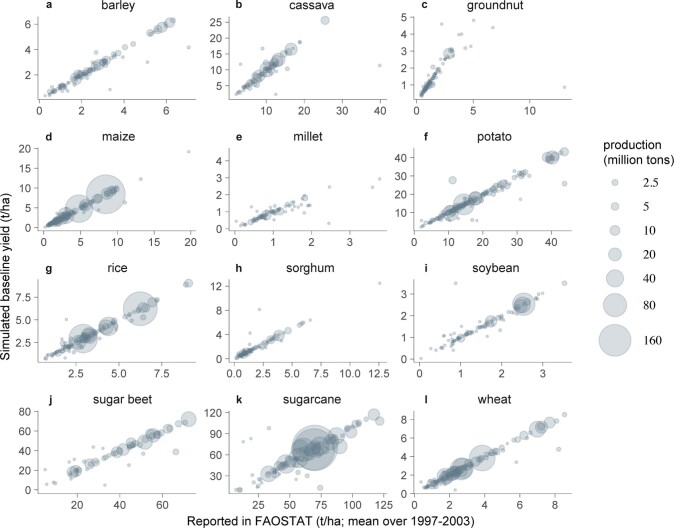
“Yield data (t ha −1 ) were sourced from Monfreda et al. 27 .”
MethodChlingaryan, A., Sukkarieh, S., & Whelan, B. M. (2018) · Computers and Electronics in Agriculture · doi:10.1016/j.compag.2018.05.012 · Cited by 1,651
Crop Yield Gaps: Their Importance, Magnitudes, and Causes
Lobell, D. B., Cassman, K. G., & Field, C. B. (2009) · Annual Review of Environment and Resources · doi:10.1146/annurev.environ.041008.093740 · Cited by 1,606 · cited 1×
“We included a statistic for irrigation in our model, as irrigated crops have higher yields 31 .”
BackgroundPortmann, F. T., Siebert, S., & Döll, P. (2010) · Global Biogeochemical Cycles · doi:10.1029/2008gb003435 · Cited by 1,586 · cited 1×
“Crop-specific irrigated and rainfed harvested area was sourced from Portmann et al. 33 , and for the analysis we transformed it to the share of harvested area under irrigation (%).”
MethodNitrogen in crop production: An account of global flows
Smil, V. (1999) · Global Biogeochemical Cycles · doi:10.1029/1999gb900015 · Cited by 986
Global meta-analysis of the relationship between soil organic matter and crop yields
Oldfield, E. E., Bradford, M. A., & Wood, S. A. (2019) · SOIL · doi:10.5194/soil-5-15-2019 · Cited by 802 · cited 1×
“Furthermore, we used soil organic carbon as it is shown to impact yields 36 and to be a good indicator for soil degradation 37 .”
MethodLeverage points for improving global food security and the environment
West, P. C., Gerber, J., Engstrom, P. M., Mueller, N. D., Brauman, K. A., Carlson, K. M., Cassidy, E. S., Johnston, M., MacDonald, G. K., Ray, D. K., et al. (2014) · Science · doi:10.1126/science.1246067 · Cited by 800 · cited 1×
“We also included the non-mineral fertilizer layer from the EarthStat database (West et al. 28 ) to represent the locally available fertilizers, but this was kept constant in all scenarios.”
MethodRandom Forests for Global and Regional Crop Yield Predictions
Jeong, J. H., Resop, J. P., Mueller, N., Fleisher, D., Yun, K., Butler, E., Timlin, D., Shim, K., Gerber, J., Reddy, V., et al. (2016) · PLoS ONE · doi:10.1371/journal.pone.0156571 · Cited by 795 · cited 3×
“However, Jeong et al. 22 use mostly meteorological and geophysical variables and only one agricultural input (N).”
MethodResultInfluentialMachine Learning Benchmarks and Random Forest Regression
Segal, M. R. (2004) · eScholarship (California Digital Library) · Cited by 684
Peak Phosphorus: Clarifying the Key Issues of a Vigorous Debate about Long-Term Phosphorus Security
Cordell, D., & White, S. B. (2011) · Sustainability · doi:10.3390/su3102027 · Cited by 655
Rethinking the global food crisis: The role of trade shocks
Headey, D. (2010) · Food Policy · doi:10.1016/j.foodpol.2010.10.003 · Cited by 632
Licker, R., Johnston, M., Foley, J. A., Barford, C. C., Kucharik, C. J., Monfreda, C., & Ramankutty, N. (2010) · Global Ecology and Biogeography · doi:10.1111/j.1466-8238.2010.00563.x · Cited by 603 · cited 4×
“Johnston et al. 38 and Licker et al. 39 use GDD and the soil moisture index to construct the climate bins, while Mueller et al. 12 use GDD and precipitation and divide the bins by equal harvested area.”
MethodInfluentialAssessing the evolving fragility of the global food system
Puma, M. J., Bose, S., Chon, S. Y., & Cook, B. I. (2015) · Environmental Research Letters · doi:10.1088/1748-9326/10/2/024007 · Cited by 498
Chowdhury, R. B., Moore, G. A., Weatherley, A. J., & Arora, M. (2016) · Journal of Cleaner Production · doi:10.1016/j.jclepro.2016.07.012 · Cited by 413
Ruane, A., Goldberg, R., & Chryssanthacopoulos, J. (2015) · Agricultural and Forest Meteorology · doi:10.1016/j.agrformet.2014.09.016 · Cited by 396 · cited 2×
“To create crop-specific climate bins with equal amounts of data points in each bin, we used daily temperature and precipitation over 21 years (1990–2010) from AgMERRA 40 .”
MethodGlobal Phosphorus Flows and Environmental Impacts from a Consumption Perspective
Liu, Y., Villalba, G., Ayres, R. U., & Schrøder, H. (2008) · Journal of Industrial Ecology · doi:10.1111/j.1530-9290.2008.00025.x · Cited by 377
Pesticide-free agriculture as a new paradigm for research
Jacquet, F., Jeuffroy, M., Jouan, J., Cadre, E. L., Litrico, I., Malausa, T., Reboud, X., & Huyghe, C. (2022) · Agronomy for Sustainable Development · doi:10.1007/s13593-021-00742-8 · Cited by 373 · cited 5×
“5 and 6).”
BackgroundInfluentialAccurate prediction of sugarcane yield using a random forest algorithm
Everingham, Y. L., Sexton, J., Skocaj, D., & Inman‐Bamber, N. G. (2016) · Agronomy for Sustainable Development · doi:10.1007/s13593-016-0364-z · Cited by 362
From Food Insufficiency towards Trade Dependency: A Historical Analysis of Global Food Availability
Porkka, M., Kummu, M., Siebert, S., & Varis, O. (2013) · PLoS ONE · doi:10.1371/journal.pone.0082714 · Cited by 326
Self-citationClosing Yield Gaps: How Sustainable Can We Be?
Pradhan, P., Fischer, G., van Velthuizen, H., Reusser, D. E., & Kropp, J. P. (2015) · PLoS ONE · doi:10.1371/journal.pone.0129487 · Cited by 322 · cited 1×
“These findings are in line with an existing study by Pradhan et al. 15 who studied different agricultural management interventions needed to close yield gaps and determined that fertilizer application and soil quality management were the most important interventions, and pesticides application,…”
ResultSoil organic matter as sole indicator of soil degradation
Obalum, S. E., Chibuike, G., Peth, S., & Ouyang, Y. (2017) · Environmental Monitoring and Assessment · doi:10.1007/s10661-017-5881-y · Cited by 318 · cited 1×
“Furthermore, we used soil organic carbon as it is shown to impact yields 36 and to be a good indicator for soil degradation 37 .”
MethodMaggi, F., Tang, F. H. M., la Cecilia, D., & McBratney, A. B. (2019) · Scientific Data · doi:10.1038/s41597-019-0169-4 · Cited by 316 · cited 2×
“For the eight other crops, the aggregate class Other was used, as classified by Maggi et al. 30 .”
MethodFood and feed trade as a driver in the global nitrogen cycle: 50-year trends
Lassaletta, L., Billen, G., Grizzetti, B., Garnier, J. A., Leach, A. M., & Galloway, J. N. (2013) · Biogeochemistry · doi:10.1007/s10533-013-9923-4 · Cited by 315
Johnson, M. D., Hsieh, W. W., Cannon, A. J., et al. (2015) · Agricultural and Forest Meteorology · doi:10.1016/j.agrformet.2015.11.003 · Cited by 287
A cultivated planet in 2010 – Part 2: The global gridded agricultural-production maps
Yu, Q., You, L., Wood-Sichra, U., Ru, Y., Joglekar, A., Fritz, S., Xiong, W., Lu, M., Wu, W.-B., & Yang, P. (2020) · Earth System Science Data · doi:10.5194/essd-12-3545-2020 · Cited by 284 · cited 1×
“The industrialized food production systems, on which the majority of global food crops are grown 1 , depend on off-farm inputs such as synthetic fertilizers, machinery, energy, pesticides, seeds and animal feed.”
BackgroundYield response of corn to irrigation and nitrogen fertilization in a Mediterranean environment
Paolo, E. D., & Rinaldi, M. (2007) · Field Crops Research · doi:10.1016/j.fcr.2007.10.004 · Cited by 254 · cited 1×
“Irrigation also enhances the effect of fertilization: the same fertilizer input produces higher yields on irrigated crops than on non-irrigated, based on empirical studies by, for example, Di Paolo and Rinaldi 32 as well as yield modelling results by Mueller et al. 12 .”
BackgroundTeleconnected food supply shocks
d’Amour, C. B., Wenz, L., Kalkuhl, M., Steckel, J. C., & Creutzig, F. (2016) · Environmental Research Letters · doi:10.1088/1748-9326/11/3/035007 · Cited by 230
Food Price Volatility and Its Implications for Food Security and Policy
Kalkuhl, M., von Braun, J., & Torero, M. A. (2016) · Springer eBooks · doi:10.1007/978-3-319-28201-5 · Cited by 221
Leng, G., & Hall, J. W. (2020) · Environmental Research Letters · doi:10.1088/1748-9326/ab7b24 · Cited by 210 · cited 3×
“In predicting yield variability in time and space, Feng et al. 53 and Leng and Hall 43 also find that random forest performs better than regression or process-based models, but they only use climate data.”
MethodKummu, M., Kinnunen, P., Lehikoinen, E., Porkka, M., Queiroz, C., Röös, E., Troell, M. F., & Weil, C. (2020) · Global Food Security · doi:10.1016/j.gfs.2020.100360 · Cited by 208
Self-citationResilience in the global food system
Seekell, D. A., Carr, J. A., Dell’Angelo, J., D’Odorico, P., Fader, M., Gephart, J. A., Kummu, M., Magliocca, N. R., Porkka, M., Puma, M. J., et al. (2017) · Environmental Research Letters · doi:10.1088/1748-9326/aa5730 · Cited by 202
Self-citationPatterns and trends in nitrogen use and nitrogen recovery efficiency in world agriculture
Conant, R. T., Berdanier, A. B., & Grace, P. (2013) · Global Biogeochemical Cycles · doi:10.1002/gbc.20053 · Cited by 201
Rainfall shocks and agricultural productivity: Implication for rural household consumption
Amare, M., Jensen, N., Shiferaw, B. A., et al. (2018) · Agricultural Systems · doi:10.1016/j.agsy.2018.07.014 · Cited by 187
Vulnerability of the United Kingdom’s food supply chains exposed by COVID-19
Garnett, P., Doherty, B., & Heron, T. (2020) · Nature Food · doi:10.1038/s43016-020-0097-7 · Cited by 187
Global option space for organic agriculture is delimited by nitrogen availability
Barbieri, P., Pellerin, S., Seufert, V., Smith, L. G., Ramankutty, N., & Nesme, T. (2021) · Nature Food · doi:10.1038/s43016-021-00276-y · Cited by 160 · cited 1×
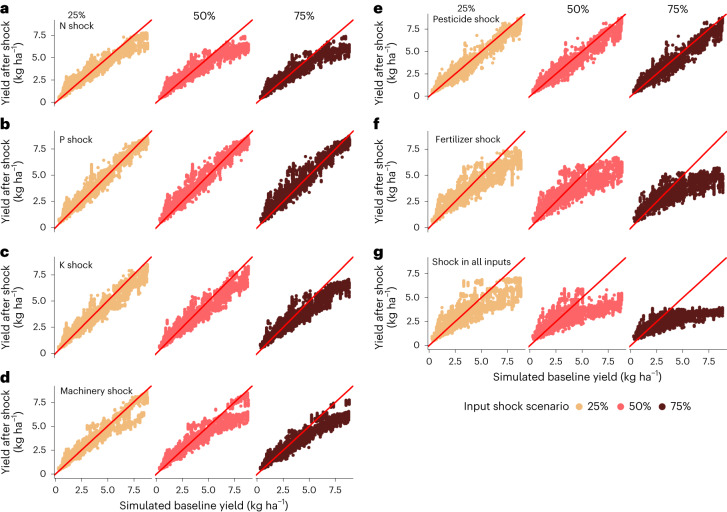
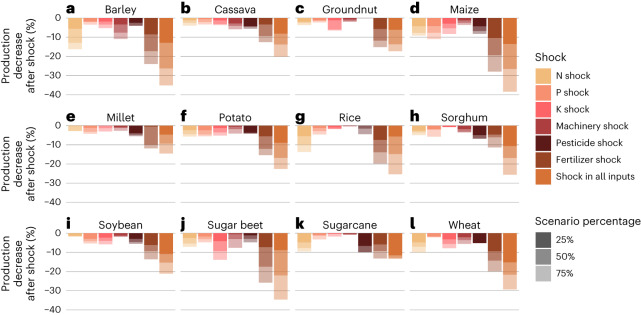
“The shades indicate the effect of different shock scenario percentages (25%, 50%, 75%). https://doi.org/10.1038/s43016-023-00873-z organic agriculture with no synthetic fertilizer use and where the currently high-yielding areas were most affected as well 24 .”
BackgroundInfluentialReserves and trade jointly determine exposure to food supply shocks
Marchand, P., Carr, J. A., Dell’Angelo, J., Fader, M., Gephart, J. A., Kummu, M., Magliocca, N. R., Porkka, M., Puma, M. J., Ratajczak, Z., et al. (2016) · Environmental Research Letters · doi:10.1088/1748-9326/11/9/095009 · Cited by 149 · cited 1×
“And while some countries might be resilient enough in their food system to handle local extreme weather shocks or disturbances in food trade flows, their food production might be influenced by the availability of agricultural inputs 3,4 .”
BackgroundSelf-citationAmjath-Babu, T. S., Krupnik, T. J., Thilsted, S. H., et al. (2020) · Food Security · doi:10.1007/s12571-020-01083-2 · Cited by 131
Factors explaining the low and variable profitability of fertilizer application to maize in Zambia
Burke, W., Jayne, T. S., & Black, J. R. (2016) · Agricultural Economics · doi:10.1111/agec.12299 · Cited by 127 · cited 3×
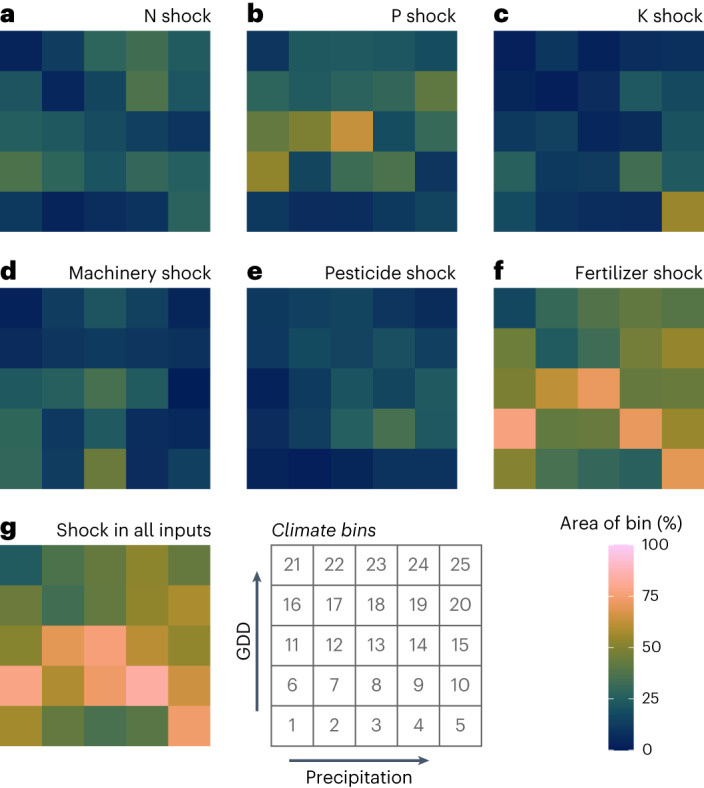
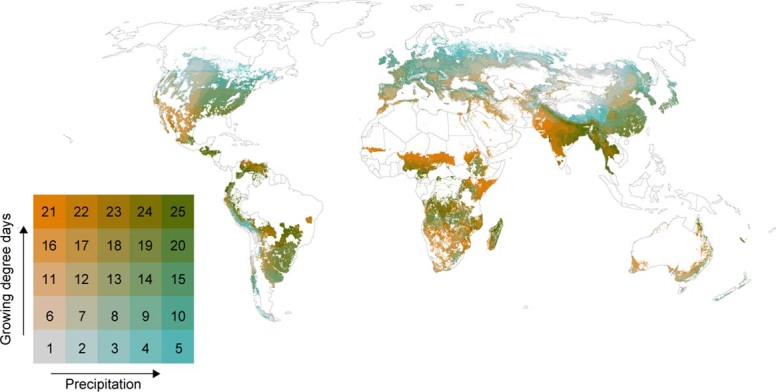
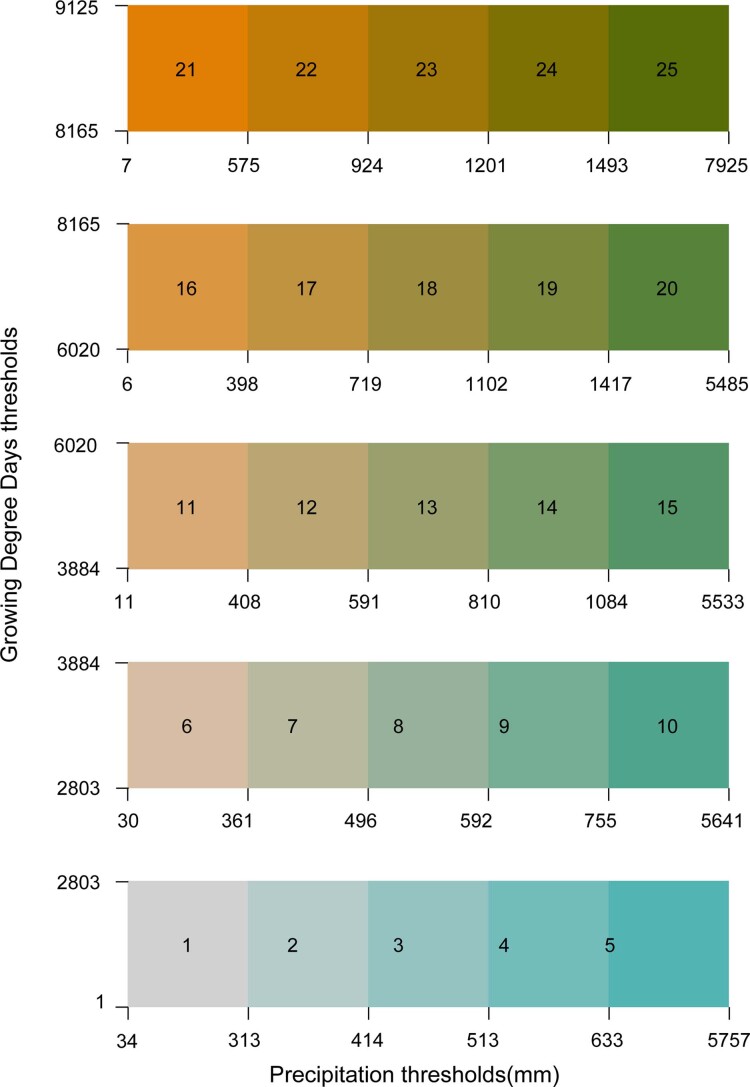
“We found clear differences between the climate bins on how the shocks impact on yields: in case of maize, for example, climate bins 6, 9, 11, 12 and 13 (corresponding to temperate climate) seem to respond heavily to P shock, with bin 5 to K shock and bin 3 to machinery shock (Fig.”
BackgroundA Global Database of Soil Plant Available Phosphorus
McDowell, R. W., Noble, A. D. L., Pletnyakov, P., & Haygarth, P. M. (2023) · Scientific Data · doi:10.1038/s41597-023-02022-4 · Cited by 118 · cited 1×
“We included gridded soil P from McDowell et al. 34 and soil N from SoilGrid v2 35 for the topsoil (0–30 cm) to represent the natural availability of P and N, respectively, to the crops.”
MethodFukuda, S., Spreer, W., Yasunaga, E., Yuge, K., Sardsud, V., & Müller, J. (2012) · Agricultural Water Management · doi:10.1016/j.agwat.2012.07.003 · Cited by 105
Fertilizer and grain prices constrain food production in sub-Saharan Africa
Bonilla-Cedrez, C., Chamberlin, J., & Hijmans, R. J. (2021) · Nature Food · doi:10.1038/s43016-021-00370-1 · Cited by 104 · cited 1×
“And while some countries might be resilient enough in their food system to handle local extreme weather shocks or disturbances in food trade flows, their food production might be influenced by the availability of agricultural inputs 3,4 .”
BackgroundAfrican crop yield reductions due to increasingly unbalanced Nitrogen and Phosphorus consumption
van der Velde, M., Folberth, C., Balkovič, J., Ciais, P., Fritz, S., Janssens, I. A., Obersteiner, M. H., See, L., Skalský, R., Xiong, W., et al. (2014) · Global Change Biology · doi:10.1111/gcb.12481 · Cited by 104 · cited 2×
“In individual crops, however, some clustering of heavily affected bins can be seen: in the case of maize, climate bins 6, 8, 9, 12, 13 and 14 share relatively close temperature and precipitation conditions and are also most heavily affected by the shock in all inputs (Fig.”
BackgroundImpacts of rainfall extremes on wheat yield in semi-arid cropping systems in eastern Australia
Feng, P., Wang, B., Liu, D. L., Xing, H., Ji, F., Macadam, I., Ruan, H., & Yu, Q. (2018) · Climatic Change · doi:10.1007/s10584-018-2170-x · Cited by 103 · cited 1×
“In predicting yield variability in time and space, Feng et al. 53 and Leng and Hall 43 also find that random forest performs better than regression or process-based models, but they only use climate data.”
MethodNewlands, N. K., Zamar, D., Kouadio, L. A., Zhang, Y., Chipanshi, A. C., Potgieter, A. B., Touré, S., & Hill, H. S. J. (2014) · Frontiers in Environmental Science · doi:10.3389/fenvs.2014.00017 · Cited by 96 · cited 1×
“Random forest has been successfully used for yield predictions with smaller-scale climate, irrigation and satellite data 47–51 .”
MethodFood system resilience to phosphorus shortages on a telecoupled planet
Barbieri, P., MacDonald, G. K., de Raymond, A. B., & Nesme, T. (2021) · Nature Sustainability · doi:10.1038/s41893-021-00816-1 · Cited by 89
Grigorieva, E. A., Matzarakis, A., & de Freitas, C. (2010) · Climate Research · doi:10.3354/cr00888 · Cited by 80 · cited 1×
“Furthermore, we used the cut-off temperature (as in Grigorieva et al. 42 ) to represent the temperature ceiling that a crop can benefit from; that is, if a temperature of a day was over the cut-off temperature, the cut-off temperature was used instead.”
MethodHaile, M. G., Kalkuhl, M., & von Braun, J. (2016) · Springer eBooks · doi:10.1007/978-3-319-28201-5_7 · Cited by 72
Beckman, J., Ivanic, M., Jelliffe, J. L., et al. (2020) · RePEc: Research Papers in Economics · doi:10.22004/ag.econ.327231 · Cited by 70
High fertilizer prices contribute to rising global food security concerns
Hebebrand, C., & Laborde Debucquet, D. (2023) · doi:10.2499/9780896294394_07 · Cited by 66 · cited 1×
“Many of these inputs are imported, often only from a few countries 2 .”
BackgroundClimatic and genetic controls of yields of switchgrass, a model bioenergy species
Tulbure, M. G., Wimberly, M. C., Boe, A., & Owens, V. N. (2012) · Agriculture, Ecosystems & Environment · doi:10.1016/j.agee.2011.10.017 · Cited by 52 · cited 1×
“It has also been used in agricultural modelling to help select the important variables for constructing another type of model 52 .”
MethodHeslin, A., Puma, M. J., Marchand, P., Carr, J. A., Dell’Angelo, J., D’Odorico, P., Gephart, J. A., Kummu, M., Porkka, M., Rulli, M. C., et al. (2020) · Frontiers in Sustainable Food Systems · doi:10.3389/fsufs.2020.00026 · Cited by 50
Self-citationJohnston, M., Licker, R., Foley, J. A., Holloway, T., Mueller, N. D., Barford, C. C., & Kucharik, C. J. (2011) · Environmental Research Letters · doi:10.1088/1748-9326/6/3/034028 · Cited by 49 · cited 3×
“Johnston et al. 38 and Licker et al. 39 use GDD and the soil moisture index to construct the climate bins, while Mueller et al. 12 use GDD and precipitation and divide the bins by equal harvested area.”
MethodNanda, M., Cordell, D., & Kansal, A. (2019) · Journal of Environmental Management · doi:10.1016/j.jenvman.2019.03.115 · Cited by 29
Neglecting spatial autocorrelation causes underestimation of the error of sugarcane yield models
Ferraciolli, M. A., Bocca, F. F., & Rodrigues, L. H. A. (2018) · Computers and Electronics in Agriculture · doi:10.1016/j.compag.2018.09.003 · Cited by 27
Grabrucker, K., & Grimm, M. (2020) · American Journal of Agricultural Economics · doi:10.1111/ajae.12174 · Cited by 25
Measuring the impact of agricultural production shocks on international trade flows
Ferguson, S., & Gars, J. (2019) · European Review of Agricultural Economics · doi:10.1093/erae/jbz013 · Cited by 18 · cited 3×
“The relationships of different disturbances on food production (extreme weather and so on) and supply (trade shocks and so on) are increasingly well understood (for example, Dall’erba et al. 7 and Ferguson and Gars 8 ).”
BackgroundImportance of trade dependencies for agricultural inputs: a case study of Finland
Lehikoinen, E., Kinnunen, P., Piipponen, J., et al. (2021) · Environmental Research Communications · doi:10.1088/2515-7620/ac02d0 · Cited by 14
Self-citationNava, N. J., Ridley, W. C., & Dall’erba, S. (2022) · Agricultural Economics · doi:10.1111/agec.12750 · Cited by 13 · cited 1×
“One idea is to use gravity models of trade to estimate the volume of flows of agricultural inputs between places by considering productivity and various costs 26 .”
BackgroundMaatalouden tuotantopanosten saatavuuden riskit : Kriiseihin varautuminen ruokahuollon turvaamisessa
Jansik, C., Huuskonen, H., Karhapää, M., et al. (2021) · Jukuri (Natural Resources Institute Finland (Luke)) · Cited by 2
Research works printed but not linked: 2
- Dall’Erba, S., Chen, Z. & Nava, N. J. U.S. Interstate trade will mitigate the negative impact of climate change on crop profit. Am. J. Agric. Econ. 103, 1721–1741 (2021).
- O’Hara, J. K., Mulik, K. & Gurian-Sherman, D. Agricultural production impacts of higher phosphate fertilizer prices. J Int. Agric. Trade Dev. 9, 233–253 (2015).
Cited by
Sorted by citations
Reducing chemical inputs in agriculture requires a system change
Brunelle, T., Chakir, R., Carpentier, A., Dorin, B., Goll, D. S., Guilpart, N., Maggi, F., Makowski, D., Nesme, T., Roosen, J., et al. (2024) · Communications Earth & Environment · doi:10.1038/s43247-024-01533-1 · Cited by 168
Bisinella, V., Schmidt, S., Varling, A. S., Laner, D., & Christensen, T. H. (2023) · Waste Management · doi:10.1016/j.wasman.2023.11.021 · Cited by 90
Ayadi, R., Forouheshfar, Y., & Moghadas, O. (2025) · Frontiers in Climate · doi:10.3389/fclim.2025.1585331 · Cited by 71
Ren, C., He, L., & Rosa, L. (2025) · Nature Food · doi:10.1038/s43016-024-01107-6 · Cited by 35
“N stands as a pivotal element for optimal crop growth, and shocks in fertilizer application can result in severe yield losses 44 .”
Reshaping Agriculture Eco-efficiency in China: From Greenhouse Gas Perspective
Wang, G., Zhao, M., Zhao, B., Liu, X., & Wang, Y. (2025) · Ecological Indicators · doi:10.1016/j.ecolind.2025.113268 · Cited by 35
Metadata
- Authors
- Ahvo, A., Heino, M., Sandström, V., Chrisendo, D., Jalava, M., & Kummu, M.
- Affiliations
- Aalto University (FI)
- Corresponding author
- Kummu, Matti
- Venue
- Nature Food
- Published
- 2023-11-09
- Volume
- 4
- Issue
- 12
- Pages
- 1037-1046
- ISSN
- 2662-1355 (ISSN-L)
- PMC
- PMC10727984
- OpenAlex
- W4388523335
- Cited by
- 78
- References
- 69
- Citations by year
- 2026: 34 · 2025: 33 · 2024: 10 · 2023: 1
- FWCI
- 19.80
- Type
- journal article
- Language
- en
- Open access
- hybrid
- doi.org
- Locations
- Nature Food (publishedVersion, cc-by)
- Research Square (acceptedVersion, cc-by)
- PubMed (publishedVersion)
- PubMed Central (submittedVersion, cc-by)
- Aaltodoc (Aalto University) (submittedVersion, cc-by)
- Apollo (University of Cambridge) (submittedVersion, cc-by)
- Funders
- European Commission (HORIZON2020, 819202)
- Academy of Finland (339834)
- Aalto-Yliopisto
- China Scholarship Council
- Maa- ja Vesitekniikan Tuki Ry
- Topics
- Life Sciences › Agricultural and Biological Sciences › Agronomy and Crop Science › Climate change impacts on agriculture
- Social Sciences › Economics, Econometrics and Finance › Economics and Econometrics › Agricultural risk and resilience
- Social Sciences › Economics, Econometrics and Finance › Economics and Econometrics › Economics of Agriculture and Food Markets
- Keywords
- crop yield, fertilizer availability, pesticide availability, maize production, wheat production, food system resilience, global food security, mineral fertilizers
- MeSH terms
- Crop Production, Agriculture, Fertilizers, Pesticides, Crops, Agricultural
About these checks
Registry, retraction, Cites and statistics results are computed, not judged, with one exception: a printed reference that no index lists is read once by a model before it counts as a citation error. Claims are extracted by a model and kept only when their quote appears verbatim in the text; each cited source is then checked, with a model’s help, for whether it says what the claim relies on. Those verdicts can be wrong — read the claim’s quote and the cited source before relying on one.
Statistics and arithmetic are recomputed, not judged.
Confidence bands are shown only for fields calibrated on our annotated test set. None is calibrated yet, so no band is shown.
What counts as a claim ›How we measure confidence ›How we check this ›
Are you an author, or do you see a problem with this page? Request a review
