

Improved ClickTags enable live-cell barcoding for highly multiplexed single cell sequencing
Open accessThe DOI matches its Crossref record; 44 of the 44 references it cites were found in a registry or an index.
Abstract
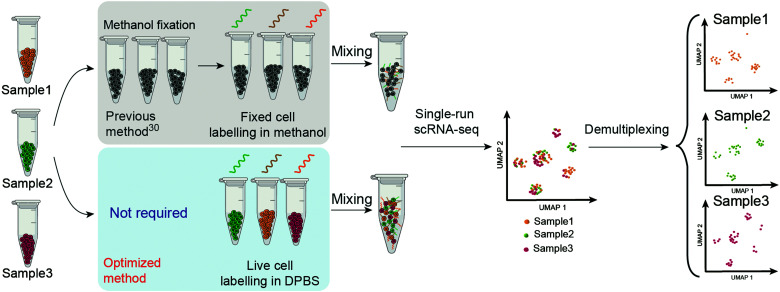
A versatile and highly reproducible approach for live cell sample multiplexing is achieved by DNA barcoding via “click chemistry” in single-cell RNA-seq.
Overview
The claims and statistics of this paper haven’t been checked yet.
Free: it reads the open-access text and checks the first 5 claims that cite a source we can check. Create a free account to check every claim.
Integrity signals
Registry
Cites
Statistics
Figures
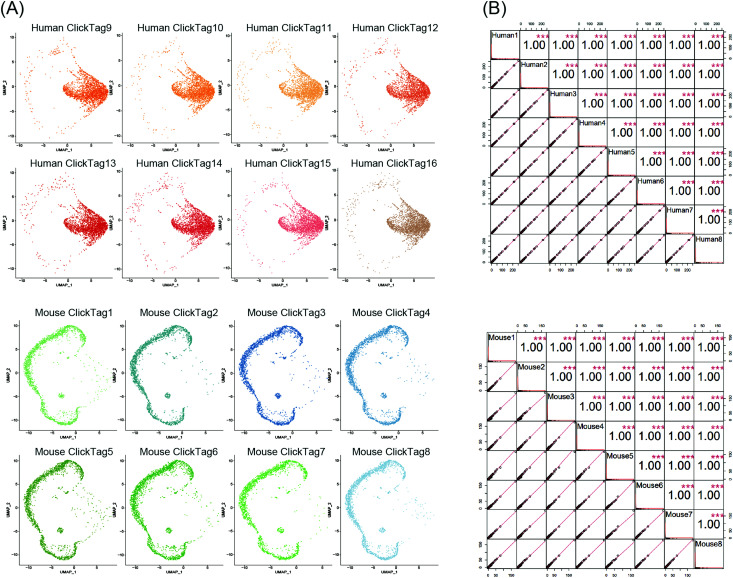
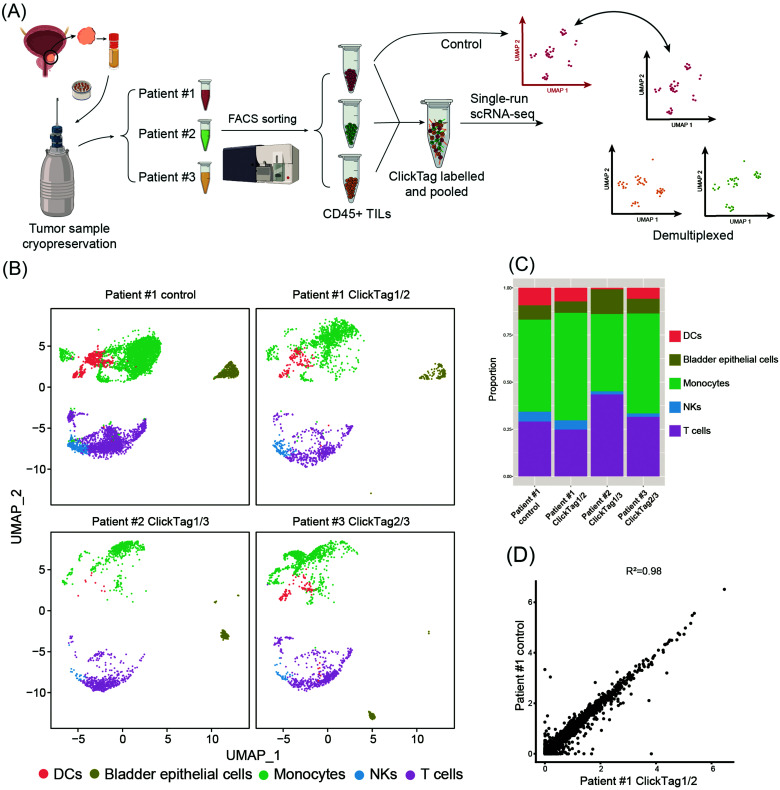

Verification
Claims the paper makes
The claims and statistics of this paper haven’t been checked yet.
Free: it reads the open-access text and checks the first 5 claims that cite a source we can check. Create a free account to check every claim.
Claims other papers make about this one
Each is checked against this paper’s own text: does it say what the citing paper says it does?
The cited source says what the claim attributes to it.
In the citing paper
“Recently, Zhao et al. reported an improved ClickTags method to enable the use in live-cell samples empowered by “click chemistry”, and eliminated the requirement for methanol fixation of samples (Fig. 2B).”
From Single-cell sequencing to multi-omics: technologies and applications (2024) · cites this paper as [22]
The cited source says what the claim attributes to it.
In the citing paper
“Sample multiplexed scRNA-seq is another solution, establishing an efficient method for massively parallel species-mixing experiments [18–22].”
From Single-cell sequencing to multi-omics: technologies and applications (2024) · cites this paper as [22]
Self-check
Percentages, sums and reported differences re-computed from the paper’s own numbers.
The self-check needs the paper’s full text.
Citations
Cites
Integrated analysis of multimodal single-cell data
Hao, Y., Hao, S., Andersen-Nissen, E., Mauck, W. M., Zheng, S., Butler, A., Lee, M. J., Wilk, A. J., Darby, C., Zagar, M., et al. (2020) · doi:10.1101/2020.10.12.335331 · Cited by 15,508
Spatial reconstruction of single-cell gene expression data
Satija, R., Farrell, J. A., Gennert, D., Schier, A. F., & Regev, A. (2015) · Nature Biotechnology · doi:10.1038/nbt.3192 · Cited by 7,055
A Next Generation Connectivity Map: L1000 Platform and the First 1,000,000 Profiles
Subramanian, A., Narayan, R., Corsello, S. M., Peck, D. D., Natoli, T. E., Lu, X., Gould, J., Davis, J. F., Tubelli, A. A., Asiedu, J. K., et al. (2017) · Cell · doi:10.1016/j.cell.2017.10.049 · Cited by 3,515
Droplet barcoding for single-cell transcriptomics applied to embryonic stem cells
Klein, A. M., Mazutis, L., Akartuna, I., Tallapragada, N., Veres, A., Li, V., Peshkin, L., Weitz, D. A., & Kirschner, M. W. (2015) · Cell · doi:10.1016/j.cell.2015.04.044 · Cited by 3,356
Bioorthogonal Chemistry: Fishing for Selectivity in a Sea of Functionality
Sletten, E. M., & Bertozzi, C. R. (2009) · Angewandte Chemie International Edition · doi:10.1002/anie.200900942 · Cited by 3,165
Simultaneous epitope and transcriptome measurement in single cells
Stoeckius, M., Hafemeister, C., Stephenson, W., Houck-Loomis, B., Chattopadhyay, P. K., Swerdlow, H., Satija, R., & Smibert, P. (2017) · Nature Methods · doi:10.1038/nmeth.4380 · Cited by 3,098
Current best practices in single-cell RNA-seq analysis: a tutorial
Luecken, M. D., & Theis, F. J. (2019) · Molecular Systems Biology · doi:10.15252/msb.20188746 · Cited by 2,231
Single-cell RNA-Seq profiling of human preimplantation embryos and embryonic stem cells
Yan, L., Yang, M., Guo, H., Yang, L., Wu, J., Li, R., Liu, P., Lian, Y., Zheng, X., Yan, J., et al. (2013) · Nature Structural & Molecular Biology · doi:10.1038/nsmb.2660 · Cited by 1,740
Tetrazine Ligation: Fast Bioconjugation Based on Inverse-Electron-Demand Diels−Alder Reactivity
Blackman, M. L., Royzen, M., & Fox, J. M. (2008) · Journal of the American Chemical Society · doi:10.1021/ja8053805 · Cited by 1,679
A pan-cancer single-cell transcriptional atlas of tumor infiltrating myeloid cells
Cheng, S., Li, Z., Gao, R., Xing, B., Gao, Y., Yang, Y., Qin, S., Zhang, L., Ouyang, H., Du, P., et al. (2021) · Cell · doi:10.1016/j.cell.2021.01.010 · Cited by 1,601
Cited by
Single-cell sequencing to multi-omics: technologies and applications
Wu, X., Yang, X., Dai, Y., Zhao, Z., Zhu, J., Guo, H., & Yang, R. (2024) · Biomarker Research · doi:10.1186/s40364-024-00643-4 · Cited by 222
“Sample multiplexed scRNA-seq is another solution, establishing an efficient method for massively parallel species-mixing experiments [18–22].”
MethodSelf-citationDeng, T., Jiang, X., Zhao, Z., Zhao, X., Bi, A., Ouyang, S., Sun, S., Qiu, S., Fan, M., Xue, Q., et al. (2025) · Immunity · doi:10.1016/j.immuni.2025.06.011 · Cited by 17
Self-citationPan, Y., Xue, Q., Yang, Y., Shi, T., Wang, H., Song, X., Luo, Y., Liu, W., Ren, S., Cai, Y., et al. (2024) · Cell Reports Medicine · doi:10.1016/j.xcrm.2024.101590 · Cited by 20
Self-citationZhu, W., Wu, X., Zhao, Z., Zhou, M. R., Zhang, T., Zhao, D., Jiang, N., Yang, X., Guo, H., Fang, N., et al. (2025) · Analytical Chemistry · doi:10.1021/acs.analchem.4c05648 · Cited by 6
Self-citationLi, Y., Li, W., Chen, J., Qiu, S., Liu, Y., Xu, L., Tian, T., & Li, J. P. (2023) · Bioorganic Chemistry · doi:10.1016/j.bioorg.2023.106987 · Cited by 4
Self-citationZhang, Q., Li, M., Shen, L., Chen, L., Yuan, Z., Zhang, X., Wang, H., Yu, Y., Luo, F., Peng, G., et al. (2025) · Journal of genetics and genomics/Journal of Genetics and Genomics · doi:10.1016/j.jgg.2025.10.004 · Cited by 1
Clonotype-resolved T-cell response monitoring via repertoire-wide multidimensional TCR decoding
Liu, H., Ouyang, S., Yin, R., Yu, W., Zhao, X., Zhao, Z., Fan, M., Li, J., Zhu, W., Wang, J., et al. (2026) · Vita · doi:10.15302/vita.2026.07.0054
Self-citationAkpe, V., Ngwu, T. A., & Cock, I. E. (2026) · Pharmacognosy Communications · doi:10.5530/pc.2026.4.23
Metadata
- Authors
- Zhao, X., Sun, S., Yu, W., Zhu, W., Zhao, Z., Zhou, Y., Ding, X., Fang, N., Yang, R., & Li, J. P.
- Affiliations
- Nanjing University (CN)
- Singleron Biotechnologies (china) (CN)
- Nanjing Drum Tower Hospital (CN)
- Corresponding author
- Li, Jie P.
- Venue
- RSC Chemical Biology
- Publisher
- Royal Society of Chemistry (RSC)
- Published
- 2022
- Volume
- 3
- Issue
- 8
- Pages
- 1052-1060
- ISSN
- 2633-0679 (ISSN-L)
- PMC
- PMC9347365
- OpenAlex
- W4285157949
- Cited by
- 8
- References
- 44
- Citations by year
- 2026: 1 · 2025: 3 · 2024: 2 · 2023: 2
- FWCI
- 0.57
- Type
- journal article
- Language
- en
- Open access
- gold
- doi.org
- Licence
- Locations
- RSC Chemical Biology (publishedVersion, cc-by-nc)
- PubMed Central (publishedVersion, cc-by-nc)
- PubMed (publishedVersion)
- Funders
- National Natural Science Foundation of China (21977048, 92053111)
- Natural Science Foundation of Jiangsu Province (BK20202004)
- National Key Research and Development Program of China (2019YFA09006600)
- Nanjing University (ZYJH004)
- Beijing National Laboratory for Molecular Sciences (BNLMS202008)
- Topics
- Life Sciences › Biochemistry, Genetics and Molecular Biology › Molecular Biology › Single-cell and spatial transcriptomics
- Physical Sciences › Chemistry › Organic Chemistry › Click Chemistry and Applications
- Life Sciences › Biochemistry, Genetics and Molecular Biology › Molecular Biology › Advanced biosensing and bioanalysis techniques
- Keywords
- DNA barcoding, single-cell RNA sequencing, sample multiplexing, demultiplexing, click chemistry, batch effect correction, clinical samples, primary cells
About these checks
Registry, retraction, Cites and statistics results are computed, not judged, with one exception: a printed reference that no index lists is read once by a model before it counts as a citation error. Claims are extracted by a model and kept only when their quote appears verbatim in the text; each cited source is then checked, with a model’s help, for whether it says what the claim relies on. Those verdicts can be wrong — read the claim’s quote and the cited source before relying on one.
Statistics and arithmetic are recomputed, not judged.
Confidence bands are shown only for fields calibrated on our annotated test set. None is calibrated yet, so no band is shown.
What counts as a claim ›How we measure confidence ›How we check this ›
Are you an author, or do you see a problem with this page? Request a review
Data sources
Bibliographic data: Semantic Scholar, OpenAlex, Crossref.
Contains information from the Semantic Scholar Academic Graph Datasets, made available under the ODC Attribution License (ODC-BY 1.0).
Semantic Scholar’s data is described in: Kinney, R., et al. (2023). The Semantic Scholar Open Data Platform. arXiv:2301.10140.
