

The DOI matches its Crossref record; 49 of the 49 references it cites were found in a registry or an index; none of the 54 sources its claims cite is checked for support yet.
Traceable selenium-doped microplastics and nanoplastics with environmentally realistic morphologies for multi-modal detection in complex biological matrices
Open accessAbstract
Selenium-doped polystyrene microplastics and nanoplastics are produced and detected following biouptake in Daphnia magna .
Overview
CoChat Summary
TL;DR
The paper reports selenium-doped polystyrene micro- and nanoplastics (Se-PS-MNPs/NPs) made by free-radical copolymerization and cryomilling, with environmentally realistic heterogeneous morphologies and a covalent Se tracer. Daphnia magna exposed to these particles showed Se and polystyrene fragment co-localization in the digestive tract by ToF-SIMS and O-PTIR, demonstrating proof-of-concept traceable MNP detection in biological matrices.
Key findings
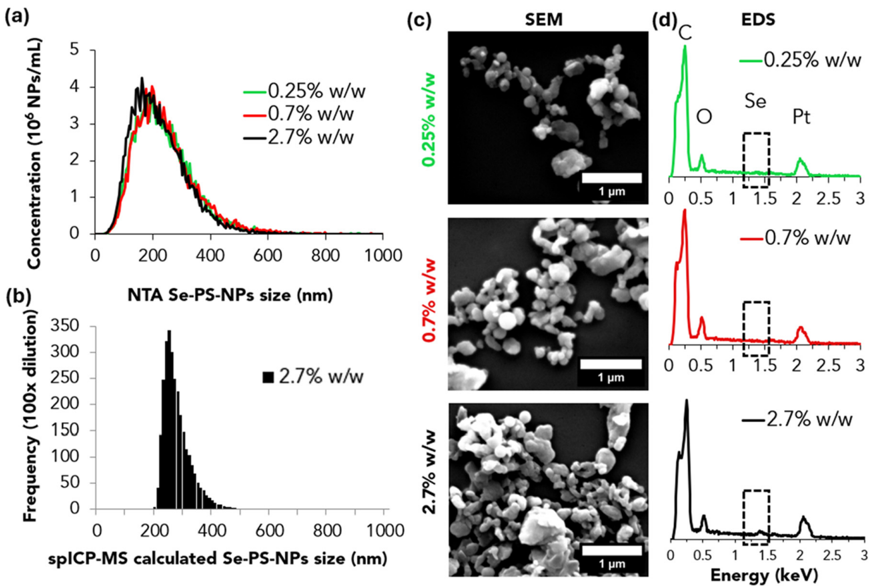
- Se was covalently incorporated into polystyrene: XPS-measured Se-to-polymer ratios were 0.25 ± 0.02%, 0.72 ± 0.10%, and 2.74 ± 0.57% w/w for feed ratios of 0.5, 1, and 3% w/w; monomer conversion was 60–81%, M_n was 16,900–22,200 g mol⁻¹, dispersity was 1.69–2.03, and gravimetric yields were 6.3 ± 1.3% for Se-M and 17.0–20.5% for Se-PS.
- Cryomilling produced polydisperse Se-PS-MNPs with DLS Z-averages of 1.46 ± 0.98, 1.57 ± 0.64, and 1.90 ± 1.07 μm and SEM averages of 2.49 ± 1.36, 1.83 ± 0.61, and 2.67 ± 1.47 μm for 0.25, 0.7, and 2.7% w/w Se, respectively; the isolated Se-PS-NPs had NTA sizes of ∼249 ± 17, 253 ± 42, and 234 ± 27 nm, DLS Z-averages of 292 ± 42, 292 ± 34, and 302 ± 88 nm, and a yield of ∼1% w/w.
- Leaching was negligible over 35 days in MHRW: if all Se had leached, 25 ± 2, 72 ± 10, and 274 ± 57 ppb would have been measured for 0.25, 0.7, and 2.7% w/w samples, respectively; maximum leached Se was 1000× lower than published IC₅₀ values and within natural seawater/freshwater Se ranges.
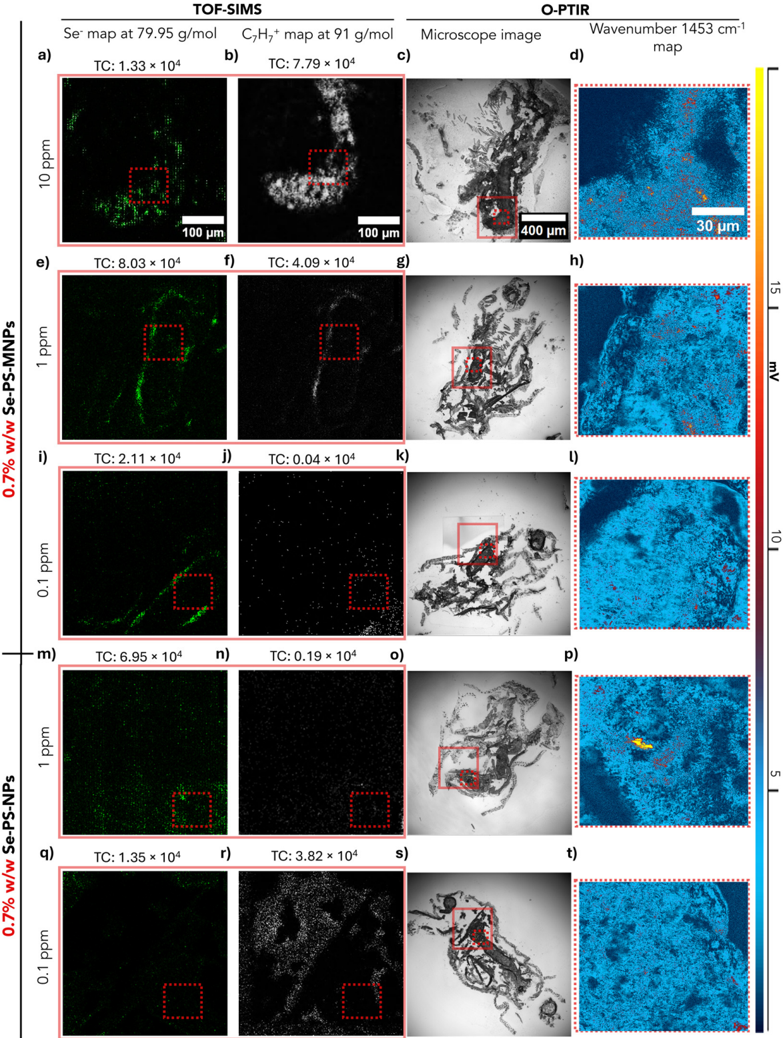
- In D. magna exposed for 48 h, ToF-SIMS detected ⁸⁰Se⁻ co-localized with polystyrene C₇H₇⁺ in the digestive tract; O-PTIR confirmed 23/30 points at 10 ppm Se-PS-MNPs, 2/30 at 1 ppm Se-PS-MNPs, 0/30 at 0.1 ppm Se-PS-MNPs, 6/30 at 1 ppm Se-PS-NPs, and 0/30 at 0.1 ppm Se-PS-NPs. ToF-SIMS remained sensitive to Se at 1 ppm and, more weakly/diffusely, at 0.1 ppm, near the method’s detection limit.
Methods
- Se-M was synthesized from a bromobenzene/Mg Grignard reagent, selenium, and 4-vinylbenzyl chloride; it was copolymerized with styrene by free-radical polymerization (AIBN, toluene, 60 °C, 20 h), then cryomilled (12 cycles, total 40 min) to Se-PS-MNPs, and centrifuged to isolate the smaller Se-PS-NP fraction.
- Particles were characterized by ¹H-NMR, XPS, GPC, O-PTIR, DLS, SEM/EDS, NTA, and spICP-MS; Se leaching was tested in moderately hard reconstituted water over 35 days with ICP-MS.
- Adult Daphnia magna were exposed for 48 h to 0.1, 1, and 10 ppm Se-PS-MNPs and 0.1 and 1 ppm Se-PS-NPs, then cryosectioned; ToF-SIMS mapped ⁸⁰Se⁻ and C₇H₇⁺, and O-PTIR mapped the polystyrene peak at 1453 cm⁻¹.
Limitations
- Stated: the study is proof-of-concept and not a toxicity test; exposure stability (measured concentration over time and aggregation) was not monitored; the 48 h exposure was short; O-PTIR alone may miss particles due to biomass IR interference, small size, or coverage; ToF-SIMS intensity variations from tissue heterogeneity should be interpreted cautiously; at 0.1 ppm the Se signal was weaker/diffuse and near the detection limit; spICP-MS could not estimate sizes for 0.25 and 0.7% w/w Se-PS-NPs because of higher size detection limits; leaching was not tested separately for Se-PS-NPs; and the platform is designed for controlled laboratory exposures and does not address detection of untagged MNPs in complex matrices.
- Evident from the text: the particles are polydisperse and irregularly shaped (MNP DLS PI 0.62–0.96; NP DLS PI ∼0.20), and yields are low (Se-M 6.3 ± 1.3%, Se-PS 17.0–20.5%, Se-PS-NPs ∼1% w/w), which may limit scalability.
- Evident from the text: only polystyrene particles and Daphnia magna were tested, and no toxicity endpoints were measured.
Model-written summary. Check it against the paper before relying on it.
Integrity signals
Registry
Cites
Statistics
Figures


Verification
Claims the paper makes
0 Valid · 1 Not valid · 38 Not checked · 103 Own results and interpretations
A result the paper reports from its own data — it cites no other source for it, so there is none to check. The quote shows it is in the paper.
In the paper
“optical photothermal infrared (O-PTIR) spectroscopy provided further verification of the identity and localization of the MNPs.”
§ Traceable selenium-doped microplastics and nanoplastics with environmentally realistic morphologies for multi-modal detection in complex biological matrices > Abstract
plainstates a cause- Asserted: passes — The authors put it forward as true.
- Checkable: passes — It can be checked against evidence.
- Load-bearing: passes — The paper’s conclusions depend on it.
- Based: passes — The paper gives a reason why it holds.
A result the paper reports from its own data — it cites no other source for it, so there is none to check. The quote shows it is in the paper.
In the paper
“we exposed Daphnia magna to Se-doped MNP suspensions to confirm particle internalization.”
§ Traceable selenium-doped microplastics and nanoplastics with environmentally realistic morphologies for multi-modal detection in complex biological matrices > Abstract
plainstates a cause- Asserted: passes — The authors put it forward as true.
- Checkable: passes — It can be checked against evidence.
- Load-bearing: passes — The paper’s conclusions depend on it.
- Based: passes — The paper gives a reason why it holds.
A result the paper states — it cites no source for it, so there is none to check. The quote shows it is in the paper.
In the paper
“we produce selenium-doped polystyrene MNPs with environmentally relevant, heterogeneous morphologies by combining free-radical polymerization with cryomilling.”
§ Traceable selenium-doped microplastics and nanoplastics with environmentally realistic morphologies for multi-modal detection in complex biological matrices > Abstract
plainstates a cause- Asserted: passes — The authors put it forward as true.
- Checkable: passes — It can be checked against evidence.
- Load-bearing: passes — The paper’s conclusions depend on it.
- Based: passes — The paper gives a reason why it holds.
A result the paper reports from its own data — it cites no other source for it, so there is none to check. The quote shows it is in the paper.
In the paper
“Time-of-flight secondary ion mass spectrometry (ToF-SIMS) provided sub-micrometer localization of Se and polymer fragments within D. magna tissues”
§ Traceable selenium-doped microplastics and nanoplastics with environmentally realistic morphologies for multi-modal detection in complex biological matrices > Abstract
plainstates a cause- Asserted: passes — The authors put it forward as true.
- Checkable: passes — It can be checked against evidence.
- Load-bearing: passes — The paper’s conclusions depend on it.
- Based: passes — The paper gives a reason why it holds.
A result the paper reports from its own data — it cites no other source for it, so there is none to check. The quote shows it is in the paper.
In the paper
“The blank contained an average of 0.98 ± 0.08 ppb across 14 data points in the 35 days.”
§ Traceable selenium-doped microplastics and nanoplastics with environmentally realistic morphologies for multi-modal detection in complex biological matrices > Verifying leaching of Se from Se-PS-MNPs
plain- Asserted: passes — The authors put it forward as true.
- Checkable: passes — It can be checked against evidence.
- Load-bearing: unclear — It is unclear whether the paper’s conclusions depend on it.
- Based: passes — The paper gives a reason why it holds.
49 more claims
Create a free account to see all 142 claims and to verify the 3 references still open.
- It may state two separate claims as one. 57
- Probably not a substantial claim. 45
- The quote only partly states this claim. 1
Self-check
Percentages, sums and reported differences re-computed from the paper’s own numbers.
Rated major: it would touch a result — a value a result rests on, reported and recomputed p-values on opposite sides of the significance level, two passages that conflict with no sign which is right, or a cited work retracted before this paper was published.
In the paper
“ToF-SIMS images were acquired over 400 μm × 400 μm using a field of view of 256 × 256 pixels (0.2 μm pixel -1 for Se-PS-MNPs; 0.1 μm pixel -1 for Se-PS-NPs).”
§ Traceable selenium-doped microplastics and nanoplastics with environmentally realistic morphologies for multi-modal detection in complex biological matrices > An
Reported 0.2 · recomputed 1.5625
Citations
Cites
CRC Handbook of Chemistry and Physics
(2016) · CRC Press eBooks · doi:10.1201/9781315380476 · Cited by 13,921
Fourier Transform Infrared Spectrometry
Griffiths, P. R., & de Haseth, J. A. (2007) · doi:10.1002/047010631x · Cited by 3,052
Alimi, O. S., Farner Budarz, J., Hernandez, L. M., & Tufenkji, N. (2018) · Environmental Science & Technology · doi:10.1021/acs.est.7b05559 · Cited by 2,668
Self-citationFilipe, V., Hawe, A., & Jiskoot, W. (2010) · Pharmaceutical Research · doi:10.1007/s11095-010-0073-2 · Cited by 1,885
Plastic Teabags Release Billions of Microparticles and Nanoparticles into Tea
Hernandez, L. M., Xu, E. G., Larsson, H. C. E., Tahara, R., Maisuria, V. B., & Tufenkji, N. (2019) · Environmental Science & Technology · doi:10.1021/acs.est.9b02540 · Cited by 1,112
Self-citationCharacterisation of nanoplastics during the degradation of polystyrene
Lambert, S., & Wagner, M. (2016) · Chemosphere · doi:10.1016/j.chemosphere.2015.11.078 · Cited by 1,075
Nanoplastics are neither microplastics nor engineered nanoparticles
Gigault, J., El Hadri, H., Nguyen, B., Grassl, B., Rowenczyk, L., Tufenkji, N., Feng, S., & Wiesner, M. (2021) · Nature Nanotechnology · doi:10.1038/s41565-021-00886-4 · Cited by 954
Self-citationJi, Y., Yang, X., Ji, Z., Zhu, L., Ma, N., Chen, D., Jia, X., Tang, J., & Cao, Y. (2020) · ACS Omega · doi:10.1021/acsomega.9b04421 · Cited by 812
FTIR and Raman imaging for microplastics analysis: State of the art, challenges and prospects
Xu, J.-L., Thomas, K. V., Luo, Z., & Gowen, A. A. (2019) · TrAC Trends in Analytical Chemistry · doi:10.1016/j.trac.2019.115629 · Cited by 716
Are there nanoplastics in your personal care products?
Hernandez, L. M., Yousefi, N., & Tufenkji, N. (2017) · Environmental Science & Technology Letters · doi:10.1021/acs.estlett.7b00187 · Cited by 700
Self-citationInductively Coupled Plasma Mass Spectrometry: Introduction to Analytical Aspects
Wilschefski, S., & Baxter, M. (2019) · Clinical Biochemist Reviews · doi:10.33176/aacb-19-00024 · Cited by 684
Brandon, J., Goldstein, M., & Ohman, M. D. (2016) · Marine Pollution Bulletin · doi:10.1016/j.marpolbul.2016.06.048 · Cited by 626
Rist, S., Baun, A., & Hartmann, N. B. (2017) · Environmental Pollution · doi:10.1016/j.envpol.2017.05.048 · Cited by 571
To what extent are microplastics from the open ocean weathered?
ter Halle, A., Ladirat, L., Martignac, M., Mingotaud, A. F., Boyron, O., & Perez, E. (2017) · Environmental Pollution · doi:10.1016/j.envpol.2017.04.051 · Cited by 456
Marine plastic litter: the unanalyzed nano-fraction
Gigault, J., Pedrono, B., Maxit, B., & Ter Halle, A. (2016) · Environmental Science Nano · doi:10.1039/c6en00008h · Cited by 453
Nanoparticle Size Detection Limits by Single Particle ICP-MS for 40 Elements
Lee, S., Bi, X., Reed, R. B., Ranville, J. F., Herckes, P., & Westerhoff, P. (2014) · Environmental Science & Technology · doi:10.1021/es502422v · Cited by 448
Chen, Y., Zou, C., Mastalerz, M., Hu, S., Gasaway, C., & Tao, X. (2015) · International Journal of Molecular Sciences · doi:10.3390/ijms161226227 · Cited by 435
Luo, Y., Li, L., Feng, Y., Li, R., Yang, J., Peijnenburg, W. J. G. M., & Tu, C. (2022) · Nature Nanotechnology · doi:10.1038/s41565-021-01063-3 · Cited by 374
Mitrano, D. M., Beltzung, A., Frehland, S., Schmiedgruber, M., Cingolani, A., & Schmidt, F. (2019) · Nature Nanotechnology · doi:10.1038/s41565-018-0360-3 · Cited by 337
Mozhayeva, D., & Engelhard, C. (2020) · Journal of Analytical Atomic Spectrometry · doi:10.1039/c9ja00206e · Cited by 292
Test No. 211: Daphnia magna Reproduction Test
OECD (2012) · OECD Guidelines for the Testing of Chemicals, Section 2 · doi:10.1787/9789264185203-en · Cited by 278
Yang, T., Luo, J., & Nowack, B. (2021) · Environmental Science & Technology · doi:10.1021/acs.est.1c04826 · Cited by 199
Defining Primary and Secondary Microplastics: A Connotation Analysis
Song, J., Wang, C., & Li, G. (2024) · ACS ES&T Water · doi:10.1021/acsestwater.4c00316 · Cited by 192
Kildahl, N. K. (1995) · Journal of Chemical Education · doi:10.1021/ed072p423 · Cited by 185
The environmental fate of nanoplastics: What we know and what we need to know about aggregation
Pradel, A., Catrouillet, C., & Gigault, J. (2023) · NanoImpact · doi:10.1016/j.impact.2023.100453 · Cited by 167
A New Method and Mass Spectrometer Design for TOF-SIMS Parallel Imaging MS/MS
Fisher, G. L., Bruinen, A. L., Ogrinc, N., Hammond, J. S., Bryan, S. R., Larson, P. E., & Heeren, R. M. A. (2016) · Analytical Chemistry · doi:10.1021/acs.analchem.6b01022 · Cited by 131
Microplastics as potential carriers of viruses could prolong virus survival and infectivity
Lu, J., Yu, Z., Ngiam, L., & Guo, J. (2022) · Water Research · doi:10.1016/j.watres.2022.119115 · Cited by 125
Clark, N. J., Khan, F. R., Mitrano, D. M., Boyle, D., & Thompson, R. C. (2021) · Environment International · doi:10.1016/j.envint.2021.106994 · Cited by 119
Lowering the Size Detection Limits of Ag and TiO2 Nanoparticles by Single Particle ICP-MS
Hadioui, M., Knapp, G., Azimzada, A., Jreije, I., Frechette-Viens, L., & Wilkinson, K. J. (2019) · Analytical Chemistry · doi:10.1021/acs.analchem.9b04007 · Cited by 86
Self-citationSynthesis of 14C-labelled polystyrene nanoplastics for environmental studies
Al-Sid-Cheikh, M., Rowland, S. J., Kaegi, R., Henry, T. B., Cormier, M., & Thompson, R. C. (2020) · Communications Materials · doi:10.1038/s43246-020-00097-9 · Cited by 77
Maier, K. J., Foe, C. G., & Knight, A. W. (1993) · Environmental Toxicology and Chemistry · doi:10.1002/etc.5620120417 · Cited by 68
Metal-doping of nanoplastics enables accurate assessment of uptake and effects on Gammarus pulex
Redondo‐Hasselerharm, P. E., Vink, G. J., Mitrano, D. M., & Koelmans, A. A. (2021) · Environmental Science Nano · doi:10.1039/d1en00068c · Cited by 61
Pikuda, O., Dumont, E. R., Chen, Q., Macairan, J., Robinson, S. A., Berk, D., & Tufenkji, N. (2023) · TrAC Trends in Analytical Chemistry · doi:10.1016/j.trac.2023.117208 · Cited by 55
Self-citationBasic Image Analysis and Manipulation in ImageJ/Fiji
Stossi, F., & Singh, P. K. (2023) · Current Protocols · doi:10.1002/cpz1.849 · Cited by 50
CHAPTER 1. The Chemistry of Selenium
Perrone, D., Monteiro, M. C., & Nunes, J. C. (2015) · Food and nutritional components in focus · doi:10.1039/9781782622215-00003 · Cited by 41
Du, H., Wang, Y., Zhang, P., Mei, R., Ji, Y., Zhao, X., Zhang, Z., Ma, J., & Chen, L. (2022) · Nanoscale · doi:10.1039/d2nr00157h · Cited by 39
Smith, C., Brown, S., Malone, N., Bevers, S. G., Ranville, J. F., & Fairbrother, D. H. (2023) · Environmental Science Nano · doi:10.1039/d3en00342f · Cited by 28
Daphnia magna's Favorite Snack: Biofouled Plastics
Polhill, L., de Bruijn, R., Amaral‐Zettler, L., Praetorius, A., & van Wezel, A. P. (2022) · Environmental Toxicology and Chemistry · doi:10.1002/etc.5393 · Cited by 27
Peel, R. H., Lloyd, C. E. M., Roberts, S., Naafs, B. D. A., & Bull, I. D. (2024) · Environmental Science Advances · doi:10.1039/d4va00269e · Cited by 27
Kwon, T. S., Kondo, S., Takagi, K., Kunisada, H., & Yuki, Y. (1999) · Polymer Journal · doi:10.1295/polymj.31.483 · Cited by 24
Titanium-doped PET nanoplastics of environmental origin as a true-to-life model of nanoplastic
Villacorta, A., Vela, L., Morataya-Reyes, M., Llorens-Chiralt, R., Rubio, L., Alaraby, M., Marcos, R., & Hernández, A. (2023) · The Science of The Total Environment · doi:10.1016/j.scitotenv.2023.163151 · Cited by 23
Das, M., Calderon, L., Singh, D., Majumder, S., Bazina, L., Vaze, N., Trivanovic, U., DeLoid, G. M., Zuverza‐Mena, N., Kaur, M., et al. (2025) · NanoImpact · doi:10.1016/j.impact.2025.100567 · Cited by 21
Macairan, J., Saherwala, A., Li, F., Monteil‐Rivera, F., & Tufenkji, N. (2025) · Environmental Science & Technology · doi:10.1021/acs.est.4c14367 · Cited by 20
Self-citationYakovenko, N., Amouroux, B., Albignac, M., Collin, F., Roux, C., Mingotaud, A., Roblin, P., Coudret, C., & ter Halle, A. (2022) · Environmental Science Nano · doi:10.1039/d2en00029f · Cited by 17
Charlton, D., Costa, C., Trindade, G. F., Hinder, S. J., Watts, J. F., & Bailey, M. J. (2022) · Science & Justice · doi:10.1016/j.scijus.2022.10.004 · Cited by 16
Fu, S., Feng, L., Zhu, H., Zhang, Y., Yuan, X.-Z., Zou, H., & Guo, R. (2023) · Analytical Chemistry · doi:10.1021/acs.analchem.3c01666 · Cited by 14
Yang, Z., Tang, J., Li, Y., Pan, Y., & Xiao, Y. (2025) · Reviews of Environmental Contamination and Toxicology · doi:10.1007/s44169-025-00104-5 · Cited by 3
Determan, J. J., & Wilson, A. K. (2013) · Computational and Theoretical Chemistry · doi:10.1016/j.comptc.2013.04.020 · Cited by 2
Anastasia, C. M., Paul, S., Kim, H.-I., Cui, Q., Fairbrother, D. H., & Giraldo, J. P. (2026) · ACS Nano · doi:10.1021/acsnano.5c08388 · Cited by 2
Research works printed but not linked: 5
- I.Lab , Micro-Fourier Transform Infrared Spectroscopy (Micro-FTIR) , Infinita Lab , 2025 , https://infinitalab.com/material-testing-service/micro-fourier-transform-infrared-spectroscopy-micro-ftir/accessed
- Bruker , Guide to Raman Spectroscopy , Bruker , 2025 , https://www.bruker.com/en/products-and-solutions/infrared-and-raman/raman-spectrometers/what-is-raman-spectroscopy.html accessed
- C. Technology , What is Raman Spectroscopy? , CRAIC Technology , 2025 , https://www.microspectra.com/support/the-science/raman-science accessed
- P. S. Corp , Techniques , Photothermal Spectroscopy Corp , 2025 , https://www.photothermal.com/products/techniques/accessed
- T. F. Scientific , Inductively Coupled Plasma Optical Emission Spectroscopy (ICP-OES) Information , Thermo Fisher Scientific , 2025 , https://www.thermofisher.com/ca/en/home/industrial/spectroscopy-elemental-isotope-analysis/spectroscopy-elemental-isotope-analysis-learning-center/trace-elemental-analysis-tea-information/icp-oes-information.html accessed
Cited by
Still being checked.
Metadata
- Authors
- Li, F., Blancho, F., R. Alanagh, H., Macairan, J. R., Kalogerakis, G. C., Hadioui, M., Saherwala, A., Laurent, E. A., Wilkinson, K. J., Maric, M., Ghoshal, S., Naccache, R., & Tufenkji, N.
- Affiliations
- McGill University (CA)
- Ifremer (FR)
- Department of Civil Engineering, McGill University, Montreal, Quebec, Canada H3A 0C3
- Université de Montréal (CA)
- Centre de transfert technologique en écologie industrielle, Sorel-Tracy, Québec, J3R 1C2 Canada
- Department of Chemical Engineering, McGill University, Montreal, Quebec, Canada H3A 0C5
- Concordia University (CA)
- United Nations University Institute for Water, Environment, and Health (CA)
- Corresponding author
- Tufenkji, N.
- Venue
- Environmental Science: Nano
- Publisher
- Royal Society of Chemistry (RSC)
- Published
- 2026
- ISSN
- 2051-8153 (ISSN-L)
- 2051-8161
- OpenAlex
- W7225385466
- Cited by
- 0
- References
- 49
- FWCI
- 0.00
- Type
- journal article
- Language
- en
- Open access
- hybrid
- doi.org
- Licence
- Locations
- Environmental Science Nano (publishedVersion, cc-by-nc)
- Institutional Archive of Ifremer (French Research Institute for Exploitation of the Sea) (submittedVersion, cc-by-nc)
- Funders
- Natural Sciences and Engineering Research Council of Canada (528220-2019, 596176-2025, RGPAS-2019-00117, RGPIN-2019-04519, RGPIN-2025-04969, RGPIN-2024-04619)
- Health Canada (2324-HQ-000074)
- Fonds Québécois de la Recherche sur la Nature et les Technologies (328469)
- Canada Research Chairs (CRC-2022-00274)
- Canada Foundation for Innovation (217263, 36368, 40070, 43152)
- Concordia University
- McGill University
- Topics
- Physical Sciences › Environmental Science › Pollution › Microplastics and Plastic Pollution
- Physical Sciences › Chemistry › Analytical Chemistry › Analytical chemistry methods development
- Physical Sciences › Environmental Science › Health, Toxicology and Mutagenesis › Environmental Toxicology and Ecotoxicology
- Keywords
- nanoplastics, polystyrene, traceability, Daphnia magna, multimodal detection, complex biological matrices, microplastic detection
About these checks
Registry, retraction, Cites and statistics results are computed, not judged, with one exception: a printed reference that no index lists is read once by a model before it counts as a citation error. Claims are extracted by a model and kept only when their quote appears verbatim in the text; each cited source is then checked, with a model’s help, for whether it says what the claim relies on. Those verdicts can be wrong — read the claim’s quote and the cited source before relying on one.
A language model drew the claims from the paper on 2026-11-19, under version 3 of the claim definition (model deepseek-v4.1-flash, prompt extract-v3).
A second model labelled each claim on 2026-11-19 (model jev-1.13-20260917, definition revision gold-guideline-v0.2).
Statistics and arithmetic are recomputed, not judged.
Confidence bands are shown only for fields calibrated on our annotated test set. None is calibrated yet, so no band is shown.
What counts as a claim ›How we measure confidence ›How we check this ›
Are you an author, or do you see a problem with this page? Request a review
Data sources
Bibliographic data: Semantic Scholar, OpenAlex, Crossref.
Contains information from the Semantic Scholar Academic Graph Datasets, made available under the ODC Attribution License (ODC-BY 1.0).
Semantic Scholar’s data is described in: Kinney, R., et al. (2023). The Semantic Scholar Open Data Platform. arXiv:2301.10140.
