

The DOI matches its Crossref record; 50 of the 50 references it cites were found in a registry or an index.
TREM2 deficiency attenuates neuroinflammation and protects against neurodegeneration in a mouse model of tauopathy
Open accessAbstract
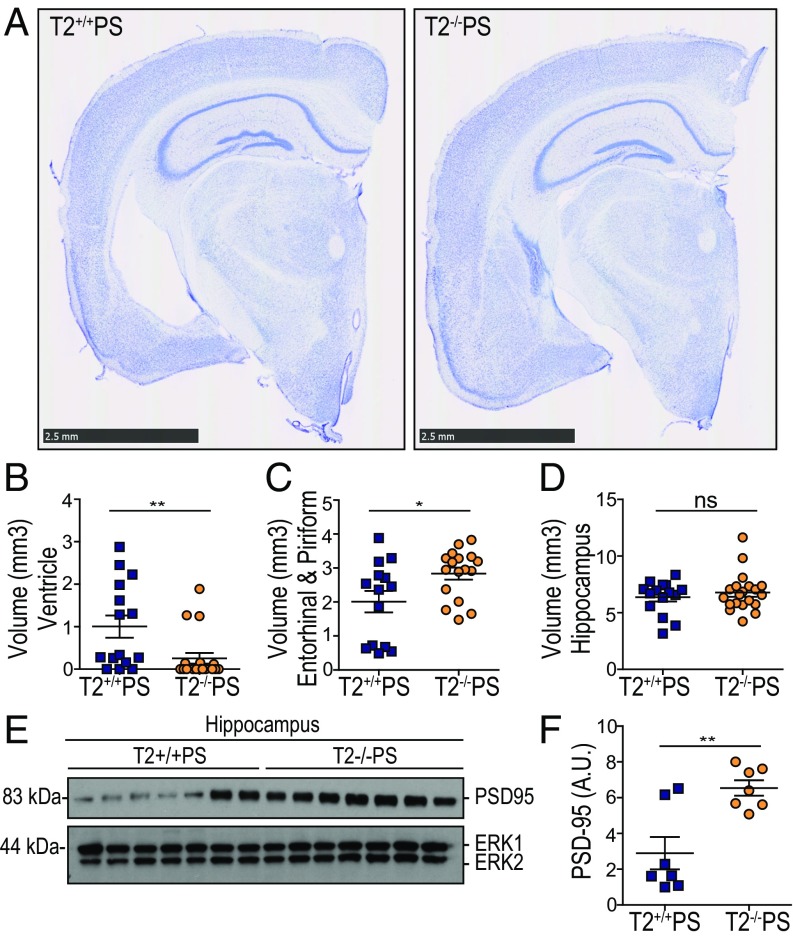
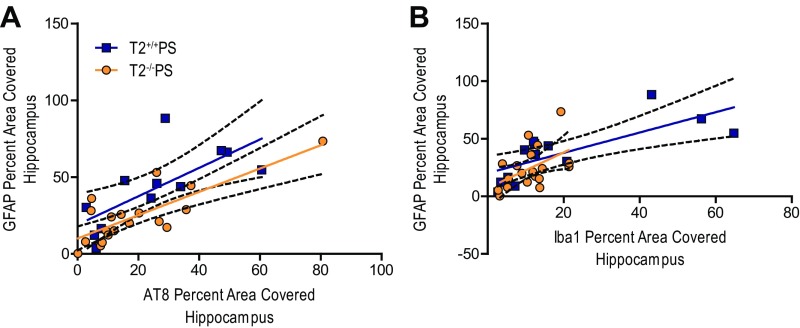
Significance: Alzheimer’s disease (AD) is the most common cause of dementia and is a major public health problem for which there is currently no disease-modifying treatment. There is an urgent need for greater understanding of the molecular mechanisms underlying neurodegeneration in patients to create better therapeutic options. Recently, genetic studies uncovered novel AD risk variants in the microglial receptor, triggering receptor expressed on myeloid cells 2 (TREM2). Previous studies suggested that loss of TREM2 function worsens amyloid-β (Aβ) plaque-related toxicity. In contrast, we observe TREM2 deficiency mitigates neuroinflammation and protects against brain atrophy in the context of tau pathology. These findings indicate dual roles for TREM2 and microglia in the context of amyloid versus tau pathology, which are important to consider for potential treatments targeting TREM2.
Overview
The claims and statistics of this paper haven’t been checked yet.
Run the check — free, no account needed. It reads the open-access text and checks the sources it cites.
Integrity signals
Registry
Cites
Statistics
Figures
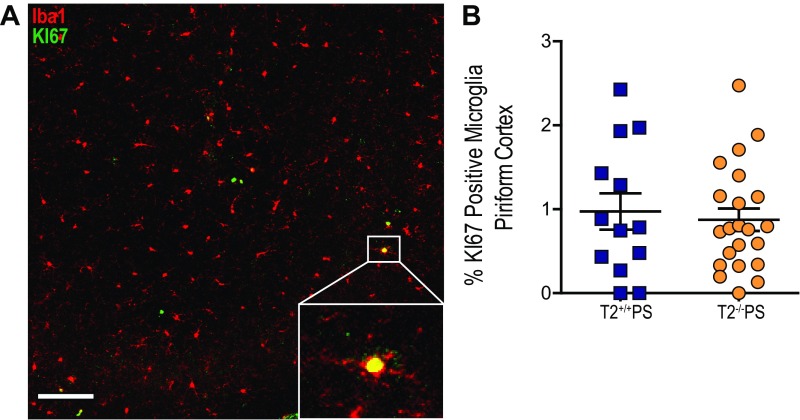
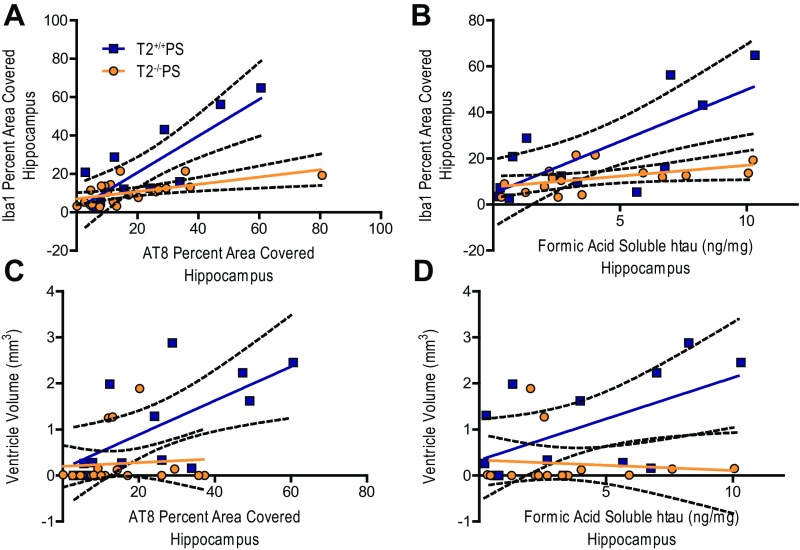
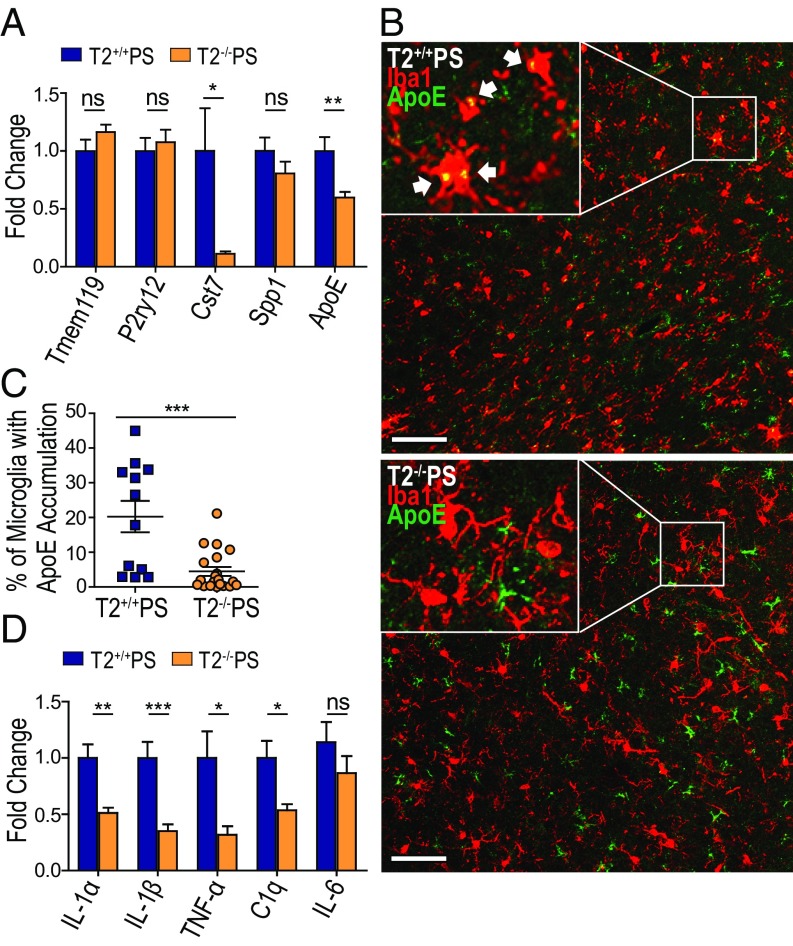
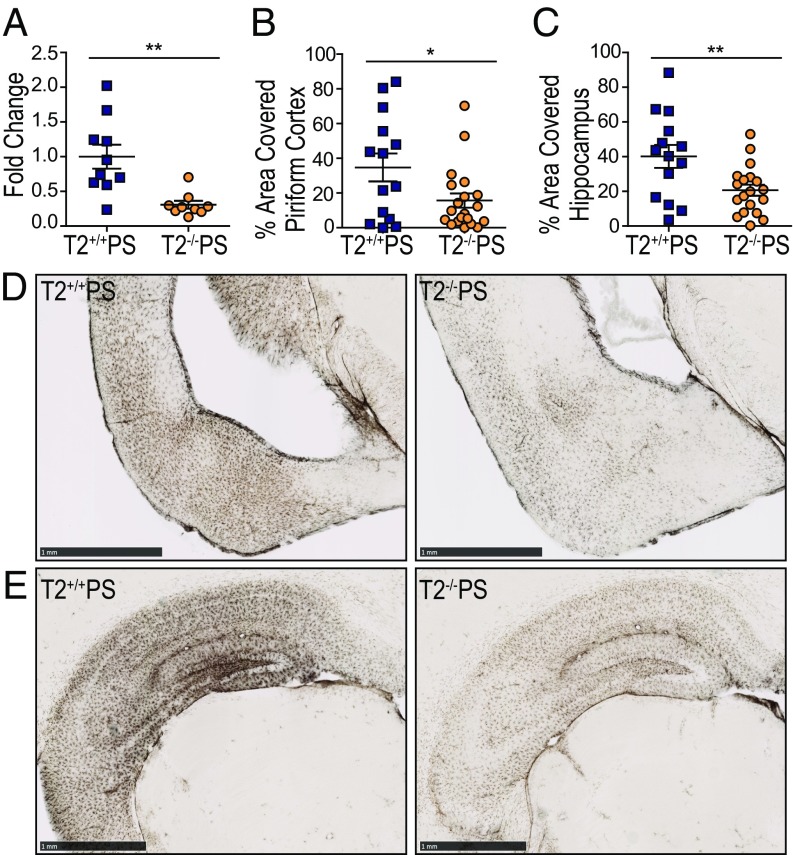
Verification
Claims the paper makes
The claims and statistics of this paper haven’t been checked yet.
Run the check — free, no account needed. It reads the open-access text and checks the sources it cites.
Claims other papers make about this one
Each is checked against this paper’s own text: does it say what the citing paper says it does?
The source backs part of the claim, not all of it — or backs it for a different population, condition or comparison.
In the citing paper
“Earlier studies on other microglial AD risk genes reported opposing effects on AD-related pathologies using various animal models at different ages (8–14).”
From The effect of Abi3 locus deletion on the progression of Alzheimer’s disease-related pathologies (2023) · cites this paper as [14]
Experimental — accuracy not yet measuredThe source backs part of the claim, not all of it — or backs it for a different population, condition or comparison.
In the citing paper
“On the other hand, in PS19 tau transgenic mice that express human tau containing the P301S mutation (in the absence of plaque pathology), loss of TREM2 was protective against brain atrophy and synapse loss [41, 42], and this protective effect was abolished in the presence of ApoE4 [43].”
From Microglial function, INPP5D/SHIP1 signaling, and NLRP3 inflammasome activation: implications for Alzheimer’s disease (2023) · cites this paper as [41]
Experimental — accuracy not yet measuredThe source backs part of the claim, not all of it — or backs it for a different population, condition or comparison.
In the citing paper
“the knockdown of TREM2 could alleviate the neuroinflammation and prevent neurodegeneration of tau pathology in TREM2−/−PS mice compared with wild-type mice (Leyns et al., 2017).”
From AD-Like Neuropsychiatric Dysfunction in a Mice Model Induced by a Combination of High-Fat Diet and Intraperitoneal Injection of Streptozotocin (2024) · cites this paper as Leyns et al., 2017
Experimental — accuracy not yet measuredThe source backs part of the claim, not all of it — or backs it for a different population, condition or comparison.
In the citing paper
“Indeed, manipulation of expression of Trem2, Tyrobp, Cx3cl1/Cx3cr1, IL1β, and IFN-γ have all been shown to have opposing effects on amyloid and tau pathologies [49–51, 55–65].”
From Deletion of Abi3/Gngt2 influences age-progressive amyloid β and tau pathologies in distinctive ways (2022) · cites this paper as [50]
Experimental — accuracy not yet measuredThe cited source says what the claim attributes to it.
In the citing paper
“Trem2 deficiency attenuates neurodegeneration in Tau transgenic mice and seems to reduce the neuroinflammatory response [146].”
From Neuron Loss in Alzheimer’s Disease: Translation in Transgenic Mouse Models (2020) · cites this paper as [146]
The cited source says what the claim attributes to it.
In the citing paper
“These studies have led to the notion that microglia can have differential effects on AD pathology depending on the disease stage.”
From The effect of Abi3 locus deletion on the progression of Alzheimer’s disease-related pathologies (2023) · cites this paper as [14]
The cited source says what the claim attributes to it.
In the citing paper
“However, TREM2 ablation was protective and decreased synaptic impairment and neurodegenerative phenotypes [13] in the PS19 mouse model [17].”
From TREM2-Deficient Microglia Attenuate Tau Spreading In Vivo (2023) · cites this paper as [13]
The cited source says what the claim attributes to it.
In the citing paper
“Collectively, these studies yielded disparate results regarding the effect of TREM2 on tau pathology and whether the effect is amyloid dependent or independent.”
From TREM2-Deficient Microglia Attenuate Tau Spreading In Vivo (2023) · cites this paper as [13]
The cited source says what the claim attributes to it.
In the citing paper
“TREM2 loss-of-function studies have also yielded conflicting outcomes in the context of tau pathology.”
From TREM2-Deficient Microglia Attenuate Tau Spreading In Vivo (2023) · cites this paper as [13]
The cited source says what the claim attributes to it.
In the citing paper
“brain atrophy and microgliosis were reduced [13].”
From TREM2-Deficient Microglia Attenuate Tau Spreading In Vivo (2023) · cites this paper as [13]
The cited source says what the claim attributes to it.
In the citing paper
“total deletion of TREM2 did not affect tau pathology in PS19 mice crossed with Trem2 KO mice”
From TREM2-Deficient Microglia Attenuate Tau Spreading In Vivo (2023) · cites this paper as [13]
The cited source says what the claim attributes to it.
In the citing paper
“The authors did not observe differences in microglia proliferation in PS19 mice regardless of Trem2 genotype”
From TREM2-Deficient Microglia Attenuate Tau Spreading In Vivo (2023) · cites this paper as [13]
The cited source says what the claim attributes to it.
In the citing paper
“a decrease in inflammatory transcripts was observed in PS19 mice due to TREM2 ablation”
From TREM2-Deficient Microglia Attenuate Tau Spreading In Vivo (2023) · cites this paper as [13]
The cited source says what the claim attributes to it.
In the citing paper
“it has been shown that TREM2 downregulation affects the phenotype of GFAP-positive astrocytes in the APP/PS1 amyloid mouse model and the PS19 model of tauopathy [8,13].”
From TREM2-Deficient Microglia Attenuate Tau Spreading In Vivo (2023) · cites this paper as [13]
The cited source says what the claim attributes to it.
In the citing paper
“suggesting that TREM2-deficient microglia may undergo metabolic stress, impacting their function and capacity to respond to damage incited by tauopathy, possibly leading to inadvertent cell death [13].”
From TREM2-Deficient Microglia Attenuate Tau Spreading In Vivo (2023) · cites this paper as [13]
The cited source says what the claim attributes to it.
In the citing paper
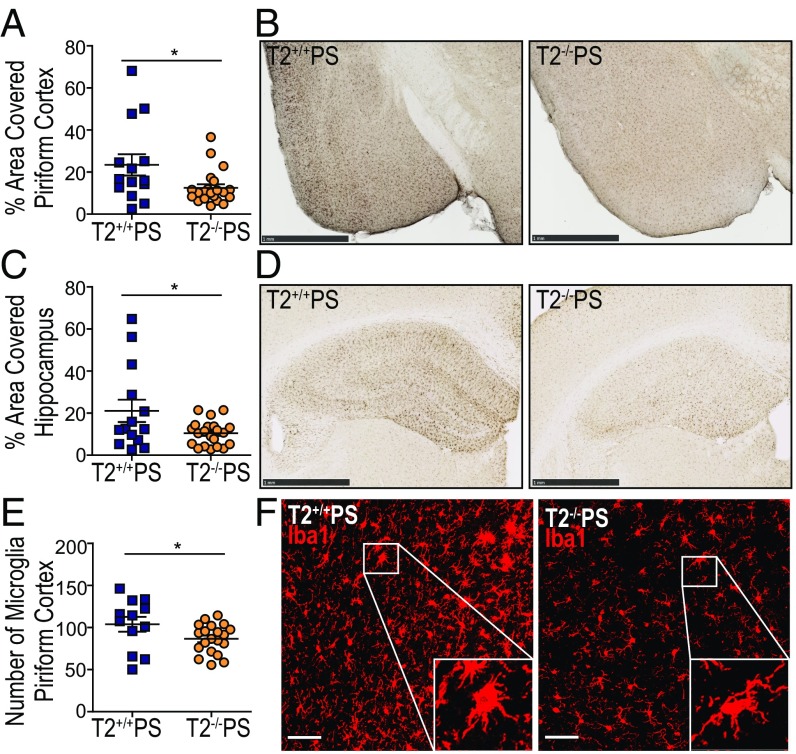
“the ablation of TREM2 in the PS19 mouse model decreased the number of IBA1-positive microglia in regions affected by tau pathology [13]”
From TREM2-Deficient Microglia Attenuate Tau Spreading In Vivo (2023) · cites this paper as [13]
The cited source says what the claim attributes to it.
In the citing paper
“suggesting that loss of TREM2 function impacts microglial activation, hindering inflammatory responses [13].”
From TREM2-Deficient Microglia Attenuate Tau Spreading In Vivo (2023) · cites this paper as [13]
The cited source says what the claim attributes to it.
In the citing paper
“Interestingly, TREM2 deficiency also protects against tau-associated neurodegeneration in P301S mice (Leyns et al., 2017).”
From Overexpressing low‐density lipoprotein receptor reduces tau‐associated neurodegeneration in relation to apoE‐linked mechanisms (2021) · cites this paper as Leyns et al., 2017
The cited source says what the claim attributes to it.
In the citing paper
“More recently, this dichotomy has been elegantly demonstrated in multiple models of Trem2 and Tyrobp [49–51, 55–59].”
From Deletion of Abi3/Gngt2 influences age-progressive amyloid β and tau pathologies in distinctive ways (2022) · cites this paper as [50]
In the citing paper
“In contrast, in tau-P301S transgenic mice, TREM2 deletion attenuates neuroinflammation and protects against neurodegeneration at a late stage without altering tau phosphorylation and aggregation [127].”
From Tau and neuroinflammation in Alzheimer’s disease: interplay mechanisms and clinical translation (2023) · cites this paper as [127]
In the citing paper
“other studies found that TREM2 deficiency significantly reduced brain atrophy and prevented microglial activation in tau transgenic mice.”
From Microglia in neurodegenerative diseases: mechanism and potential therapeutic targets (2023) · cites this paper as [178]
In the citing paper
“In the tau model of neurodegeneration, genetic deletion of either Apoe or Trem2 also arrested neurodegeneration, demonstrating that this pathway negatively regulates the homeostatic signature182,183.”
From Microglial signatures and their role in health and disease (2018) · cites this paper as [183]
In the citing paper
“References 182 and 183 connect TREM2 and ApoE signalling with exacerbation of neuroinflammation and tauopathy.”
From Microglial signatures and their role in health and disease (2018) · cites this paper as [183]
In the citing paper
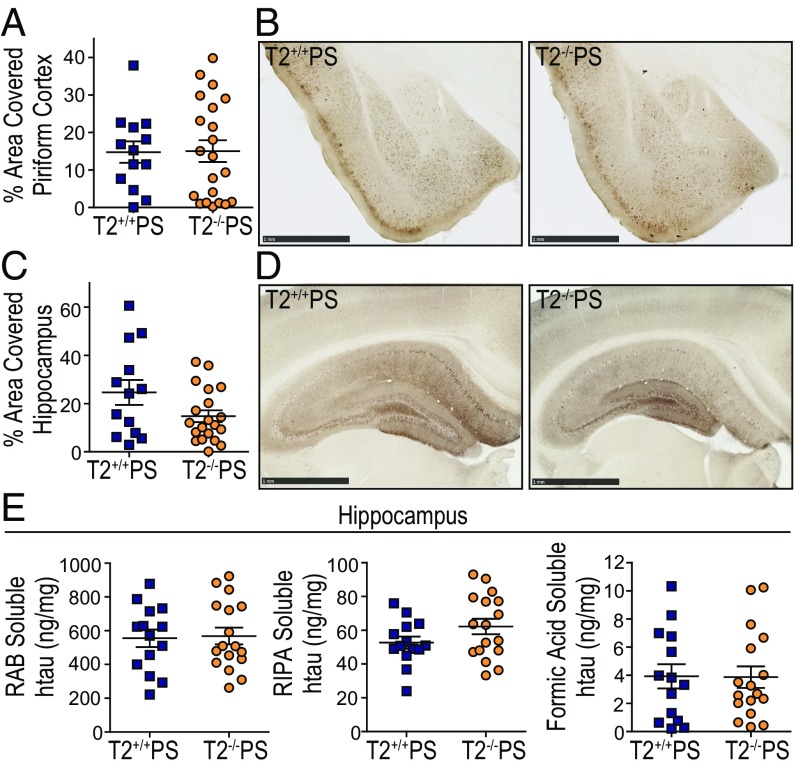
“TREM2 deficiency is reported to enhance tau hyperphosphorylation at an early disease stage in htau mice65 and a mid-disease stage in P301S mice [G]66, but does not affect tau pathology at a late-disease stage in P301S mice67”
From Interplay between innate immunity and Alzheimer disease: APOE and TREM2 in the spotlight (2018) · cites this paper as [67]
In the citing paper
“End-stage TREM2−/− P301S mice that exhibit significantly reduced microgliosis and downregulated MGnD genes such as ApoE and cystatin 7 (Cst7), show significantly attenuated brain atrophy compared to TREM2+/+ P301S mice despite no change of tau pathology67.”
From Interplay between innate immunity and Alzheimer disease: APOE and TREM2 in the spotlight (2018) · cites this paper as [67]
In the citing paper
“Targeting TREM2 signaling in the facial nerve axotomy model ameliorates neuronal loss28, and ablation of TREM2 in tauopathy mice attenuates neuroinflammation and neurodegeneration67, similar to the effect of ApoE deletion.”
From Interplay between innate immunity and Alzheimer disease: APOE and TREM2 in the spotlight (2018) · cites this paper as [67]
In the citing paper
“This work shows that dampening neurodegenerative microglial activation via TREM2 deletion reduces neurodegeneration at an advanced disease stage in a tauopathy mouse model, supporting a role of microglia in modulating neurodegeneration.”
From Interplay between innate immunity and Alzheimer disease: APOE and TREM2 in the spotlight (2018) · cites this paper as [67]
In the citing paper
“This work shows that dampening neurodegenerative microglial activation via TREM2 deletion reduces neurodegeneration at an advanced disease stage in a tauopathy mouse model, supporting a role of microglia in modulating neurodegeneration.”
From Interplay between innate immunity and Alzheimer disease: APOE and TREM2 in the spotlight (2018) · cites this paper as [67]
Self-check
Percentages, sums and reported differences re-computed from the paper’s own numbers.
The self-check needs the paper’s full text.
Citations
Cites
The Mouse Brain in Stereotaxic Coordinates
Paxinos, G. (2001) · Cited by 12,859
Neurotoxic reactive astrocytes are induced by activated microglia
Liddelow, S. A., Guttenplan, K. A., Clarke, L. E., Bennett, F. C., Bohlen, C. J., Schirmer, L., Bennett, M. L., Münch, A. E., Chung, W.-S., Peterson, T. C., et al. (2017) · Nature · doi:10.1038/nature21029 · Cited by 7,971 · cited 1×
“Recent studies have further demonstrated that microglia can influence astrocyte reactivity in several disease models (34, 35).”
BackgroundA Unique Microglia Type Associated with Restricting Development of Alzheimer’s Disease
Keren-Shaul, H., Spinrad, A., Weiner, A., Matcovitch-Natan, O., Dvir-Szternfeld, R., Ulland, T. K., David, E., Baruch, K., Lara-Astaiso, D., Toth, B., et al. (2017) · Cell · doi:10.1016/j.cell.2017.05.018 · Cited by 5,493
Self-citationTREM2 Variants in Alzheimer's Disease
Guerreiro, R., Wojtas, A., Bras, J., Carrasquillo, M., Rogaeva, E., Majounie, E., Cruchaga, C., Sassi, C., Kauwe, J. S. K., Younkin, S., et al. (2013) · New England Journal of Medicine · doi:10.1056/nejmoa1211851 · Cited by 3,020
Krasemann, S., Madore, C., Cialic, R., Baufeld, C., Calcagno, N., El Fatimy, R., Beckers, L., O’Loughlin, E., Xu, Y., Fanek, Z., et al. (2017) · Immunity · doi:10.1016/j.immuni.2017.08.008 · Cited by 2,979
Self-citationVariant of TREM2 Associated with the Risk of Alzheimer's Disease
Jonsson, T., Stefansson, H., Steinberg, S., Jonsdottir, I., Jonsson, P. V., Snaedal, J., Bjornsson, S., Huttenlocher, J., Levey, A. I., Lah, J. J., et al. (2013) · New England Journal of Medicine · doi:10.1056/nejmoa1211103 · Cited by 2,558 · cited 1×
“The discovery that rare coding variants in the triggering receptor expressed on myeloid cells 2 (TREM2) are associated with a twofold to fourfold increased risk for developing sporadic, lateonset AD further implicates the role of microglia in AD (6, 7).”
BackgroundSynapse Loss and Microglial Activation Precede Tangles in a P301S Tauopathy Mouse Model
Yoshiyama, Y., Higuchi, M., Zhang, B., Huang, S.-M., Iwata, N., Saido, T. C., Maeda, J., Suhara, T., Trojanowski, J. Q., & Lee, V. M.-Y. (2007) · Neuron · doi:10.1016/j.neuron.2007.01.010 · Cited by 2,208
How neuroinflammation contributes to neurodegeneration
Ransohoff, R. M. (2016) · Science · doi:10.1126/science.aag2590 · Cited by 1,967 · cited 1×
“Chronic microglial activation has been hypothesized to lead to excessive neuroinflammation that may exacerbate AD pathologies and neurodegeneration (43).”
BackgroundTREM2 Lipid Sensing Sustains the Microglial Response in an Alzheimer’s Disease Model
Wang, Y., Cella, M., Mallinson, K., Ulrich, J. D., Young, K. L., Robinette, M. L., Gilfillan, S., Krishnan, G. M., Sudhakar, S., Zinselmeyer, B. H., et al. (2015) · Cell · doi:10.1016/j.cell.2015.01.049 · Cited by 1,736
Self-citationAlzheimer’s Disease: The Challenge of the Second Century
Holtzman, D. M., Morris, J. C., & Goate, A. M. (2011) · Science Translational Medicine · doi:10.1126/scitranslmed.3002369 · Cited by 1,424 · cited 1×
“Amyloid-β (Aβ) aggregates form extracellular plaques, while hyperphosphorylated tau (p-tau) is present in intracellular neurofibrillary tangles (1).”
BackgroundSelf-citation
Cited by
Sorted by citations
Items 501–519 of 519
Kong, Z., Shen, L., Ma, D., & Hou, J. (2026) · Clinical and Translational Discovery · doi:10.1002/ctd2.70140
Soluble TREM2 reduces DAP12 surface expression by dissociating the TREM2–DAP12 complexPreprint
Yamada, A., & Tsuruta, F. (2026) · bioRxiv (Cold Spring Harbor Laboratory) · doi:10.64898/2026.05.05.723083
BCG vaccination mitigates tau pathology and restores cognitive function in PS19 micePreprint
Shee, S., Huang, M., Baghel, M. S., Zheng, Y., Lun, S., Yadav, S. K., Yadav, N. N., Ruiz-Gonzalez, C. E., Tyagi, S., Nuermberger, E. L., et al. (2026) · bioRxiv (Cold Spring Harbor Laboratory) · doi:10.64898/2026.05.12.724591
TREM2-Targeting peptide tracer for neuroinflammation PET imaging
Zhang, X., Liu, W., Guo, N., Gao, X., Pu, S., Yang, Y., Zha, X., Ding, K., Shi, D., Zhao, J., et al. (2026) · European Journal of Nuclear Medicine and Molecular Imaging · doi:10.1007/s00259-026-07929-9
Liao, Y., Ye, S., Zhao, L., Zhou, M., Wen, Y., Zhu, Y., Huang, J., 张罗青, Zhang, X., Guo, P., et al. (2026) · Molecular Neurobiology · doi:10.1007/s12035-026-05925-6
“Paradoxically, several studies demonstrate that the complete deletion of TREM2 may attenuate neuroinflammation and diminish Tau spreading in specific tauopathy models [41, 42].”
Chronic pain in Alzheimer disease and the role of neuroimmune interactions
Malcangio, M., & Sideris-Lampretsas, G. (2026) · Pharmacological Reviews · doi:10.1016/j.pharmr.2026.100149
“169 These preclinical findings suggest that the TREM2 pathway in microglia contributes to neurodegeneration in models of tauopathy.”
Clinical Indication of the Role of Inflammation in Alzheimer’s Disease
Kumar, A., Sarkar, N., Kundu, M., Singh, V., & Dasgupta, D. (2026) · BENTHAM SCIENCE PUBLISHERS eBooks · doi:10.2174/9798898815646126010010
Wang, H., Wen, R., Parker, E., & Yang, L. (2026) · Cell Communication and Signaling · doi:10.1186/s12964-026-03083-9 · Cited by 2
“In pP5-183 mice without Aβ pathology or PS19 mice with pure tau lesions [119, 121], TREM2 deficiency does not affect tau accumulation, propagation, phosphorylated tau levels, or insoluble tau levels.”
Wu, P., Liao, Y., Liu, C., Liu, X., Feng, Q., & Cheng, X. (2026) · Molecular Neurobiology · doi:10.1007/s12035-026-06066-6
Targeting Microglial Receptors for Alzheimer’s Disease: Translational Barriers from Bench to Bedside
Tang, X., Hasan, I., & Xu, J. (2026) · Neuropharmacology and Therapy · doi:10.15212/npt-2026-0008
Wu, Y., Duan, L., Zhang, L., Wang, S., Yan, H., He, M., Wang, T., Li, L., & Gao, Y. (2026) · Frontiers in Immunology · doi:10.3389/fimmu.2026.1912989
Gene therapy in Alzheimer’s disease (AD)
Bemanalizadeh, M., Ashrafi, M., Eslami, M., Moein, S., Kazemi, A., & Mansouri, V. (2026) · Elsevier eBooks · doi:10.1016/b978-0-443-40467-2.00014-2
Intharuksa, A., Prasansuklab, A., Techarang, T., Chaikhong, K., Arunotayanun, W., & Jenraumjit, R. (2026) · Nutrients · doi:10.3390/nu18193126
“In experimental tauopathy models, reduced TREM2 signaling has been associated with attenuated neuroinflammation and neurodegeneration, highlighting a stage-and pathology-dependent role for this pathway [19].”
Oon, C. H., Levitt, E. M., Shapiro, D. A., O’Brien, C. A., Davis, M. R., Shestova, O., Axsom, J., Yaqoob, F., Lomeikaitė, V., Koumadorakis, D., et al. (2026) · Research Square · doi:10.21203/rs.3.rs-10963419/v1
TREM2 Orchestrates Myeloid Cell Programming and Immune Dysregulation in Pulmonary HypertensionPreprint
de Oliveira, A. C., da Silva, F., Zhang, Y., Alves, M. D., Pham, A. T., Harris, C. L., Khanfar, S., Abdelnor, R., Alvarez-Castanon, J. V., Philips, C. M., et al. (2026) · bioRxiv (Cold Spring Harbor Laboratory) · doi:10.64898/2026.09.18.752808
Mercado, C., Amaro, A., Martínez-Pinto, J., Vidal, R., Jury, N., & Lasagna‐Reeves, C. A. (2026) · Journal of Neuroinflammation · doi:10.1186/s12974-026-04065-x
Shi, H., Zhao, Y., Wei, Z., Yan-jiang, W., & Bu, X.-L. (2026) · Trends in Neurosciences · doi:10.1016/j.tins.2026.09.009
BCG vaccination mitigates tau pathology and restores cognitive function in PS19 mice
Shee, S., Huang, M., Baghel, M. S., Zheng, Y., Lun, S., Yadav, S. K., Yadav, N. N., Ruiz-Gonzalez, C. E., Tyagi, S. K., Nuermberger, E. L., et al. (2026) · Science Advances · doi:10.1126/sciadv.aej4603
“As phospho-tau (p-tau) accumulates in the PS19 mouse brains, microglial cells are seen to transition from a homeostatic, surveillant state to an activated phenotype that amplifies proinflammatory cytokine signaling, complement cascades, and contributes to synaptic loss ( 19 , 22 – 25 ).”
TIA1 is required for microglial activation in tauopathy
Webber, C. J., van der Spek, S. J. F., Cruz, A. L., Puri, S., Shao, Y., Zhang, C., Aw, J. T. M., Papadimitriou, G.-Z., Roberts, R., Jiang, K., et al. (2026) · Cell Reports · doi:10.1016/j.celrep.2026.118199
Metadata
- Authors
- Leyns, C. E. G., Ulrich, J. D., Finn, M. B., Stewart, F. R., Koscal, L. J., Remolina Serrano, J., Robinson, G. O., Anderson, E., Colonna, M., & Holtzman, D. M.
- Affiliations
- Washington University in St. Louis (US)
- Department of Neurology, Washington University School of Medicine, St. Louis, MO 63110;
- Corresponding author
- Holtzman, David M.
- ORCID
- Venue
- Proceedings of the National Academy of Sciences
- Publisher
- National Academy of Sciences
- Published
- 2017-10-09
- Volume
- 114
- Issue
- 43
- Pages
- 11524-11529
- ISSN
- 0027-8424 (ISSN-L)
- 1091-6490
- PMC
- PMC5663386
- OpenAlex
- W2763928642
- Cited by
- 517
- References
- 50
- Citations by year
- 2026: 41 · 2025: 51 · 2024: 55 · 2023: 78 · 2022: 79 · 2021: 69 · 2020: 54 · 2019: 44 · 2018: 42 · 2017: 3
- FWCI
- 19.48
- Type
- journal article
- Language
- en
- Open access
- hybrid
- doi.org
- Licence
- Locations
- Proceedings of the National Academy of Sciences (publishedVersion, cc-by-nc-nd)
- PubMed Central (publishedVersion, cc-by-nc-nd)
- PubMed (publishedVersion)
- Digital Commons@Becker (Washington University School of Medicine) (submittedVersion, cc-by-nc-nd)
- Funders
- Cure Alzheimer's Fund
- Hope Center for Neurological Disorders
- Center for Cellular Imaging, Washington University
- National Institute on Aging (F31AG053976)
- Topics
- Life Sciences › Neuroscience › Neurology › Neuroinflammation and Neurodegeneration Mechanisms
- Life Sciences › Neuroscience › Cellular and Molecular Neuroscience › Alzheimer's disease research and treatments
- Life Sciences › Neuroscience › Neurology › Neurological Disease Mechanisms and Treatments
- Keywords
- TREM2, tauopathy, neuroinflammation, neurodegeneration, Alzheimer's disease, microglia, tau pathology, brain atrophy, amyloid-beta, TREM2 deficiency, mouse model
- MeSH terms
- Animals, Gene Expression Regulation, Inflammation, Membrane Glycoproteins, Mice, Transgenic, Receptors, Immunologic, Mice, Knockout, Neurodegenerative Diseases, Tauopathies, Mice
About these checks
Registry, retraction, Cites and statistics results are computed, not judged, with one exception: a printed reference that no index lists is read once by a model before it counts as a citation error. Claims are extracted by a model and kept only when their quote appears verbatim in the text; each cited source is then checked, with a model’s help, for whether it says what the claim relies on. Those verdicts can be wrong — read the claim’s quote and the cited source before relying on one.
Statistics and arithmetic are recomputed, not judged.
Confidence bands are shown only for fields calibrated on our annotated test set. None is calibrated yet, so no band is shown.
What counts as a claim ›How we measure confidence ›How we check this ›
Are you an author, or do you see a problem with this page? Request a review
