Cited by 61

The DOI matches its Crossref record; 8 of the 8 references it cites were found in a registry or an index.

Chemokine receptors CCR2 and CX3CR1 regulate viral encephalitis-induced hippocampal damage but not seizures

Käufer, Christopher, Chhatbar, Chintan, Bröer, Sonja, Waltl, Inken, Ghita, Luca, Gerhauser, Ingo, Kalinke, Ulrich, Löscher, Wolfgang·2018·Proceedings of the National Academy of Sciences

Abstract

Significance: Viral encephalitis is a frequent medical emergency, often resulting in acute seizures and brain damage, which reduce quality of life, promote the development of epilepsy, and can cause death. The relative roles of activation of microglia, the brain-resident innate immune cells, versus invasion of blood-borne immune cells such as monocytes in the acute and chronic consequences of viral encephalitis are only incompletely understood. Here we show that lack of the chemokine receptors CCR2 or CX3CR1, which regulate the responses of myeloid cells such as monocytes and microglia, prevents hippocampal damage but not seizures in a mouse model of viral encephalitis. Treatment strategies aimed at inhibiting peripheral immune cells from entering the brain during encephalitis could reduce brain damage.

Overview

The claims and statistics of this paper haven’t been checked yet.

Run the check — free, no account needed. It reads the open-access text and checks the sources it cites.

A few free checks a day · papers already verified open instantly · results are public

Integrity signals

Registry

Crossref · 10.1073/pnas.1806754115

Cites

8 of 8 references verified0 citation errors · 0 not checkable

Statistics

Figures

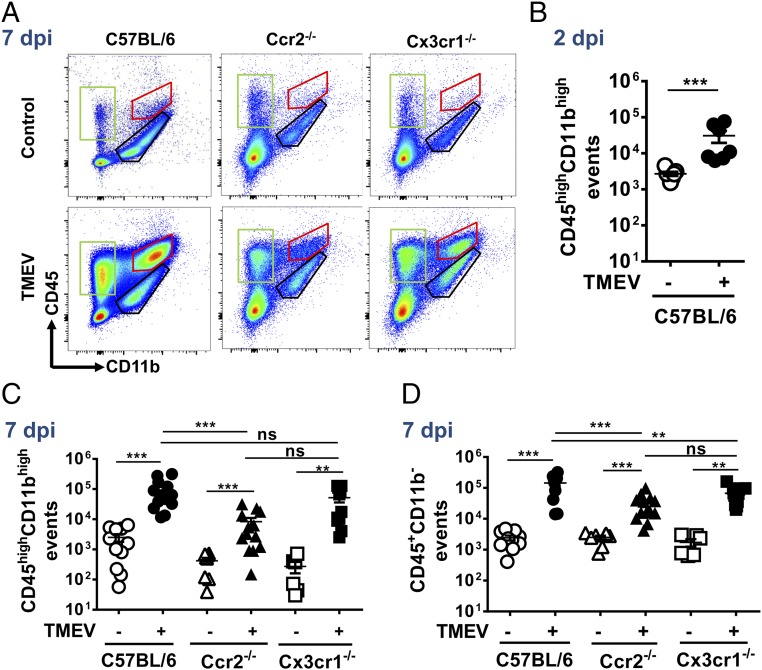
Fig. 1. Decreased accumulation of myeloid cells in the brains of CCR2-deficient but not CX3CR1-deficient mice after intracranial TMEV infection. C57BL/6 WT, Ccr2-KO, and Cx3cr1-KO animals were mock infected or infected with TMEV intracranially. Animals were killed at 2 or 7 dpi. After enzymatic digestion, immune cells were isolated using Percoll gradient and were immunolabeled, and flow cytometry was performed. Myelin debris and dead cells were excluded by FSC/SSC gating, and singlet populations were analyzed. (A) Representative flow cytometry data of immune cells isolated from the brains at 7 dpi. (B) Quantification of CD45highCD11bhigh myeloid cells in the brain at 2 dpi (red-marked population in A). Shown are combined data of two independent experiments; n = 7. (C) Quantification of CD45highCD11high myeloid cells in the brain at 7 dpi (red-marked population in A). Shown are combined data of two independent experiments; n = 6–14). (D) Quantification of CD45+CD11b− cells in the brain at 7 dpi (green-marked population in A). Shown are combined data of two independent experiments; n = 6–13). The data in B–D are shown as mean ± SEM (plus individual data). Analysis of data in C by two-way ANOVA indicated a significant effect of infection [F (1, 57) = 13.91; P = 0.0004], genotype [F (2, 57) = 3.98; P = 0.0241], and interaction [F (2, 57) = 3.601; P = 0.0337]. Similar, analysis of data in D indicated a significant effect of infection [F (1, 52) = 36.29; P < 0.0001], genotype [F (2, 52) = 7.054; P = 0.0019], and interaction [F (2, 52) = 7.034; P = 0.002]. Post hoc results in B–D are indicated by asterisks: **P < 0.01; ***P < 0.001); ns, not significant.
Fig. 1. Decreased accumulation of myeloid cells in the brains of CCR2-deficient but not CX3CR1-deficient mice after intracranial TMEV infection. C57BL/6 WT, Ccr2-KO, and Cx3cr1-KO animals were mock infected or infected with TMEV intracranially. Animals were killed at 2 or 7 dpi. After enzymatic digestion, immune cells were isolated using Percoll gradient and were immunolabeled, and flow cytometry was performed. Myelin debris and dead cells were excluded by FSC/SSC gating, and singlet populations were analyzed. (A) Representative flow cytometry data of immune cells isolated from the brains at 7 dpi. (B) Quantification of CD45highCD11bhigh myeloid cells in the brain at 2 dpi (red-marked population in A). Shown are combined data of two independent experiments; n = 7. (C) Quantification of CD45highCD11high myeloid cells in the brain at 7 dpi (red-marked population in A). Shown are combined data of two independent experiments; n = 6–14). (D) Quantification of CD45+CD11b− cells in the brain at 7 dpi (green-marked population in A). Shown are combined data of two independent experiments; n = 6–13). The data in B–D are shown as mean ± SEM (plus individual data). Analysis of data in C by two-way ANOVA indicated a significant effect of infection [F (1, 57) = 13.91; P = 0.0004], genotype [F (2, 57) = 3.98; P = 0.0241], and interaction [F (2, 57) = 3.601; P = 0.0337]. Similar, analysis of data in D indicated a significant effect of infection [F (1, 52) = 36.29; P < 0.0001], genotype [F (2, 52) = 7.054; P = 0.0019], and interaction [F (2, 52) = 7.034; P = 0.002]. Post hoc results in B–D are indicated by asterisks: **P < 0.01; ***P < 0.001); ns, not significant.CC BY-NC-ND · PubMed Central
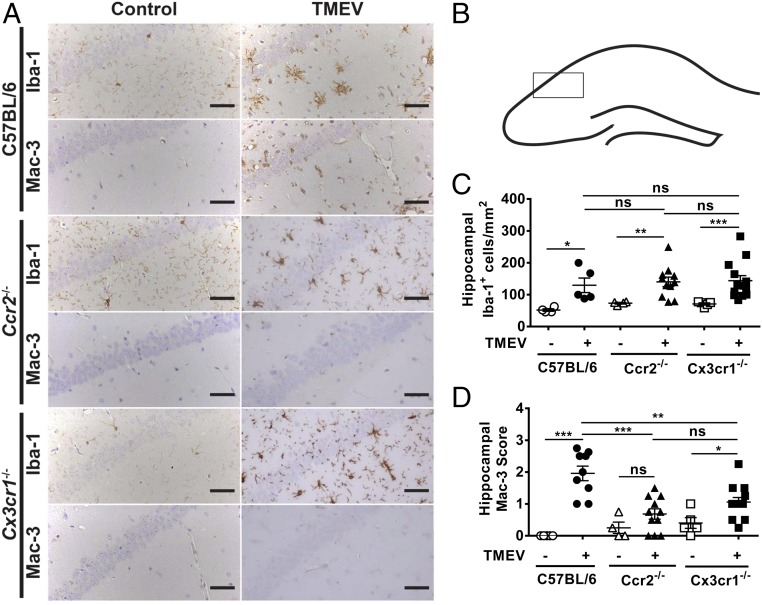
Fig. 2. Genetic deficiency of CCR2 but not CX3CR1 leads to decreased activation of myeloid cells in the hippocampus after intracranial TMEV infection. Animals were treated as described in Fig. 1. On day 7 after perfusion brains were removed, and immunohistology was performed. (A) Representative examples of Iba-1– and Mac-3–stained hippocampal sections. (Scale bars: 50 µm.) (B) Area of the hippocampus from which the sections shown in A were taken. (C) Quantification of hippocampal Iba-1+ cells shown in A. (D) Semiquantitative data for Mac-3 staining shown in A. The data in C and D are shown as mean ± SEM (plus individual data). Analysis of data in C by two-way ANOVA indicated a significant effect of infection [(F (1, 36) = 20.89; P < 0.0001] but not genotype [F (2, 36) = 0.4272; P = 0.6556] or interaction [F (2, 36) = 0.03501; P = 0.9656]. Analysis of data in D indicated a significant effect of infection [F (1, 41) = 38.21; P < 0.0001], genotype [F (2, 41) = 3.088; P ≤ 0.05], and interaction [F (2, 41) = 8.251; P = 0.0010]. Post hoc results are indicated by asterisks: *P < 0.05; **P < 0.01; ***P < 0.001; ns, not significant.
Fig. 2. Genetic deficiency of CCR2 but not CX3CR1 leads to decreased activation of myeloid cells in the hippocampus after intracranial TMEV infection. Animals were treated as described in Fig. 1. On day 7 after perfusion brains were removed, and immunohistology was performed. (A) Representative examples of Iba-1– and Mac-3–stained hippocampal sections. (Scale bars: 50 µm.) (B) Area of the hippocampus from which the sections shown in A were taken. (C) Quantification of hippocampal Iba-1+ cells shown in A. (D) Semiquantitative data for Mac-3 staining shown in A. The data in C and D are shown as mean ± SEM (plus individual data). Analysis of data in C by two-way ANOVA indicated a significant effect of infection [(F (1, 36) = 20.89; P < 0.0001] but not genotype [F (2, 36) = 0.4272; P = 0.6556] or interaction [F (2, 36) = 0.03501; P = 0.9656]. Analysis of data in D indicated a significant effect of infection [F (1, 41) = 38.21; P < 0.0001], genotype [F (2, 41) = 3.088; P ≤ 0.05], and interaction [F (2, 41) = 8.251; P = 0.0010]. Post hoc results are indicated by asterisks: *P < 0.05; **P < 0.01; ***P < 0.001; ns, not significant.CC BY-NC-ND · PubMed Central
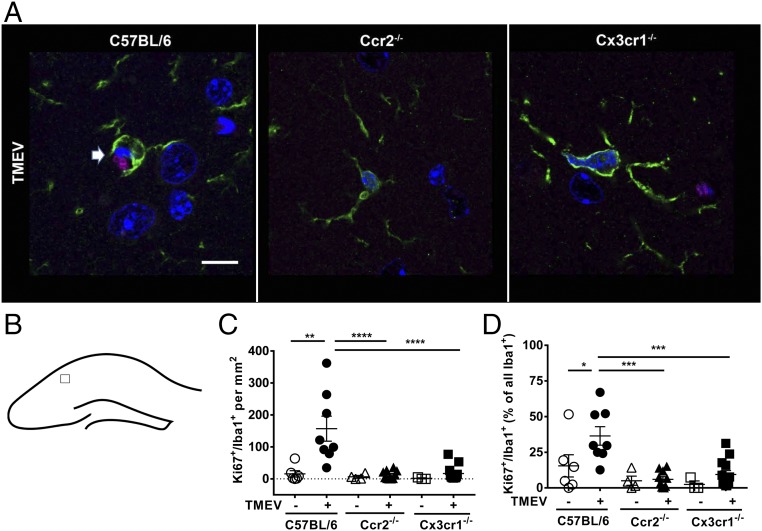
Fig. 3. Genetic deficiency of CCR2 and CX3CR1 prevents microglia proliferation in the hippocampus after intracranial TMEV infection. Animals were treated as described in Fig. 1; on day 7 after perfusion, brains were removed, and immunohistology was performed. (A) Representative examples of Iba-1 and Ki67 double-stained cells in hippocampal sections. Slice thickness was only 2 µm (Methods), so processes of Iba-1+ microglial cells (green) are often cut from the cell bodies. Cell nuclei were stained using DAPI (blue); Ki67+ is shown in magenta. A Iba-1+/Ki67+ microglial cell (arrow) can be seen in this example of an infected B6 WT mouse, while Iba-1+ cells in Ccr2-KO and Cx3cr1-KO mice are mainly negative for Ki67 (see also C). (Scale bar: 10 µm.) (B) Area of the hippocampus from which the sections shown in A were taken. (C) Quantification of Iba-1+/Ki67+ double-labeled cells shown in A in the ipsilateral hippocampus. (D) Percent of Iba-1+ cells that are also positive for Ki67 (proliferation index). The data in C and D are shown as mean ± SEM (plus individual data). Analysis of data in C by two-way ANOVA indicated a significant effect of infection [F (1, 38) = 9.88; P = 0.0032], genotype [F (2, 38) = 9.664; P = 0.0004], and interaction [F (2, 38) = 7.038; P = 0.0025]. Analysis of data in D indicated a significant effect of infection [F (1, 38) = 5.243; P = 0.0277] and genotype [F (2, 38) = 11.2; P = 0.0002] but not interaction [F (2, 38) = 2.186; P = 0.1263]. Post hoc results are indicated by asterisks: *P < 0.05; **P < 0.01; ***P < 0.001; ****P < 0.0001.
Fig. 3. Genetic deficiency of CCR2 and CX3CR1 prevents microglia proliferation in the hippocampus after intracranial TMEV infection. Animals were treated as described in Fig. 1; on day 7 after perfusion, brains were removed, and immunohistology was performed. (A) Representative examples of Iba-1 and Ki67 double-stained cells in hippocampal sections. Slice thickness was only 2 µm (Methods), so processes of Iba-1+ microglial cells (green) are often cut from the cell bodies. Cell nuclei were stained using DAPI (blue); Ki67+ is shown in magenta. A Iba-1+/Ki67+ microglial cell (arrow) can be seen in this example of an infected B6 WT mouse, while Iba-1+ cells in Ccr2-KO and Cx3cr1-KO mice are mainly negative for Ki67 (see also C). (Scale bar: 10 µm.) (B) Area of the hippocampus from which the sections shown in A were taken. (C) Quantification of Iba-1+/Ki67+ double-labeled cells shown in A in the ipsilateral hippocampus. (D) Percent of Iba-1+ cells that are also positive for Ki67 (proliferation index). The data in C and D are shown as mean ± SEM (plus individual data). Analysis of data in C by two-way ANOVA indicated a significant effect of infection [F (1, 38) = 9.88; P = 0.0032], genotype [F (2, 38) = 9.664; P = 0.0004], and interaction [F (2, 38) = 7.038; P = 0.0025]. Analysis of data in D indicated a significant effect of infection [F (1, 38) = 5.243; P = 0.0277] and genotype [F (2, 38) = 11.2; P = 0.0002] but not interaction [F (2, 38) = 2.186; P = 0.1263]. Post hoc results are indicated by asterisks: *P < 0.05; **P < 0.01; ***P < 0.001; ****P < 0.0001.CC BY-NC-ND · PubMed Central
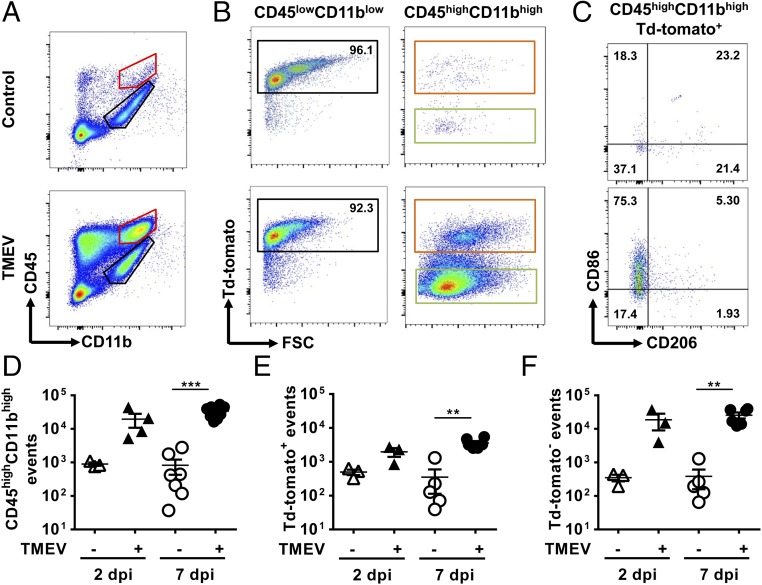
Fig. 4. A population of microglia up-regulates CD45 and becomes indistinguishable from infiltrating monocytes after intracranial TMEV infection. Tamoxifen-treated Cx3cr1-creER+/−tdTomatoSt/Wt mice were infected, and CNS immune cells were isolated as described in Fig. 1. (A) Representative flow cytometry data of immune cells isolated from brain. (B) Representative flow cytometry data of tdTomato expression on CD45lowCD11blow cells (black-marked population in A) and CD45highCD11bhigh cells (red-marked population in A). (C) Expression of CD86 and CD206 on the CD45highCD11bhightdTomato+ cells (orange-marked population in B). (D) Quantification of CD45highCD11high myeloid cells in the brain at 2 and 7 dpi (red-marked population in A). Shown are the combined data of two independent experiments; n = 3–8. (E) Quantification of tdTomato-expressing cells in the CD45highCD11bhigh population in A (orange-marked population in B); n = 3–6; shown are combined data of two independent experiments. (F) Quantification of tdTomato− cells in the CD45highCD11bhigh population in A (green-marked population in B; n = 3–6; combined data from two independent experiments are shown). The data in D–F are shown as mean ± SEM (plus individual data); open symbols represent mock-infected controls, filled symbols represent infected mice. Analysis of data in D by two-way ANOVA indicated a significant effect of infection [F (1, 18) = 25.23; P < 0.0001] but not time [F (1, 18) = 1.891; P = 0.1859] or interaction [F (1, 18) = 1.931; P = 0.1816]. Similar, analysis of data in E and F indicated only a significant effect of infection [E: F (1, 13) = 27.66; P = 0.0002; F: F (1, 13) = 17.58; P = 0.0011]. Post hoc results are indicated by asterisks: **P < 0.01; ***P < 0.001.
Fig. 4. A population of microglia up-regulates CD45 and becomes indistinguishable from infiltrating monocytes after intracranial TMEV infection. Tamoxifen-treated Cx3cr1-creER+/−tdTomatoSt/Wt mice were infected, and CNS immune cells were isolated as described in Fig. 1. (A) Representative flow cytometry data of immune cells isolated from brain. (B) Representative flow cytometry data of tdTomato expression on CD45lowCD11blow cells (black-marked population in A) and CD45highCD11bhigh cells (red-marked population in A). (C) Expression of CD86 and CD206 on the CD45highCD11bhightdTomato+ cells (orange-marked population in B). (D) Quantification of CD45highCD11high myeloid cells in the brain at 2 and 7 dpi (red-marked population in A). Shown are the combined data of two independent experiments; n = 3–8. (E) Quantification of tdTomato-expressing cells in the CD45highCD11bhigh population in A (orange-marked population in B); n = 3–6; shown are combined data of two independent experiments. (F) Quantification of tdTomato− cells in the CD45highCD11bhigh population in A (green-marked population in B; n = 3–6; combined data from two independent experiments are shown). The data in D–F are shown as mean ± SEM (plus individual data); open symbols represent mock-infected controls, filled symbols represent infected mice. Analysis of data in D by two-way ANOVA indicated a significant effect of infection [F (1, 18) = 25.23; P < 0.0001] but not time [F (1, 18) = 1.891; P = 0.1859] or interaction [F (1, 18) = 1.931; P = 0.1816]. Similar, analysis of data in E and F indicated only a significant effect of infection [E: F (1, 13) = 27.66; P = 0.0002; F: F (1, 13) = 17.58; P = 0.0011]. Post hoc results are indicated by asterisks: **P < 0.01; ***P < 0.001.CC BY-NC-ND · PubMed Central
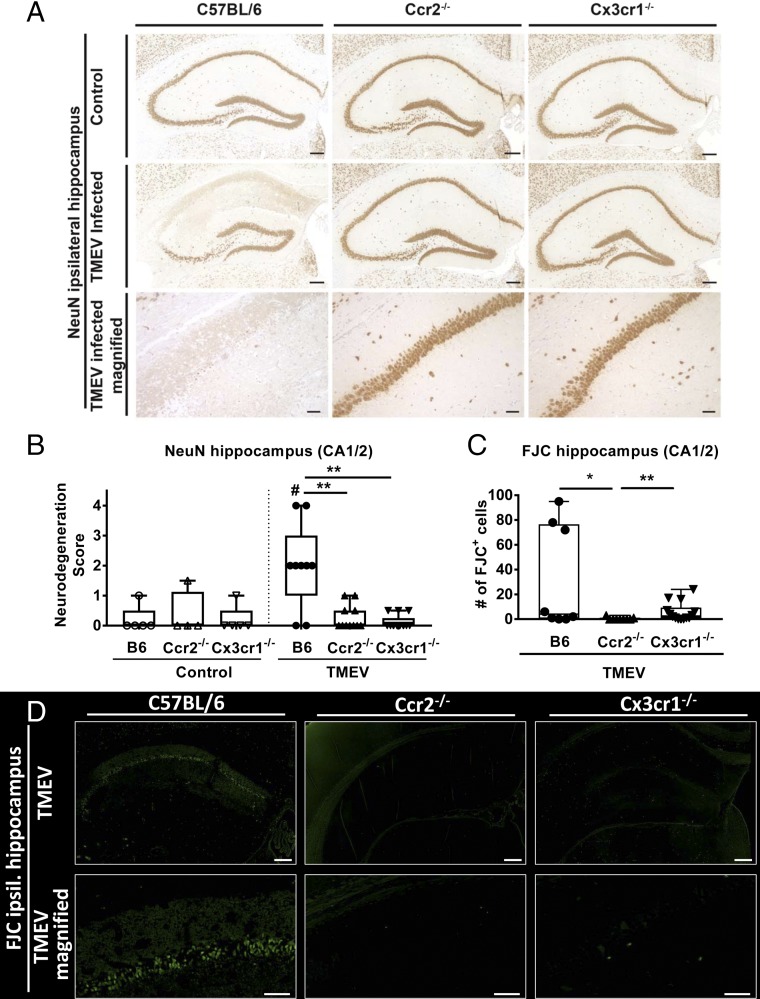
Fig. 5. Genetic deficiency of CCR2 and CX3CR1 leads to decreased neuronal death in the hippocampus after TMEV infection. Animals were treated as described in Fig. 1. Brains were removed on day 7 after perfusion, and histology was performed on sections of the dorsal hippocampus. Section levels (−2.06 ± 0.26 mm from bregma) were similar in all groups. (A) Representative photomicrographs illustrating NeuN+ neurons in mock-infected and TMEV-infected B6, Ccr2-KO, and Cx3cr1-KO mice. [Scale bars: 200 µm (overview, Top and Center Rows) or 50 µm (magnification, Bottom Row).] (B) Semi-quantitative data on NeuN+ neurons in the CA1/CA2 regions of the hippocampus. Data are shown as boxplots with whiskers indicating minimum and maximum values; the horizontal line in the boxes represents the median value. In addition, individual data are shown (n = 5–13). Analysis of data by two-way ANOVA indicated a significant effect of infection [F (1, 41) = 5.33; P = 0.0261], genotype [F (2, 41) = 6.348; P = 0.0040], and interaction [F (2, 41) = 7.35; P = 0.0019]. Significant differences from post hoc testing of mock-infected mice are indicated by the hash sign: #P < 0.05; significant differences between infected groups are indicated by asterisks: **P < 0.01. (C) The number of FJC+ neurons in infected mice (n = 6–14). No FJC staining was observed in controls. Analysis of data by one-way ANOVA indicated a significant difference between groups [F (2, 28) = 5.174; P = 0.0122]. Significant differences between infected groups are indicated by asterisks: *P < 0.05; **P < 0.01. (D) Representative photomicrographs illustrating FJC staining in infected mice. [Scale bars: 200 µm (Top Row) or 50 µm (Bottom Row).]
Fig. 5. Genetic deficiency of CCR2 and CX3CR1 leads to decreased neuronal death in the hippocampus after TMEV infection. Animals were treated as described in Fig. 1. Brains were removed on day 7 after perfusion, and histology was performed on sections of the dorsal hippocampus. Section levels (−2.06 ± 0.26 mm from bregma) were similar in all groups. (A) Representative photomicrographs illustrating NeuN+ neurons in mock-infected and TMEV-infected B6, Ccr2-KO, and Cx3cr1-KO mice. [Scale bars: 200 µm (overview, Top and Center Rows) or 50 µm (magnification, Bottom Row).] (B) Semi-quantitative data on NeuN+ neurons in the CA1/CA2 regions of the hippocampus. Data are shown as boxplots with whiskers indicating minimum and maximum values; the horizontal line in the boxes represents the median value. In addition, individual data are shown (n = 5–13). Analysis of data by two-way ANOVA indicated a significant effect of infection [F (1, 41) = 5.33; P = 0.0261], genotype [F (2, 41) = 6.348; P = 0.0040], and interaction [F (2, 41) = 7.35; P = 0.0019]. Significant differences from post hoc testing of mock-infected mice are indicated by the hash sign: #P < 0.05; significant differences between infected groups are indicated by asterisks: **P < 0.01. (C) The number of FJC+ neurons in infected mice (n = 6–14). No FJC staining was observed in controls. Analysis of data by one-way ANOVA indicated a significant difference between groups [F (2, 28) = 5.174; P = 0.0122]. Significant differences between infected groups are indicated by asterisks: *P < 0.05; **P < 0.01. (D) Representative photomicrographs illustrating FJC staining in infected mice. [Scale bars: 200 µm (Top Row) or 50 µm (Bottom Row).]CC BY-NC-ND · PubMed Central
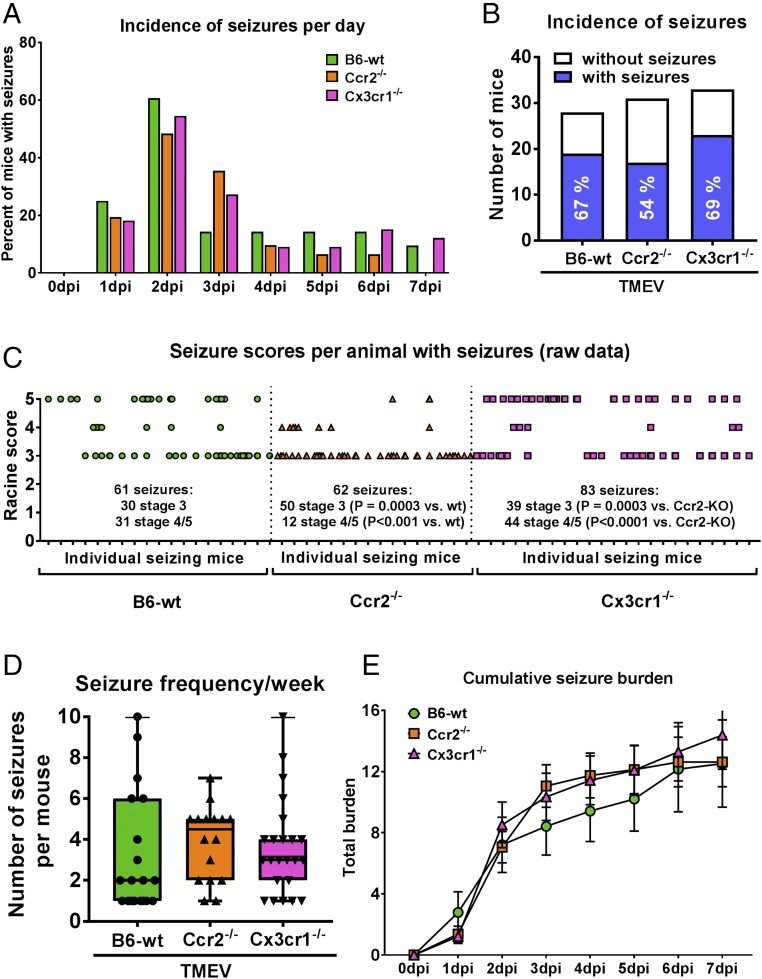
Fig. 6. Genetic deficiency of CCR2 and CX3CR1 does not decrease seizure incidence after TMEV infection. Mice were treated as described in Fig. 1, and the incidence, frequency, and severity of seizures were calculated over the 7-d monitoring period. Group sizes were 28 B6-WT, 31 Ccr2-KO, and 33 Cx3cr1-KO mice. (A) Temporal profile of seizure incidence following infection; analysis of data by Fisher’s exact test did not indicate significant intergroup differences. (B) Cumulative seizure incidence calculated from the data shown in A. Seizure incidence is indicated by the blue part of the columns; exact percentages are indicated within the columns. No seizures were observed in mock-infected controls (not shown; n = 28–33); analysis of data by Fisher’s exact test did not indicate significant intergroup differences. (C) Raw Racine scores for each seizure in each animal recorded over the 7 d following infection. Each tick mark on the x axis represents a mouse with observed seizure(s); each symbol represents a single seizure. Ccr2-KO mice exhibited significantly fewer generalized convulsive (stage 5) seizures than B6-WT (P < 0.05) or Cx3cr1-KO mice (P < 0.01; Fisher’s exact test). (D) The number of seizures counted in each mouse, i.e., seizure frequency recorded over the 7 dpi. Data are shown as boxplots with whiskers indicating minimum and maximum values; the horizontal lines in the boxes represent the median value. In addition, individual data are shown. Analysis of data by ANOVA did not indicate significant differences (P = 0.7178). (E) Cumulative seizure burden at each day postinfection in the three groups of mice. Cumulative seizure burden at each day postinfection for a mouse was calculated by summing all its seizure scores up to that day. No significant intergroup differences were observed.
Fig. 6. Genetic deficiency of CCR2 and CX3CR1 does not decrease seizure incidence after TMEV infection. Mice were treated as described in Fig. 1, and the incidence, frequency, and severity of seizures were calculated over the 7-d monitoring period. Group sizes were 28 B6-WT, 31 Ccr2-KO, and 33 Cx3cr1-KO mice. (A) Temporal profile of seizure incidence following infection; analysis of data by Fisher’s exact test did not indicate significant intergroup differences. (B) Cumulative seizure incidence calculated from the data shown in A. Seizure incidence is indicated by the blue part of the columns; exact percentages are indicated within the columns. No seizures were observed in mock-infected controls (not shown; n = 28–33); analysis of data by Fisher’s exact test did not indicate significant intergroup differences. (C) Raw Racine scores for each seizure in each animal recorded over the 7 d following infection. Each tick mark on the x axis represents a mouse with observed seizure(s); each symbol represents a single seizure. Ccr2-KO mice exhibited significantly fewer generalized convulsive (stage 5) seizures than B6-WT (P < 0.05) or Cx3cr1-KO mice (P < 0.01; Fisher’s exact test). (D) The number of seizures counted in each mouse, i.e., seizure frequency recorded over the 7 dpi. Data are shown as boxplots with whiskers indicating minimum and maximum values; the horizontal lines in the boxes represent the median value. In addition, individual data are shown. Analysis of data by ANOVA did not indicate significant differences (P = 0.7178). (E) Cumulative seizure burden at each day postinfection in the three groups of mice. Cumulative seizure burden at each day postinfection for a mouse was calculated by summing all its seizure scores up to that day. No significant intergroup differences were observed.CC BY-NC-ND · PubMed Central

Verification

Claims the paper makes

The claims and statistics of this paper haven’t been checked yet.

Run the check — free, no account needed. It reads the open-access text and checks the sources it cites.

A few free checks a day · papers already verified open instantly · results are public

Claims other papers make about this one

Each is checked against this paper’s own text: does it say what the citing paper says it does?

Self-check

Percentages, sums and reported differences re-computed from the paper’s own numbers.

The self-check needs the paper’s full text.

Citations

Cites

Show all 8 references

Research works printed but not linked: 53

  1. 10.1111/epi.13965 · DOI
  2. A Vezzani, B Lang, E Aronica, Immunity and inflammation in epilepsy. Cold Spring Harb Perspect Med 6, a022699 (2015). · DOI
  3. 10.1007/s00401-015-1481-5 · DOI
  4. 10.1038/nn.4475 · DOI · Paper page
  5. 10.1038/nature09615 · DOI · Paper page
  6. 10.1186/s12974-017-1015-2 · DOI
  7. 10.1016/j.jneuroim.2010.05.015 · DOI · Paper page
  8. 10.1038/jcbfm.2014.120 · DOI
  9. 10.1038/srep00545 · DOI
  10. 10.1128/JVI.02747-12 · DOI · Paper page
  11. 10.1016/j.nbd.2017.12.001 · DOI · Paper page
  12. 10.1089/vim.2006.0068 · DOI
  13. 10.1038/nn.3531 · DOI · Paper page
  14. 10.1038/ni.3423 · DOI · Paper page
  15. 10.1172/JCI29919 · DOI · Paper page
  16. 10.1182/blood-2008-07-170787 · DOI
  17. 10.1016/j.jneuroim.2017.02.012 · DOI
  18. 10.1016/j.immuni.2008.03.011 · DOI
  19. 10.1128/CMR.17.4.942-964.2004 · DOI · Paper page
  20. 10.1093/jnen/nlw008 · DOI
  21. 10.1038/nn2014 · DOI · Paper page
  22. 10.1002/glia.20124 · DOI
  23. 10.1016/j.brainres.2004.11.054 · DOI
  24. 10.1016/0013-4694(72)90177-0 · DOI
  25. 10.2353/ajpath.2009.081126 · DOI
  26. 10.1111/j.1528-1167.2009.02390.x · DOI
  27. 10.1038/srep28699 · DOI
  28. 10.1111/j.1365-2990.2012.01256.x · DOI
  29. 10.2217/fvl.11.107 · DOI
  30. 10.1016/S0306-4522(03)00027-7 · DOI
  31. 10.1097/NEN.0b013e3181ffc420 · DOI
  32. 10.1128/JVI.00458-11 · DOI
  33. 10.1111/epi.13577 · DOI
  34. 10.1002/glia.23007 · DOI
  35. 10.1016/j.nbd.2007.08.012 · DOI
  36. 10.1523/JNEUROSCI.6210-10.2011 · DOI
  37. 10.1093/jnen/nlx001 · DOI
  38. 10.1038/nrneurol.2010.178 · DOI · Paper page
  39. 10.1146/annurev-pharmtox-010814-124607 · DOI
  40. 10.1111/epi.13783 · DOI
  41. 10.1038/nrd.2015.14 · DOI
  42. 10.1111/epi.12354 · DOI · Paper page
  43. 10.3389/fncel.2014.00121 · DOI
  44. 10.1021/jm3012273 · DOI
  45. 10.1073/pnas.1316510111 · DOI
  46. 10.1073/pnas.94.22.12053 · DOI
  47. 10.1128/MCB.20.11.4106-4114.2000 · DOI · Paper page
  48. 10.1016/j.expneurol.2016.02.011 · DOI
  49. 10.1016/j.nbd.2016.12.020 · DOI
  50. G Paxinos, KBJ Franklin The Mouse Brain in Stereotaxic Coordinates (Academic, 4th Ed, New York, 2012).
  51. 10.1016/j.expneurol.2010.03.014 · DOI
  52. 10.1016/j.expneurol.2008.04.036 · DOI
  53. 10.1016/j.jviromet.2009.04.030 · DOI

Cited by

Sorted by citations

Metadata

Authors
Käufer, C., Chhatbar, C., Bröer, S., Waltl, I., Ghita, L., Gerhauser, I., Kalinke, U., & Löscher, W.
Affiliations
  • Department of Pharmacology, Toxicology, and Pharmacy, University of Veterinary Medicine Hannover, 30559 Hannover, Germany;
  • Institute for Experimental Infection Research, TWINCORE, Centre for Experimental and Clinical Infection Research, a joint venture between the Helmholtz Centre for Infection Research, 38124 Braunschweig, Germany, and the Hannover Medical School, 30625 Hannover, Germany;
  • Department of Pathology, University of Veterinary Medicine Hannover, 30559 Hannover, Germany;
Venue
Proceedings of the National Academy of Sciences
Published
2018-09-04
Volume
115
Issue
38
ISSN
  • 0027-8424
  • 1091-6490
Cited by
61
References
8
Language
en
Funders
  • Ministry of Science and Culture, Lower Saxony, Germany (N-RENNT)
  • Hemholtz Zukunftsthema Immunology & Inflammation (Immunology & Inflammation)

About these checks

Registry, retraction, Cites and statistics results are computed, not judged, with one exception: a printed reference that no index lists is read once by a model before it counts as a citation error. Claims are extracted by a model and kept only when their quote appears verbatim in the text; each cited source is then checked, with a model’s help, for whether it says what the claim relies on. Those verdicts can be wrong — read the claim’s quote and the cited source before relying on one.

Statistics and arithmetic are recomputed, not judged.

Confidence bands are shown only for fields calibrated on our annotated test set. None is calibrated yet, so no band is shown.

What counts as a claim ›How we measure confidence ›How we check this ›

Are you an author, or do you see a problem with this page? Request a review