

Robust single-cell Hi-C clustering by convolution- and random-walk-based imputation
Open accessThe DOI matches its Crossref record; 42 of the 42 references it cites were found in a registry or an index.
Abstract
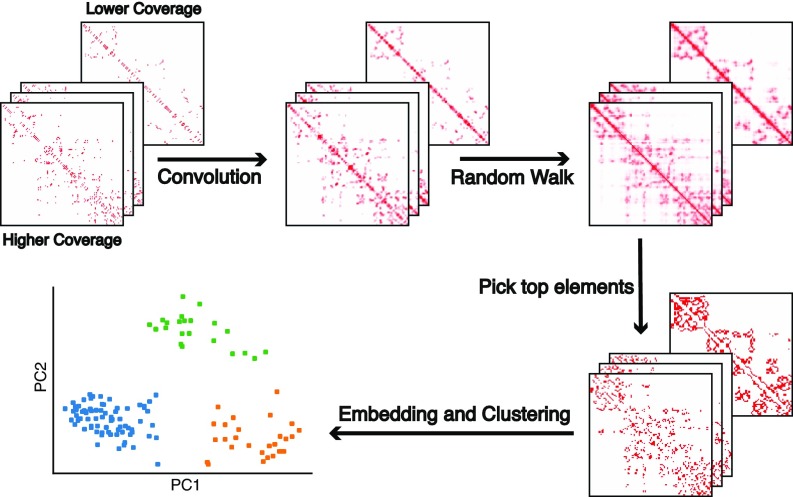
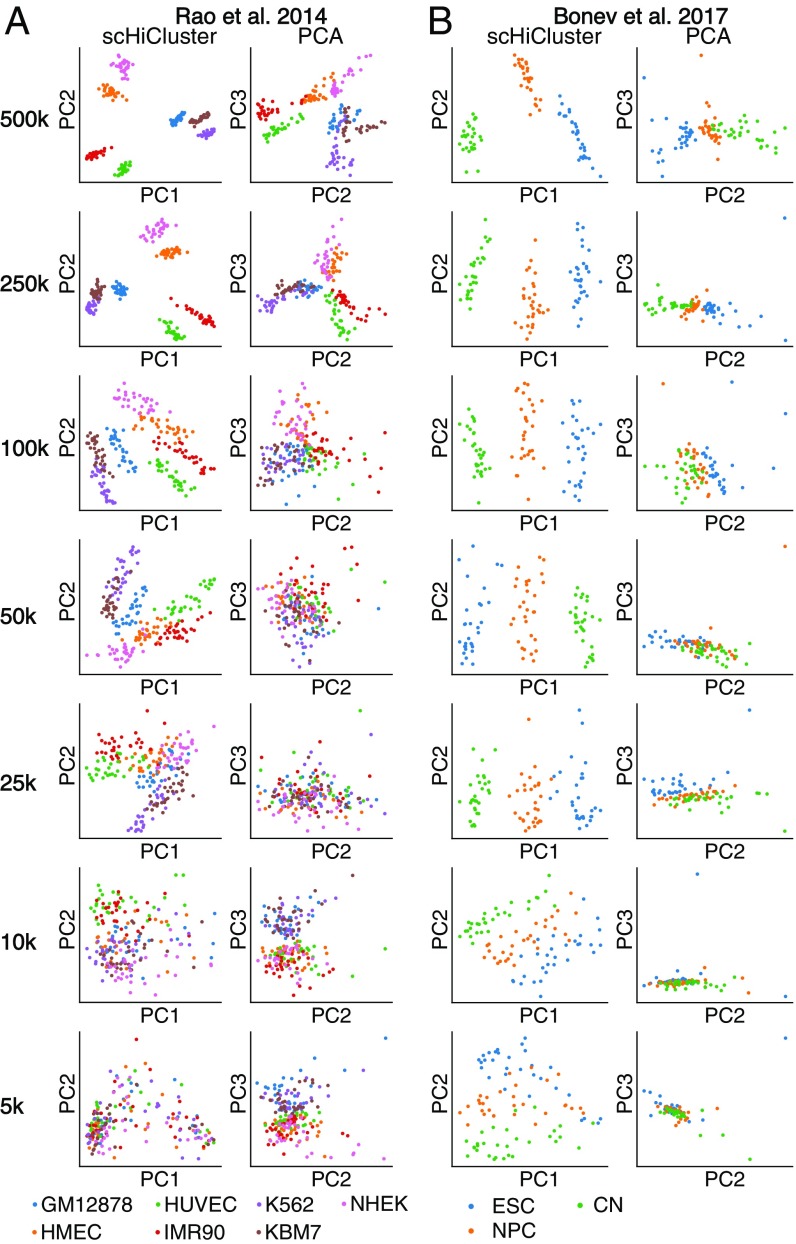
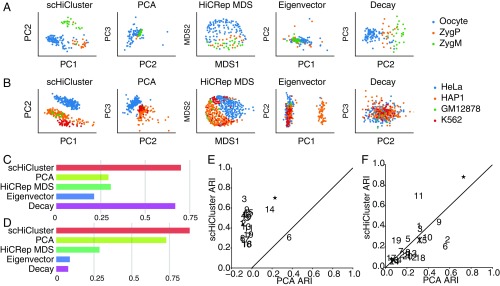
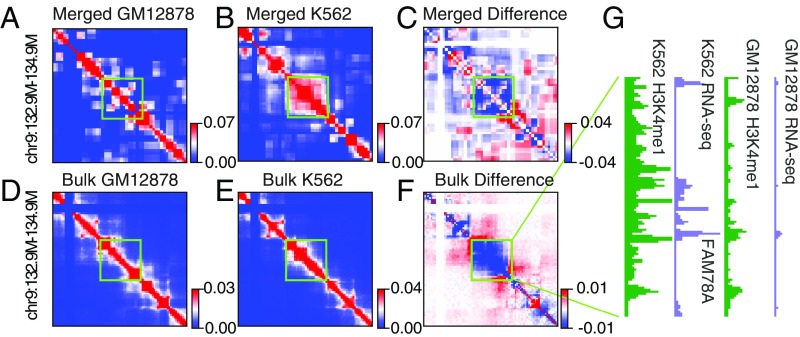
Three-dimensional genome structure plays a pivotal role in gene regulation and cellular function. Single-cell analysis of genome architecture has been achieved using imaging and chromatin conformation capture methods such as Hi-C. To study variation in chromosome structure between different cell types, computational approaches are needed that can utilize sparse and heterogeneous single-cell Hi-C data. However, few methods exist that are able to accurately and efficiently cluster such data into constituent cell types. Here, we describe scHiCluster, a single-cell clustering algorithm for Hi-C contact matrices that is based on imputations using linear convolution and random walk. Using both simulated and real single-cell Hi-C data as benchmarks, scHiCluster significantly improves clustering accuracy when applied to low coverage datasets compared with existing methods. After imputation by scHiCluster, topologically associating domain (TAD)-like structures (TLSs) can be identified within single cells, and their consensus boundaries were enriched at the TAD boundaries observed in bulk cell Hi-C samples. In summary, scHiCluster facilitates visualization and comparison of single-cell 3D genomes.
Overview
The claims and statistics of this paper haven’t been checked yet.
Free: it reads the open-access text and checks the first 5 claims that cite a source we can check. Create a free account to check every claim.
Integrity signals
Registry
Cites
Statistics
Figures

Verification
Claims the paper makes
The claims and statistics of this paper haven’t been checked yet.
Free: it reads the open-access text and checks the first 5 claims that cite a source we can check. Create a free account to check every claim.
Claims other papers make about this one
Each is checked against this paper’s own text: does it say what the citing paper says it does?
In the citing paper
“Cluster analysis of single cell Hi-C data can identify groups of cells with similar chromatin organization (Zhou et al., 2019), but on its own it does not reliably distinguish cortical neuron types (Lee et al., 2019; Li et al., 2019a).”
From Single-Cell Sequencing of Brain Cell Transcriptomes and Epigenomes (2021) · cites this paper as Zhou et al., 2019
Self-check
Percentages, sums and reported differences re-computed from the paper’s own numbers.
The self-check needs the paper’s full text.
Citations
Cites
A 3D Map of the Human Genome at Kilobase Resolution Reveals Principles of Chromatin Looping
Rao, S. S. P., Huntley, M. H., Durand, N. C., Stamenova, E. K., Bochkov, I. D., Robinson, J. T., Sanborn, A. L., Machol, I., Omer, A. D., Lander, E. S., et al. (2014) · Cell · doi:10.1016/j.cell.2014.11.021 · Cited by 9,212 · cited 3×
“Previous studies using bulk cell lines have reported the existence of several 3D structural features: megabase-level A/B compartments, submegabase-level TADs, and kilobase-level loops (29, 31, 39, 40).”
BackgroundMethodComprehensive Mapping of Long-Range Interactions Reveals Folding Principles of the Human Genome
Lieberman-Aiden, E., van Berkum, N. L., Williams, L., Imakaev, M., Ragoczy, T., Telling, A., Amit, I., Lajoie, B. R., Sabo, P. J., Dorschner, M. O., et al. (2009) · Science · doi:10.1126/science.1181369 · Cited by 8,898 · cited 2×
“Previous studies using bulk cell lines have reported the existence of several 3D structural features: megabase-level A/B compartments, submegabase-level TADs, and kilobase-level loops (29, 31, 39, 40).”
Highly parallel genome-wide expression profiling of individual cells using nanoliter droplets.
Macosko, E. Z., Basu, A., Satija, R., Nemesh, J., Shekhar, K., Goldman, M., Tirosh, I., Bialas, A. R., Kamitaki, N., Martersteck, E. M., et al. (2015) · Cell · doi:10.1016/j.cell.2015.05.002 · Cited by 7,110 · cited 1×
“Computational methods have been developed to identify different cell types in heterogeneous cell populations based on various molecular features such as transcriptome (12, 13), methylome (14), and open chromatin (15– 17).”
MethodTopological domains in mammalian genomes identified by analysis of chromatin interactions
Dixon, J. R., Selvaraj, S., Yue, F., Kim, A., Li, Y., Shen, Y., Hu, M., Liu, J. S., & Ren, B. (2012) · Nature · doi:10.1038/nature11082 · Cited by 6,829 · cited 1×
“Previous studies using bulk cell lines have reported the existence of several 3D structural features: megabase-level A/B compartments, submegabase-level TADs, and kilobase-level loops (29, 31, 39, 40).”
BackgroundSelf-citationSpatial partitioning of the regulatory landscape of the X-inactivation centre
Nora, E. P., Lajoie, B. R., Schulz, E. G., Giorgetti, L., Okamoto, I., Servant, N., Piolot, T., van Berkum, N. L., Meisig, J., Sedat, J., et al. (2012) · Nature · doi:10.1038/nature11049 · Cited by 2,895 · cited 1×
“Previous studies using bulk cell lines have reported the existence of several 3D structural features: megabase-level A/B compartments, submegabase-level TADs, and kilobase-level loops (29, 31, 39, 40).”
BackgroundSingle-cell chromatin accessibility reveals principles of regulatory variation
Buenrostro, J. D., Wu, B., Litzenburger, U. M., Ruff, D., Gonzales, M. L., Snyder, M. P., Chang, H. Y., & Greenleaf, W. J. (2015) · Nature · doi:10.1038/nature14590 · Cited by 2,308 · cited 1×
“I recent years, there has been a rapid increase in the development of single-cell transcriptomic and epigenomic assays (1), including single-cell/nucleus RNA sequencing (RNA-seq) (2), assay for transposase-accessible chromatin using sequencing (ATACseq) (3, 4), bisulfite sequencing (5), and Hi-C (6–11).”
BackgroundData-Driven Phenotypic Dissection of AML Reveals Progenitor-like Cells that Correlate with Prognosis
Levine, J. H., Simonds, E. F., Bendall, S. C., Davis, K. L., Amir, E.-A. D., Tadmor, M. D., Litvin, O., Fienberg, H. G., Jager, A., Zunder, E. R., et al. (2015) · Cell · doi:10.1016/j.cell.2015.05.047 · Cited by 2,303
chromVAR: inferring transcription-factor-associated accessibility from single-cell epigenomic data
Schep, A. N., Wu, B., Buenrostro, J. D., & Greenleaf, W. J. (2017) · Nature Methods · doi:10.1038/nmeth.4401 · Cited by 1,680
Chromatin architecture reorganization during stem cell differentiation
Dixon, J. R., Jung, I., Selvaraj, S., Shen, Y., Antosiewicz-Bourget, J. E., Lee, A. Y., Ye, Z., Kim, A., Rajagopal, N., Xie, W., et al. (2015) · Nature · doi:10.1038/nature14222 · Cited by 1,646 · cited 1×
“Besides the methods used in published works, we included the eigenvector method since the chromosome compartments are considered to be cell type specific based on the bulk Hi-C experiments, and the first eigenvector of contact matrix is widely used to represent these compartment features (29, 31, 32).”
MethodSelf-citationFull-length mRNA-Seq from single-cell levels of RNA and individual circulating tumor cells
Ramsköld, D., Luo, S., Wang, Y.-C., Li, R., Deng, Q., Faridani, O. R., Daniels, G. A., Khrebtukova, I., Loring, J. F., Laurent, L. C., et al. (2012) · Nature Biotechnology · doi:10.1038/nbt.2282 · Cited by 1,609 · cited 1×
“I recent years, there has been a rapid increase in the development of single-cell transcriptomic and epigenomic assays (1), including single-cell/nucleus RNA sequencing (RNA-seq) (2), assay for transposase-accessible chromatin using sequencing (ATACseq) (3, 4), bisulfite sequencing (5), and Hi-C (6–11).”
Background
Cited by
Items 101–183 of 183
Chen, M., Du, L., Zhao, S., Ye, B., Delafrouz, P., Farooq, H., Chattopadhyay, D., Marai, G. E., Shao, Z., Liang, J., et al. (2025) · Nucleic Acids Research · doi:10.1093/nar/gkaf1233 · Cited by 5
“The limited number of contacts detected per cell prevents reliable reconstruction of genome-wide 3D structures, particularly at the resolution of TADs and loops [ 35 –38 ].”
Joint Tensor Modeling of Single Cell 3D Genome and Epigenetic Data with Muscle
Park, K., & Keleş, S. (2024) · Journal of the American Statistical Association · doi:10.1080/01621459.2024.2358557 · Cited by 7
“Computational approaches for specific scHi-C data inference tasks are appearing rapidly (e.g., scHiCluster (Zhou et al. 2019), scHiC Topics (Kim et al. 2020), Higashi (Zhang, Zhou, and Ma 2022a), BandNorm and scVI-3D (Zheng, Shen, and Kele¸s 2022), and Fast-Higashi (Zhang, Zhou, and Ma 2022b),…”
Deep neural network models for cell type prediction based on single-cell Hi-C data
Zhou, B., Liu, Q., Wang, M., & Wu, H. (2024) · BMC Genomics · doi:10.1186/s12864-024-10764-7 · Cited by 4
“ARI is an effective evaluation index in clustering algorithm, which does not consider the specific implementation and complexity of the clustering algorithm, but only considers the results as a black box [12].”
BackgroundMethodResultInfluentialUnveiling Multi‐Scale Architectural Features in Single‐Cell Hi‐C Data Using scCAFE
Wang, F., Lin, J., Alinejad‐Rokny, H., Ma, W., Meng, L., Huang, L., Yu, J., Chen, N., Wang, Y., Yao, Z., et al. (2025) · Advanced Science · doi:10.1002/advs.202416432 · Cited by 4
A mini-review of single-cell Hi-C embedding methods
Ma, R., Huang, J., Jiang, T., & Ma, W. (2024) · Computational and Structural Biotechnology Journal · doi:10.1016/j.csbj.2024.11.002 · Cited by 8
Kim, H.-J., Yardımcı, G. G., Bonora, G., Ramani, V., Liu, J., Qiu, R., Lee, C., Hesson, J., Ware, C. B., Shendure, J., et al. (2019) · bioRxiv (Cold Spring Harbor Laboratory) · doi:10.1101/534800 · Cited by 4
“Furthermore, although HiCRep/MDS can very accurately recover cell cycle information from several Hi-C data sets, the method frequently fails to capture chromatin structural differences between cell types [6].”
BackgroundMethodDroplet Hi-C for Fast and Scalable Profiling of Chromatin Architecture in Single CellsPreprint
Chang, L., Xie, Y., Taylor, B., Wang, Z., Sun, J., Tan, T. M., Bejar, R. L., Chen, C. C., Furnari, F. B., Hu, M., et al. (2024) · bioRxiv (Cold Spring Harbor Laboratory) · doi:10.1101/2024.04.18.590148 · Cited by 4
“3.4) to perform contact matrix imputation for individual cell at three different resolutions: 100 kb (for cells embedding and visualization), 25 kb (for domain boundaries calling) and 10 kb (for cells embedding and loops calling) 78 .”
MethodInfluentialSingle-cell multiomics and chromatin structure reveal gene-regulatory dynamics in heart failure
Xie, Y., Tucciarone, L., Farah, E. N., Chang, L., Yang, Q., Shankar, T. S., Elison, W. S., Tran, S., Djulamsah, J., Lie, A., et al. (2026) · Science · doi:10.1126/science.ady6893 · Cited by 14
Fan, S., Dang, D., Gao, L., & Zhang, S. (2024) · Advanced Science · doi:10.1002/advs.202406364 · Cited by 5
Schiccompare: An R Package for Differential Analysis of Single-Cell Hi-C Data
Nguyen, M., Wall, B. P. G., Harrell, J. C., & Dozmorov, M. G. (2024) · Journal of Molecular Biology · doi:10.1016/j.jmb.2025.169155 · Cited by 3
Hong, F., Han, K., Hao, Y., Su, W., Xie, X., Li, X., Chen, Q., Wei, Y., Luo, X., Xie, S., et al. (2025) · Briefings in Bioinformatics · doi:10.1093/bib/bbaf520 · Cited by 5
“[66] pioneered the scHi-Cluster algorithm, which applies convolutional smoothing and RWR strategies to denoise sparse contact matrices, followed by PCA and k-means clustering.”
Deciphering single-cell 3D chromatin structure using scCTG
Jiang, R., Xue, Y., Huang, Y., & Gao, Y. Q. (2024) · The Journal of Chemical Physics · doi:10.1063/5.0241334 · Cited by 3
ScHiCAtt: Enhancing single-cell Hi-C data resolution using attention-based models
Menon, R., Chowdhury, H. M. A. M., & Oluwadare, O. (2025) · Computational and Structural Biotechnology Journal · doi:10.1016/j.csbj.2025.02.031 · Cited by 5
MLG: multilayer graph clustering for multi-condition scRNA-seq data
Lu, S., Conn, D. J., Chen, S., Johnson, K. D., Bresnick, E. H., & Keleş, S. (2021) · Nucleic Acids Research · doi:10.1093/nar/gkab823 · Cited by 3
“We expect MLG clustering to be generally applicable for SNARE-seq, Share-seq [45] and other single cell data modalities such as scHi-C [46], joint profiling of transcriptome and DNA methylation [47].”
MethodLearning induces persistent chromatin loops underlying robust gene expression during memory recallPreprint
Xu, P., Chandradoss, K. R., Lukasak, B. J., Paranjapye, A., Waldman, A. J., Pham, K., Ryu, H.-S., Liu, C., Titus, K. R., Sureka, R., et al. (2025) · bioRxiv (Cold Spring Harbor Laboratory) · doi:10.1101/2025.09.30.678146 · Cited by 3
“Perturbing loops by selectively eliminating either CTCF or cohesin subunits impairs memory encoding in multiple behavior models ( 11, 14, 16-18 ), disrupts long-term potentiation ( 17, 18 ), and alters dendritic morphology ( 13, 19, 20 ).”
Liu, W., Zhong, W., Giusti‐Rodríguez, P., Jiang, Z., Wang, G. W., Sun, H., Hu, M., & Li, Y. (2024) · Briefings in Bioinformatics · doi:10.1093/bib/bbae426 · Cited by 5
“These results indicated that PNOC is the putative target gene for SCZ-associated SNP rs2565064 in neurons and ZNF395 is the putative target gene for both SCZ-and AD-associated SNPs in this 27.4Mb–27.5Mb region on chromosome 8.”
BackgroundMethodRegulatory roles of three-dimensional structures of chromatin domains
Li, K. Y., Cao, Q., Chow, S. H.-C., Nicoletti, C., Puri, P., Wang, H., Leung, D., & Yip, K. Y.-L. (2025) · Genome biology · doi:10.1186/s13059-025-03659-7 · Cited by 3
DeepExDC interprets genomic compartmentalization changes in single-cell Hi-C data
Lv, H., Cao, P., Long, W., Yin, X., Xu, S., & Fu, L. (2025) · Briefings in Bioinformatics · doi:10.1093/bib/bbaf301 · Cited by 2
Lyu, H., Li, Y., Chen, X., Liu, Y.-A., Liu, E., & Cheng, X. (2025) · Frontiers in Genetics · doi:10.3389/fgene.2025.1602234 · Cited by 2
“Meanwhile, the latter treats the contact matrix as the adjacency matrix of a graph, including scHiCluster (Zhou et al., 2019), SnapHiC2 (Li et al., 2022), Higashi (Zhang et al., 2022), TADGATE (Dang et al., 2024), and HiC-SGL (Zheng et al., 2024).”
Ma, W., Wang, F., Fan, Y., Hao, G., Su, Y., Wong, K., & Li, X. (2025) · Nucleic Acids Research · doi:10.1093/nar/gkaf640 · Cited by 3
“For a comprehensive evaluation, we compared DeepNanoHi-C to four state-of-the-art baseline methods, chosen based on their relevance to single-cell Hi-C data and their previous success in clustering tasks: Higashi [ 20 ], HiC-SGL [ 22 ], scHiCluster [ 19 ], and scHiCStackL [ 45 ].”
InfluentialBioinformatic Analysis of Single-Cell Hi-C Data from Early Mouse Embryo
Collombet, S., Perez-Rico, Y. A., Ancelin, K., Servant, N., & Heard, É. (2020) · Methods in molecular biology · doi:10.1007/978-1-0716-0958-3_20 · Cited by 2
Johnson, B. K., Fortin, J., Hansen, K. D., Shen, H., & Triche, T. J. (2021) · bioRxiv (Cold Spring Harbor Laboratory) · doi:10.1101/2021.05.17.444465 · Cited by 2
“A complementary approach is to impute missing data, and indeed, several computational approaches have been developed to denoise chromatin contact information 49–55 .”
BackgroundChen, S., Wang, J., Gao, X., & Li, Y. (2022) · bioRxiv (Cold Spring Harbor Laboratory) · doi:10.1101/2022.01.30.478367 · Cited by 3
Lee, L., Yu, M., Li, X., Zhu, C., Zhang, Y.-X., Yu, H.-Y., Chen, Z.-Y., Mishra, S., Ren, B., Li, Y., et al. (2022) · bioRxiv · doi:10.1101/2022.08.05.502991 · Cited by 9
“Most recent efforts have targeted the characterization of 3D genomic features at single cell resolution, such as A/B compartments and topologically associating domain (TAD)-like structures 14-17 (more details can be found in the recent review papers 18-20 ).”
BackgroundMethodJOnTADS: a unified caller for TADs and stripes in Hi-C dataPreprint
Zeng, Q., Xiang, G., Zhang, Y., Hardison, R. C., & Li, Q. (2024) · bioRxiv (Cold Spring Harbor Laboratory) · doi:10.1101/2024.11.06.622323 · Cited by 2
Single-cell mapping of cell-type specific chromatin architecture in the central nervous system
Zhang, L., & Bartošovič, M. (2024) · Current Opinion in Structural Biology · doi:10.1016/j.sbi.2024.102824 · Cited by 1
Application of Dimension Reduction Methods to High-Dimensional Single-Cell 3D Genomic Contact Data
Wang, Z., Zhang, P., Sun, W., & Li, D. (2024) · IECE transactions on internet of things. · doi:10.62762/tiot.2024.186430 · Cited by 1
“Zhou use scHiCluster on different types of cells and find out domain-like structures (TLSs) in single-cell data [8].”
BackgroundKang, B., Lee, H., & Roh, T. (2025) · Genomics & Informatics · doi:10.1186/s44342-025-00037-4 · Cited by 2
“In clustering, scHiCluster [47] groups cells based on chromatin interaction profiles, while scDEC-Hi-C [45] applies deep learning to uncover latent structures in the data.”
Xie, Q. S., Meng, W., & Lin, S. (2025) · BMC Bioinformatics · doi:10.1186/s12859-025-06147-8 · Cited by 1
“, 2018), construct 3D structures (Zhu and Wang, 2019), or cluster single cells (Zhou et al., 2019), imputing values for observed zeros has been treated as an intermediate data enhancing step.”
InfluentialCan random walking on a Hi-C contact matrix lead to data quality improvement? An assessment
Liu, Y., & Lin, S. (2025) · PLoS ONE · doi:10.1371/journal.pone.0327100 · Cited by 1
“SnapHiC uses restart probability of 0.05 without justification [20], while scHiCluster claims in the appendix that this method is robust to the choice of restart probability, where the values of 0, 0.1, 0.2, …, 0.9 were tested [12].”
InfluentialSingle-cell multiomics connects 3D genome and transcriptome alterations in Alzheimer’s disease
Zhang, Y., Lu, X., Kunisky, A. K., Alam, S., Tang, J., Zhang, R., Wang, S., Zhang, H. H., Baroudi, J. K., Ichcho, W., et al. (2026) · Science · doi:10.1126/science.adz1652 · Cited by 3
A 3D genome atlas of human tonsil and the role of loop extrusion in B cell somatic hypermutation
Cheng, Y., Wang, J., Zhang, Y., Yadavalli, A. D., Liu, M., Jin, S., Buddle, G., Haberman, A. M., Schatz, D. G., & Wang, S. (2026) · Science · doi:10.1126/science.adw4243 · Cited by 3
[Advances in methods and applications of single-cell Hi-C data analysis].
Gong, H., Ma, F., & Zhang, X. (2023) · PubMed Central · doi:10.7507/1001-5515.202303046 · Cited by 1
SnapFISH-IMPUTE: an imputation method for multiplexed DNA FISH data
Yu, H., Wu, D., Mishra, S. V., Shen, G., Sun, H., Hu, M., & Li, Y. (2024) · Communications Biology · doi:10.1038/s42003-024-06428-7 · Cited by 3
Circuit Topology Analysis of Single-Cell HiC Data
Scalvini, B., & Mashaghi, A. (2024) · Methods in molecular biology · doi:10.1007/978-1-0716-3930-6_2 · Cited by 5
Harmonizing single-cell 3D genome data with STARK and scNucleome
Jiang, W.-J., Cai, K., Yuanchen, S., Liu, A., Zhu, H. P., Gao, R., Zhong, C., Wei, N., Lai, F., Fei, T., et al. (2026) · Genome biology · doi:10.1186/s13059-026-03938-x · Cited by 1
“By processing data from ~ 2 million single cells across 15 sc3DG-seq techniques, STARK helps researchers choose the most appropriate technology for their needs.”
Dang, D., Zhang, S., Duan, R., & Zhang, S. (2022) · bioRxiv (Cold Spring Harbor Laboratory) · doi:10.1101/2022.08.08.503155 · Cited by 1
Examining dynamics of three-dimensional genome organization with multi-task matrix factorizationPreprint
Lee, D.-I., & Roy, S. (2023) · bioRxiv (Cold Spring Harbor Laboratory) · doi:10.1101/2023.08.25.554883 · Cited by 1
Examining the dynamics of three-dimensional genome organization with multitask matrix factorization
Lee, D.-I., & Roy, S. (2025) · Genome Research · doi:10.1101/gr.279930.124 · Cited by 2
“…input Hi-C data is not available (e.g., integrating Hi-C data sets from multiple studies or pseudobulk single-cell Hi-C data from cell clusters) (Zhou et al. 2019; Zhang et al. 2022) TGIF can infer a tree structure based on the pairwise similarity of the input Hi-C matrices measured by…”
Cell-Type-Specific Transposable Element Demethylation and TAD Remodeling in the Aging Mouse BrainPreprint
Zeng, Q., Tian, W., Klein, A., Bartlett, A., Liu, H., Nery, J. R., Castanon, R., Osteen, J. K., Johnson, N. D., Wang, W., et al. (2025) · bioRxiv (Cold Spring Harbor Laboratory) · doi:10.1101/2025.04.21.648266 · Cited by 1
Circuit-aligned specialization of human basal ganglia astrocytes
Fu, Y., Kempynck, N., Ding, W., Turner, M. A., Garcia, A. D., Schmitz, M. T., Close, J., Kapen, I., Hewitt, M., Seeman, S. C., et al. (2026) · Cell · doi:10.64898/2025.12.19.695583 · Cited by 9
“60 For 3D genome analyses, single-cell Hi-C contact matrices generated by snm3C-seq were aggregated into cell type-resolved pseudobulk contact maps using scHiCluster 61 (https://github.com/zhoujt1994/scHiCluster), based on the methylation-derived cell-type labels.”
Multimodal single-cell epigenomic and 3D genome atlas of the human basal ganglia
Ding, W., Klein, A., Báez-Becerra, C. T., Rink, J. A., Bartlett, A., Wang, R., Zeng, Q., Castanon, R., Nery, J. R., Osgood, E., et al. (2026) · Cell · doi:10.64898/2026.02.12.705594 · Cited by 13
Ensemble Feature Selection for Single Cell Chromatin Conformation Analysis
Rouhi, A., Nanni, L., Canakoglu, A., Pinoli, P., & Ceri, S. (2021) · International Conference on Bioinformatics and Biomedical Technology (ICBBT) · doi:10.1145/3473258.3473290
“Recently, computational methods for determining single-cell Hi-c data have been proposed [30, 67].”
BackgroundMethodInfluentialessHi-C: essential component analysis of Hi-C matrices
Franzini, S., Stefano, M. D., & Micheletti, C. (2021) · Bioinformatics · doi:10.1093/bioinformatics/btab062
“Owing to the importance of comparative analysis, it is increasingly crucial to crossvalidate data gathered with different protocols, resolution, and sequencing depth [20, 21, 22, 23, 24], thus identifying the common and statistically-significant features [25] in Hi-C matrices.”
BackgroundMiyashiro, K., & Eberwine, J. H. (2021) · Elsevier eBooks · doi:10.1016/b978-0-12-823577-5.00034-9
Kong, L. (2021) · DR-NTU (Nanyang Technological University) · doi:10.32657/10356/155629
Zhang, Z., Li, A., Zeng, G., Wang, H., & Li, X. (2022) · Research Square · doi:10.21203/rs.3.rs-1863314/v1
SnapFISH-IMPUTE: an imputation method for multiplexed DNA FISH dataPreprint
Yu, H., Wu, D., Shen, G., Hu, M., & Li, Y. (2024) · bioRxiv (Cold Spring Harbor Laboratory) · doi:10.1101/2024.01.12.575427
“In contrast to the lack of imputation methods developed specifically for multiplexed DNA FISH data, computational methods tailored for imputing single-cell Hi-C (scHi-C) data, such as scHiCluster 17 and Higashi 18 , have been proposed recently.”
Bulathsinghalage, C., & Liu, L. (2023) · IEEE International Conference on Bioinformatics and Biomedicine (BIBM) · doi:10.1109/bibm58861.2023.10385614
“From these matrices, we selected the top k (e.g k=4 , which is also used in [1]) neighbors based on the Pearson correlation coefficient.”
BackgroundMethodLi, X., Zeng, G., Li, A., & Zhang, Z. (2021) · Figshare · doi:10.6084/m9.figshare.15058204
Li, X., Zeng, G., Li, A., & Zhang, Z. (2021) · Figshare · doi:10.6084/m9.figshare.15058207
Li, X., Zeng, G., Li, A., & Zhang, Z. (2021) · Figshare · doi:10.6084/m9.figshare.15058201
Li, X., Zeng, G., Li, A., & Zhang, Z. (2021) · Figshare · doi:10.6084/m9.figshare.15058213
Gunsalus, L. M., Keiser, M. J., & Pollard, K. S. (2025) · PLoS Computational Biology · doi:10.1371/journal.pcbi.1012841 · Cited by 1
“…on four key challenges: imputing and denoising sparse single-cell data [12–15]; clustering cells through topic modeling [16], random-walk methods [17], and recent deep learning approaches [12,18]; annotating chromatin structures in single cells, including A/B compartments [12,13],…”
Banecki, K. H., Chai, H., Ruan, Y., & Plewczyński, D. (2025) · bioRxiv (Cold Spring Harbor Laboratory) · doi:10.1101/2025.05.16.654550 · Cited by 1
Liu, Y., Jin, V. X., & Lin, S. (2025) · bioRxiv (Cold Spring Harbor Laboratory) · doi:10.1101/2025.07.23.666407
“Additional efforts include scHiCluster [13], which integrates random walk with restart and linear convolution, and Higashi [19], which uses a hypergraph-based neural embedding.”
Hi-Cformer enables multiscale chromatin contact map modeling for single-cell Hi-C data analysis
Wu, X., Wang, Z., Jiang, R., & Chen, X. (2026) · Science Advances · doi:10.1126/sciadv.aeg0134
“Non–deep learning methods typically adopt graph-based or statistical models as analytical frameworks ( 23 – 26 ).”
InfluentialLeveraging Nearest Neighbors for Faithful scHi-C Data Imputation
Zhao, B., & Liu, L. (2025) · Communications in computer and information science · doi:10.1007/978-3-031-94950-0_24
reDA: differential abundance testing on scATAC-seq data using random walk with restart
Chen, Z., Hua, J., Ba, L., He, T., Yang, B., Qi, J., & Jin, S. (2025) · Bioinformatics · doi:10.1093/bioinformatics/btaf459
“…which can better capture the local and global information of the shared nearest neighbor (SNN) graph, mitigate the effects of information loss and information redundancy (Cowen et al. 2017, Zhou et al. 2019), and thus reliably identify condition-specific cell states based on association tests.”
Brain Region-Specific Epigenomic Reorganization and Altered Cell States in Alzheimer’s DiseasePreprint
Wang, W., Berube, P., Yang, B., Castanon, R., Bartlett, A., Komandur, K., Nery, J. R., Barragan, C., Kenworthy, M., Valadon, C., et al. (2025) · bioRxiv (Cold Spring Harbor Laboratory) · doi:10.1101/2025.09.29.678849 · Cited by 1
Waldman, A. J., Pham, K., Titus, K. R., Nikish, A., Liu, C., Ryu, H.-S., Muppidi, S. S., Chandradoss, K. R., Xu, P., Patel, R., et al. (2025) · bioRxiv (Cold Spring Harbor Laboratory) · doi:10.1101/2025.09.30.679661
STRIDE: A Sequencing Depth Robust Metric for Sparse Chromosome Conformation Capture Data Comparison
Xu, B., Gao, X., Tao, W., Zhang, Z., & Li, F. (2026) · Advanced Science · doi:10.1101/2025.10.08.681271
SHICEDO: single-cell Hi-C data enhancement with reduced over-smoothing
Huang, J., Ma, R., Strobel, M. J., Hu, Y., Ye, T., Jiang, T., & Ma, W. (2025) · Bioinformatics · doi:10.1093/bioinformatics/btaf575 · Cited by 1
Li, X., Zeng, G., Li, A., & Zhang, Z. (2021) · Figshare · doi:10.6084/m9.figshare.15058216
Additional file 2 of Normalization and de-noising of single-cell Hi-C data with BandNorm and scVI-3D
Zheng, Y., Shen, S., & Keleş, S. (2022) · Figshare · doi:10.6084/m9.figshare.21351410
Li, X., Zeng, G., Li, A., & Zhang, Z. (2021) · Figshare · doi:10.6084/m9.figshare.15058195
Li, X., Zeng, G., Li, A., & Zhang, Z. (2021) · Figshare · doi:10.6084/m9.figshare.15058192
Additional file 1 of Normalization and de-noising of single-cell Hi-C data with BandNorm and scVI-3D
Zheng, Y., Shen, S., & Keleş, S. (2022) · Figshare · doi:10.6084/m9.figshare.21351407
Li, X., Zeng, G., Li, A., & Zhang, Z. (2021) · Figshare · doi:10.6084/m9.figshare.15058210
Benchmarking Analysis of scHi-C Data Imputation Methods
Du, X., Ji, X., Tang, L., & Li, M. (2026) · Big Data Mining and Analytics · doi:10.26599/bdma.2025.9020043
Peng, Y., Deng, Y., Liu, M., Liu, Z., Li, Y.-H., Zhao, X.-Y., Xing, D., Jia, J., & Ge, H. (2026) · Briefings in Bioinformatics · doi:10.1093/bib/bbag096 · Cited by 1
Physics-Based Modeling of Sparse Single-Cell Hi-C Uncovers Structural and Epigenetic Variability
Vercellone, F., Kundu, S., Esposito, A., Chiariello, A. M., Conte, M., Abraham, A., Fontana, A., Pierno, F. D., Guha, S., Carluccio, C. D., et al. (2026) · International Journal of Molecular Sciences · doi:10.3390/ijms27114803
“Graph-based methods, such as scHiCluster [34], use convolutional smoothing and random walk with restart algorithms to impute missing contacts in the sparse single-cell matrices.”
Three-dimensional genome architecture: from contacts to mechanisms
Hoboth, P., & Sztacho, M. (2026) · Advances in Biological Regulation · doi:10.1016/j.jbior.2026.101171
Origins and consequences of oncogenic 3D chromatin remodelling
Franceschini, G. M., Georgakopoulou, K., Ciriello, G., & Oricchio, E. (2026) · Nature reviews. Cancer · doi:10.1038/s41568-026-00969-1
“At the single-cell level, methods like scHiCluster 196 and single-nucleus analysis pipeline for Hi-C (SnapHiC) 197 first unlocked the possibility of imputing contacts, making this very sparse data type amenable to loop, TAD and compartment calling.”
Lin, X., Sun, Y., Wang, X., Zhang, P., Zhang, Y., Li, Y., Wang, Y., Hu, P., Zhang, Y., Chen, H., et al. (2026) · Information Fusion · doi:10.1016/j.inffus.2026.104738
Spatial chromatin architecture and accessibility co-profiling of mammalian tissues
Wang, P., Wang, J., Wang, Q., Youngblood, M. W., Yang, C., Tao, B., Wong, J. H.-Y., Luan, Y., Yu, S., Swaroop, A., et al. (2026) · Nature Methods · doi:10.1038/s41592-026-03217-4 · Cited by 1
“ScHiCluster 94 (v.1.3.5) (https://github.com/zhoujt1994/scHiCluster) was used to perform contact matrix imputation for individual spatial pixels at three different resolutions (100 kb (for compartment analysis), 25 kb (for visualization) and 10 kb).”
Influential3D epigenome of glial cell types in developing human cortex
Jones, I. R., Wang, L., Kosicki, M., Battle, S. L., Narayan, V. J., Bi, Q., Gemenes, K., Liu, Y., Zhou, L., Song, M., et al. (2026) · Nature · doi:10.1038/s41586-026-10987-6 · Cited by 1
“In conclusion, by conducting bulk assays of cell types isolated by FACS, we obtained high-quality data with improved resolution compared with previous results 11,12 .”
Chen, Z., Li, X., Dai, Y., Shao, K., Sun, H., Wu, N., Yan, J., Zhang, Y., & Yu, M. (2026) · Science Advances · doi:10.1126/sciadv.aee2863
Zhu, J., Zhang, H., Du, Y., Zhang, X., Zhou, Y., & Tian, D. (2026) · bioRxiv (Cold Spring Harbor Laboratory) · doi:10.64898/2026.09.15.751728
“DiffDomain-Spectrum was compared with the boundary-focused single-cell method scHiCluster using HiRES data from six developing mouse embryo cell types [20, 25].”
InfluentialRegulatory-scale stripe analysis from single-cell Hi-C with scStripePreprint
Li, L., Liu, Y., Zhang, H., Gao, W., Lin, Z., Liu, D., Pan, G., Yao, C., & Tian, D. (2026) · bioRxiv (Cold Spring Harbor Laboratory) · doi:10.64898/2026.09.16.751930
“At the per-cell level, scHi-C enhancement methods improve the recovery of chromatin-contact patterns from sparse maps and provide a basis for downstream stripe analysis [35–38].”
Spatially resolved chromatin architectures in mammalian brain tissues
陈振平, Z. C., Guo, M., Zhang, L., Yu, H., Wang, X., Yu, X., Chen, M., Lv, J., Chen, Z., Peng, C., et al. (2026) · Nature Methods · doi:10.1038/s41592-026-03218-3 · Cited by 1
“To compare the 3D chromatin TAD structure, we performed imputation analysis at 25 kb for each spot contact generated from HiCExplorer by scHiCluster 64 (https://github.com/zhoujt1994/scHiCluster) for adult mouse brain slices.”
Epigenomic heterogeneity and spatial organization during human reprogrammingPreprint
Li, T. W., Langerman, J., Liu, C., Sun, Y., Baig, M. S., Kim, G., Fu, J., Ghoor, R. I., Zhang, Y., Behren, Z. V., et al. (2026) · bioRxiv (Cold Spring Harbor Laboratory) · doi:10.64898/2026.10.15.757424
Mechano-epigenetic enhancement of CRISPR activation of target genes for cell reprogramming
Song, Y., Wu, Y., Soto, J., Lin, X., Elhajjaoui, N., Abuhanna, K. D., Zhang, Y., Haideri, T., Hu, E., Shin, D. H., et al. (2026) · Matter · doi:10.1016/j.matt.2026.103064
Metadata
- Authors
- Zhou, J., Ma, J., Chen, Y., Cheng, C., Bao, B., Peng, J., Sejnowski, T. J., Dixon, J. R., & Ecker, J. R.
- Affiliations
- Salk Institute for Biological Studies (US)
- University of California San Diego (US)
- University of Illinois Urbana-Champaign (US)
- Computational Neurobiology Laboratory, Salk Institute for Biological Studies, La Jolla, CA 92037;
- Corresponding author
- Ecker, Joseph R.
- Venue
- Proceedings of the National Academy of Sciences
- Publisher
- National Academy of Sciences
- Published
- 2019-06-24
- Volume
- 116
- Issue
- 28
- Pages
- 14011-14018
- ISSN
- 0027-8424 (ISSN-L)
- 1091-6490
- PMC
- PMC6628819
- OpenAlex
- W2949773289
- Cited by
- 180
- References
- 42
- Citations by year
- 2026: 29 · 2025: 34 · 2024: 27 · 2023: 20 · 2022: 27 · 2021: 31 · 2020: 9 · 2019: 3
- FWCI
- 6.12
- Type
- journal article
- Language
- en
- Open access
- hybrid
- doi.org
- Licence
- Locations
- Proceedings of the National Academy of Sciences (publishedVersion, cc-by-nc-nd)
- Europe PMC (PubMed Central) (publishedVersion, cc-by-nc-nd)
- PubMed Central (publishedVersion, cc-by-nc-nd)
- PubMed (publishedVersion)
- Funders
- Howard Hughes Medical Institute
- National Human Genome Research Institute (R21HG009274)
- National Cancer Institute (P30CA014195)
- Topics
- Life Sciences › Biochemistry, Genetics and Molecular Biology › Molecular Biology › Genomics and Chromatin Dynamics
- Life Sciences › Biochemistry, Genetics and Molecular Biology › Molecular Biology › Single-cell and spatial transcriptomics
- Life Sciences › Biochemistry, Genetics and Molecular Biology › Genetics › Genomic variations and chromosomal abnormalities
- Keywords
- single-cell Hi-C, 3D genome organization, chromatin conformation, cell type clustering, linear convolution, random walks, topologically associating domains, TAD boundaries, data sparsity, low coverage, chromatin structure
- MeSH terms
- Algorithms, Chromatin, Humans, Molecular Conformation, Cluster Analysis, Genome, Computational Biology, Chromosome Structures, Single-Cell Analysis
About these checks
Registry, retraction, Cites and statistics results are computed, not judged, with one exception: a printed reference that no index lists is read once by a model before it counts as a citation error. Claims are extracted by a model and kept only when their quote appears verbatim in the text; each cited source is then checked, with a model’s help, for whether it says what the claim relies on. Those verdicts can be wrong — read the claim’s quote and the cited source before relying on one.
Statistics and arithmetic are recomputed, not judged.
Confidence bands are shown only for fields calibrated on our annotated test set. None is calibrated yet, so no band is shown.
What counts as a claim ›How we measure confidence ›How we check this ›
Are you an author, or do you see a problem with this page? Request a review
Data sources
Bibliographic data: Semantic Scholar, OpenAlex, Crossref.
Contains information from the Semantic Scholar Academic Graph Datasets, made available under the ODC Attribution License (ODC-BY 1.0).
Semantic Scholar’s data is described in: Kinney, R., et al. (2023). The Semantic Scholar Open Data Platform. arXiv:2301.10140.
