

The DOI matches its Crossref record; 64 of the 65 references it cites were found in a registry or an index, and 1 are not checked yet.
Data integration enables global biodiversity synthesis
Open accessAbstract
Significance: As anthropogenic impacts to Earth systems accelerate, biodiversity knowledge integration is urgently required to support responses to underpin a sustainable future. Consolidating information from disparate sources (e.g., community science programs, museums) and data types (e.g., environmental, biological) can connect the biological sciences across taxonomic, disciplinary, geographical, and socioeconomic boundaries. In an analysis of the research uses of the world’s largest cross-taxon biodiversity data network, we report the emerging roles of open-access data aggregation in the development of increasingly diverse, global research. These results indicate a new biodiversity science landscape centered on big data integration, informing ongoing initiatives and the strategic prioritization of biodiversity data aggregation across diverse knowledge domains, including environmental sciences and policy, evolutionary biology, conservation, and human health.
Overview
The claims and statistics of this paper haven’t been checked yet.
Run the check — free, no account needed. It reads the open-access text and checks the sources it cites.
Integrity signals
Registry
Cites
Statistics
Figures
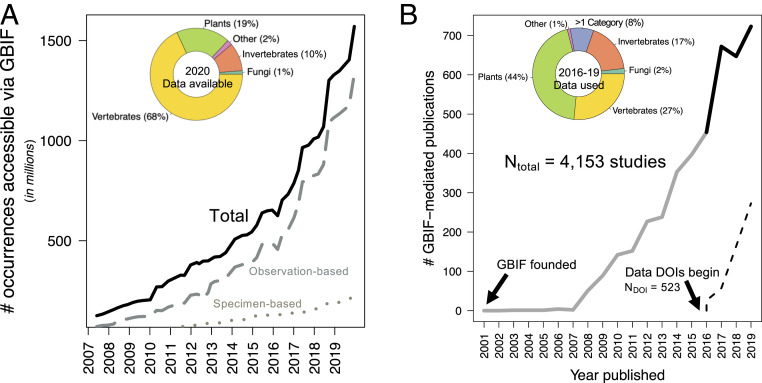
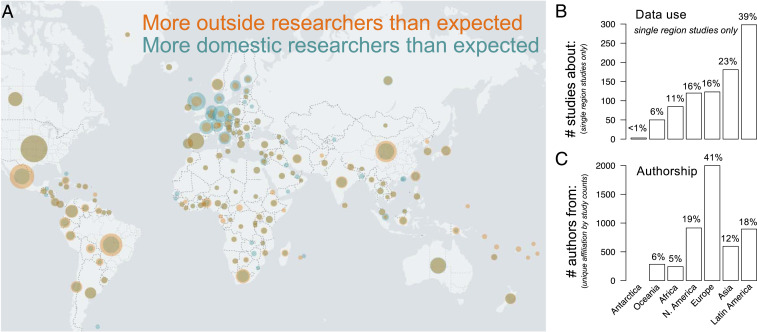
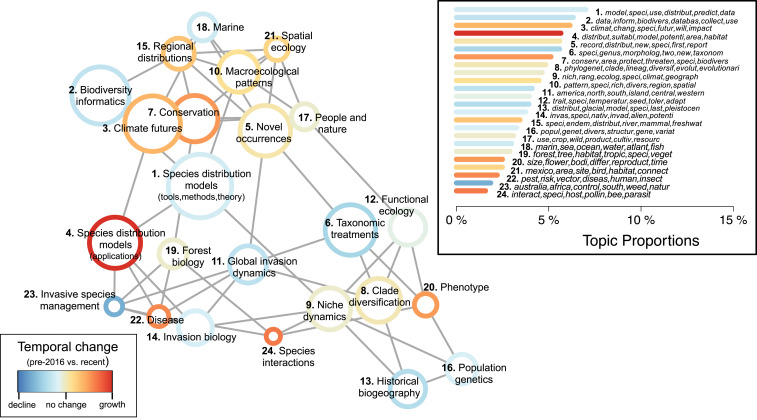
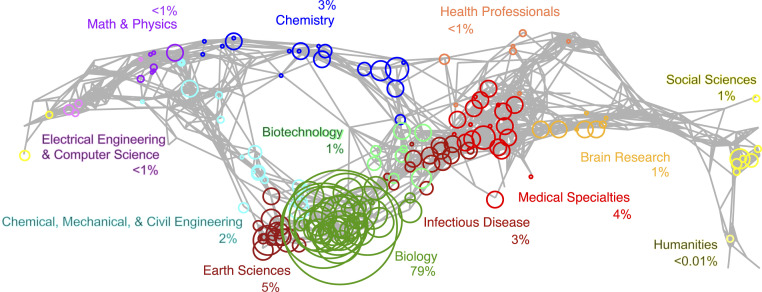
Verification
Claims the paper makes
The claims and statistics of this paper haven’t been checked yet.
Run the check — free, no account needed. It reads the open-access text and checks the sources it cites.
Claims other papers make about this one
Each is checked against this paper’s own text: does it say what the citing paper says it does?
The check wasn’t confident either way, so it gives no verdict — never disputed.
In the citing paper
“Most specimens from tropical regions are housed in European and North American institutions (see figure 2 in Heberling et al. 2021).”
From How many mammal species are there now? Updates and trends in taxonomic, nomenclatural, and geographic knowledge (2025) · cites this paper as Heberling et al. 2021
Experimental — accuracy not yet measured
Self-check
Percentages, sums and reported differences re-computed from the paper’s own numbers.
The self-check needs the paper’s full text.
Citations
Cites
(2003) · Journal of Machine Learning Research · doi:10.5555/944919.944937 · Cited by 32,337
Very high resolution interpolated climate surfaces for global land areas
Hijmans, R. J., Cameron, S. E., Parra, J. L., Jones, P. G., & Jarvis, A. (2005) · International Journal of Climatology · doi:10.1002/joc.1276 · Cited by 19,860
The FAIR Guiding Principles for scientific data management and stewardship
Wilkinson, M. D., Dumontier, M., Aalbersberg, I. J., Appleton, G., Axton, M., Baak, A., Blomberg, N., Boiten, J.-W., da Silva Santos, L. B., Bourne, P. E., et al. (2016) · Scientific Data · doi:10.1038/sdata.2016.18 · Cited by 18,423
Maximum entropy modeling of species geographic distributions
Phillips, S. J., Anderson, R. P., & Schapire, R. E. (2006) · Ecological Modelling · doi:10.1016/j.ecolmodel.2005.03.026 · Cited by 15,396
Blei, D. M., Ng, A. Y., & Jordan, M. I. (2002) · The MIT Press eBooks · doi:10.7551/mitpress/1120.003.0082 · Cited by 12,683
Species Distribution Models: Ecological Explanation and Prediction Across Space and Time
Elith, J., & Leathwick, J. R. (2009) · Annual Review of Ecology, Evolution, and Systematics · doi:10.1146/annurev.ecolsys.110308.120159 · Cited by 6,707
Blei, D. M. (2012) · Communications of the ACM · doi:10.1145/2133806.2133826 · Cited by 5,516
Accelerated modern human–induced species losses: Entering the sixth mass extinction
Ceballos, G., Ehrlich, P. R., Barnosky, A. D., García, A., Pringle, R. M., & Palmer, T. M. (2015) · Science Advances · doi:10.1126/sciadv.1400253 · Cited by 4,220
Promoting an open research culture
Nosek, B. A., Alter, G., Banks, G. C., Borsboom, D., Bowman, S. D., Breckler, S. J., Buck, S., Chambers, C. D., Chin, G., Christensen, G., et al. (2015) · Science · doi:10.1126/science.aab2374 · Cited by 2,708
TRY plant trait database – enhanced coverage and open access
Kattge, J., Bönisch, G., Díaz, S. M., Lavorel, S., Prentice, I. C., Leadley, P., Tautenhahn, S., Werner, G. D. A., Aakala, T., Abedi, M., et al. (2019) · Global Change Biology · doi:10.1111/gcb.14904 · Cited by 2,210
Structural Topic Models for Open‐Ended Survey Responses
Roberts, M. E., Stewart, B., Tingley, D. H., Lucas, C., Leder-Luis, J., Gadarian, S. K., Albertson, B. L., & Rand, D. G. (2014) · American Journal of Political Science · doi:10.1111/ajps.12103 · Cited by 2,103
Börner, K., Chen, C., & Boyack, K. W. (2003) · Annual Review of Information Science and Technology · doi:10.1002/aris.1440370106 · Cited by 1,930
stm : An R Package for Structural Topic Models
Roberts, M. E., Stewart, B. M., & Tingley, D. (2019) · Journal of Statistical Software · doi:10.18637/jss.v091.i02 · Cited by 1,714
Díaz, S. M., Settele, J., Brondízio, E. S., Ngo, H. T., Guèze, M., Agard, J. B. R., Arneth, A., Balvanera, P., Brauman, K. A., Butchart, S. H. M., et al. (2019) · Americanae (AECID Library) · Cited by 1,359
Darwin Core: An Evolving Community-Developed Biodiversity Data Standard
Wieczorek, J. R., Bloom, D., Guralnick, R., Blum, S., Döring, M., Giovanni, R. D., Robertson, T., & Vieglais, D. (2012) · PLoS ONE · doi:10.1371/journal.pone.0029715 · Cited by 1,300
Summary for policymakers of the global assessment report on biodiversity and ecosystem services
IPBES (2019) · UWE Research Repository (UWE Bristol) · doi:10.5281/zenodo.3553458 · Cited by 1,132
New developments in museum-based informatics and applications in biodiversity analysis
Graham, C. H., Ferrier, S., Huettmann, F., Moritz, C. C., & Peterson, A. T. (2004) · Trends in Ecology & Evolution · doi:10.1016/j.tree.2004.07.006 · Cited by 1,131
Summary for policymakers of the global assessment report on biodiversity and ecosystem services
IPBES (2019) · Zenodo · doi:10.5281/zenodo.3553579 · Cited by 1,129
A standard protocol for reporting species distribution models
Zurell, D., Franklin, J., König, C., Bouchet, P. J., Dormann, C. F., Elith, J., Fandós, G., Feng, X., Guillera‐Arroita, G., Guisan, A., et al. (2020) · Ecography · doi:10.1111/ecog.04960 · Cited by 1,025
Big data and the future of ecology
Hampton, S. E., Strasser, C. A., Tewksbury, J. J., Gram, W. K., Budden, A. E., Batcheller, A. L., Duke, C. S., & Porter, J. H. (2013) · Frontiers in Ecology and the Environment · doi:10.1890/120103 · Cited by 930
Taxonomic bias in biodiversity data and societal preferences
Troudet, J., Grandcolas, P., Blin, A., Vignes‐Lebbe, R., & Legendre, F. (2017) · Scientific Reports · doi:10.1038/s41598-017-09084-6 · Cited by 902
Bongaarts, J. (2019) · Population and Development Review · doi:10.1111/padr.12283 · Cited by 859
Contribution of citizen science towards international biodiversity monitoring
Chandler, M., See, L., Copas, K., Bonde, A. M., López, B., Danielsen, F., Legind, J. K., Masinde, S., Miller-Rushing, A., Newman, G., et al. (2017) · Biological Conservation · doi:10.1016/j.biocon.2016.09.004 · Cited by 798
Benson, D. A., Karsch‐Mizrachi, I., Lipman, D. J., Ostell, J., & Wheeler, D. L. (2007) · Nucleic Acids Research · doi:10.1093/nar/gkm929 · Cited by 776
Spatial bias in the GBIF database and its effect on modeling species' geographic distributions
Beck, J., Böller, M., Erhardt, A., & Schwanghart, W. (2013) · Ecological Informatics · doi:10.1016/j.ecoinf.2013.11.002 · Cited by 772
Multidimensional biases, gaps and uncertainties in global plant occurrence information
Meyer, C., Weigelt, P., & Kreft, H. (2016) · Ecology Letters · doi:10.1111/ele.12624 · Cited by 606
Corporate funding and ideological polarization about climate change
Farrell, J. (2015) · Proceedings of the National Academy of Sciences · doi:10.1073/pnas.1509433112 · Cited by 606
Integrating biodiversity distribution knowledge: toward a global map of life
Jetz, W., McPherson, J. M., & Guralnick, R. (2011) · Trends in Ecology & Evolution · doi:10.1016/j.tree.2011.09.007 · Cited by 590
Global biotic interactions: An open infrastructure to share and analyze species-interaction datasets
Poelen, J. H., Simons, J. D., & Mungall, C. (2014) · Ecological Informatics · doi:10.1016/j.ecoinf.2014.08.005 · Cited by 384
Maldonado, C., Molina, C. I., Zizka, A., Persson, C., Taylor, C. M., Castillo, J. A., Chilquillo, E., Rønsted, N., & Antonelli, A. (2015) · Global Ecology and Biogeography · doi:10.1111/geb.12326 · Cited by 374
How Global Is the Global Biodiversity Information Facility?
Yesson, C., Brewer, P. W., Sutton, T., Caithness, N., Pahwa, J. S., Burgess, M., Gray, W. A., White, R. J., Jones, A. C., Bisby, F. A., et al. (2007) · PLoS ONE · doi:10.1371/journal.pone.0001124 · Cited by 369
Global biodiversity monitoring: From data sources to Essential Biodiversity Variables
Proença, V. M., Martin, L. J., Pereira, H. M., Fernández, M., McRae, L., Belnap, J., Böhm, M., Brummitt, N. A., García‐Moreno, J., Gregory, R. D., et al. (2016) · Biological Conservation · doi:10.1016/j.biocon.2016.07.014 · Cited by 326
A checklist for maximizing reproducibility of ecological niche models
Feng, X., Park, D. S., Walker, C., Peterson, A. T., Merow, C., & Papeş, M. (2019) · Nature Ecology & Evolution · doi:10.1038/s41559-019-0972-5 · Cited by 323
Digitization and the Future of Natural History Collections
Hedrick, B. P., Heberling, J. M., Meineke, E. K., Turner, K. G., Grassa, C. J., Park, D. S., Kennedy, J., Clarke, J. A., Cook, J. A., Blackburn, D. C., et al. (2020) · BioScience · doi:10.1093/biosci/biz163 · Cited by 306
Self-citationThe history and impact of digitization and digital data mobilization on biodiversity research
Nelson, G., & Ellis, S. (2019) · Philosophical Transactions of the Royal Society B: Biological Sciences · doi:10.1098/rstb.2017.0391 · Cited by 304
Interoperability of Biodiversity Databases: Biodiversity Information on Every Desktop
Edwards, J. L., Lane, M. A., & Nielsen, E. S. (2000) · Science · doi:10.1126/science.289.5488.2312 · Cited by 293
Design and Update of a Classification System: The UCSD Map of Science
Börner, K., Klavans, R., Patek, M., Zoss, A. M., Biberstine, J. R., Light, R. P., Larivière, V., & Boyack, K. W. (2012) · PLoS ONE · doi:10.1371/journal.pone.0039464 · Cited by 249
Lendemer, J. C., Thiers, B. M., Monfils, A., Zaspel, J. M., Ellwood, E. R., Bentley, A. C., LeVan, K. E., Bates, J. M., Jennings, D., Contreras, D. L., et al. (2019) · BioScience · doi:10.1093/biosci/biz140 · Cited by 240
Bakker, F. T., Antonelli, A., Clarke, J. A., Cook, J. A., Edwards, S. V., Ericson, P. G. P., Faurby, S., Ferrand, N., Gelang, M., Gillespie, R. G., et al. (2020) · PeerJ · doi:10.7717/peerj.8225 · Cited by 228
Collections‐based science in the 21st Century
Funk, V. A. (2018) · Journal of Systematics and Evolution · doi:10.1111/jse.12315 · Cited by 223
iNaturalist Research-grade Observations
contributors, I. (2012) · Global Biodiversity Information Facility · doi:10.15468/ab3s5x · Cited by 212
Automated content analysis: addressing the big literature challenge in ecology and evolution
Nunez‐Mir, G. C., Iannone, B. V., Pijanowski, B. C., Kong, N., & Fei, S. (2016) · Methods in Ecology and Evolution · doi:10.1111/2041-210x.12602 · Cited by 195
Research applications of primary biodiversity databases in the digital age
Damerow, J., Brenskelle, L., Barve, N., Soltis, P. S., Sierwald, P., Bieler, R., LaFrance, R., Ariño, A. H., & Guralnick, R. (2019) · PLoS ONE · doi:10.1371/journal.pone.0215794 · Cited by 184
Macroecology in the age of Big Data – Where to go from here?
Wüest, R. O., Zimmermann, N. E., Zurell, D., Alexander, J. M., Fritz, S. A., Hof, C., Kreft, H., Normand, S., Cabral, J. S., Székely, E., et al. (2019) · Journal of Biogeography · doi:10.1111/jbi.13633 · Cited by 168
Approaches to estimating the universe of natural history collections data
Ariño, A. H. (2010) · Biodiversity Informatics · doi:10.17161/bi.v7i2.3991 · Cited by 167
Biodiversity data integration—the significance of data resolution and domain
König, C., Weigelt, P., Schrader, J., Taylor, A., Kattge, J., & Kreft, H. (2019) · PLoS Biology · doi:10.1371/journal.pbio.3000183 · Cited by 162
What we (don't) know about global plant diversity
Cornwell, W. K., Pearse, W. D., Dalrymple, R. L., & Zanne, A. E. (2019) · Ecography · doi:10.1111/ecog.04481 · Cited by 145
Big data for forecasting the impacts of global change on plant communities
Franklin, J., Serra-Diaz, J. M., Syphard, A. D., & Regan, H. M. (2016) · Global Ecology and Biogeography · doi:10.1111/geb.12501 · Cited by 113
Troia, M. J., & McManamay, R. A. (2016) · Ecology and Evolution · doi:10.1002/ece3.2225 · Cited by 108
Range geometry and socio‐economics dominate species‐level biases in occurrence information
Meyer, C., Jetz, W., Guralnick, R., Fritz, S. A., & Kreft, H. (2016) · Global Ecology and Biogeography · doi:10.1111/geb.12483 · Cited by 83
Digitization of museum collections holds the potential to enhance researcher diversity
Drew, J., Moreau, C. S., & Stiassny, M. L. J. (2017) · Nature Ecology & Evolution · doi:10.1038/s41559-017-0401-6 · Cited by 83
Brooks, T. M., Akçakaya, H. R., Burgess, N. D., Butchart, S. H. M., Hilton-Taylor, C., Hoffmann, M., Juffe-Bignoli, D., Kingston, N., MacSharry, B., Parr, M., et al. (2016) · Scientific Data · doi:10.1038/sdata.2016.7 · Cited by 81
Troudet, J., Vignes‐Lebbe, R., Grandcolas, P., & Legendre, F. (2018) · Systematic Biology · doi:10.1093/sysbio/syy044 · Cited by 79
FAIR Data and Services in Biodiversity Science and Geoscience
Lannom, L., Koureas, D., & Hardisty, A. (2019) · Data Intelligence · doi:10.1162/dint_a_00034 · Cited by 71
Connecting data and expertise: a new alliance for biodiversity knowledge
Hobern, D., Baptiste, B. L. G., Copas, K., Guralnick, R., Hahn, A., van Huis, E., Kim, E.-S., McGeoch, M. A., Naicker, I., Navarro, L. M., et al. (2019) · Biodiversity Data Journal · doi:10.3897/bdj.7.e33679 · Cited by 68
Self-citationPeterson, A. T., & Soberón, J. M. (2012) · Plant Biosystems - An International Journal Dealing with all Aspects of Plant Biology · doi:10.1080/11263504.2012.740083 · Cited by 60
Cobb, N. S., Gall, L. F., Zaspel, J. M., Dowdy, N. J., McCabe, L. M., & Kawahara, A. Y. (2019) · PeerJ · doi:10.7717/peerj.8086 · Cited by 54
Anderson, R. P., Araújo, M. B., Guisan, A., Lobo, J. M., Martínez‐Meyer, E., Peterson, A. T., & Soberón, J. M. (2020) · Frontiers of Biogeography · doi:10.21425/f5fbg47839 · Cited by 54
Smith, B. E., Johnston, M. K., & Lücking, R. (2016) · PLoS ONE · doi:10.1371/journal.pone.0151232 · Cited by 48
The Necessity, Promise and Challenge of Automated Biodiversity Surveys
Kitzes, J. A., & Schricker, L. (2019) · Environmental Conservation · doi:10.1017/s0376892919000146 · Cited by 33
Observation.org, Nature data from around the World
Observation.org (2018) · Global Biodiversity Information Facility · doi:10.15468/5nilie · Cited by 26
EOD – eBird Observation Dataset
Imani, J., Audette, C., Auer, T., Barker, S. E., Barry, J. H., Charnoky, M., Crowley, C., Curtis, J., Davies, I., Davis, C., et al. (2010) · Global Biodiversity Information Facility · doi:10.15468/aomfnb · Cited by 22
Origins of SARS‐CoV‐1 and SARS‐CoV‐2 are often poorly explored in leading publications
Wenzel, J. W. (2020) · Cladistics · doi:10.1111/cla.12425 · Cited by 21
Advancing the Catalogue of the World’s Natural History Collections
Hobern, D., Paul, D. L., Robertson, T., Groom, Q., Thiers, B. M., Asase, A., Luo, M., Semal, P., Woodburn, M., & Zschuschen, E. (2020) · Biodiversity Information Science and Standards · doi:10.3897/biss.4.59324 · Cited by 5
Data and code from "Data integration enables global biodiversity synthesis"
Heberling, J. M. (2020) · Zenodo (CERN European Organization for Nuclear Research) · doi:10.5281/zenodo.4009481 · Cited by 1
Self-citation
Cited by
Sorted by citations
Cecco, G. J. D., Barve, V., Belitz, M., Stucky, B. J., Guralnick, R., & Hurlbert, A. (2021) · BioScience · doi:10.1093/biosci/biab093 · Cited by 309
Davis, C. “. (2022) · Trends in Ecology & Evolution · doi:10.1016/j.tree.2022.11.015 · Cited by 198
Medicinal plants meet modern biodiversity science
Davis, C. “., & Choisy, P. (2024) · Current Biology · doi:10.1016/j.cub.2023.12.038 · Cited by 219
Card, D. C., Shapiro, B., Giribet, G., Moritz, C., & Edwards, S. V. (2021) · Annual Review of Genetics · doi:10.1146/annurev-genet-071719-020506 · Cited by 151
Wang, Z., Wang, T., Zhang, X., Wang, J., Yang, Y., Sun, Y., Guo, X., Wu, Q., Nepovimová, E., Watson, A. E., et al. (2024) · The Science of The Total Environment · doi:10.1016/j.scitotenv.2024.173377 · Cited by 144
Metadata
- Authors
- Heberling, J. M., Miller, J. T., Noesgaard, D., Weingart, S. B., & Schigel, D.
- Affiliations
- Carnegie Museum of Natural History (US)
- Global Biodiversity Information Facility (DK)
- Carnegie Mellon University (US)
- Corresponding author
- Heberling, J. Mason
- Venue
- Proceedings of the National Academy of Sciences
- Publisher
- National Academy of Sciences
- Published
- 2021-02
- Volume
- 118
- Issue
- 6
- ISSN
- 0027-8424 (ISSN-L)
- 1091-6490
- PMC
- PMC8017944
- OpenAlex
- W3127515314
- Cited by
- 380
- References
- 65
- Citations by year
- 2026: 81 · 2025: 76 · 2024: 72 · 2023: 66 · 2022: 64 · 2021: 21
- FWCI
- 50.42
- Type
- journal article
- Language
- en
- Open access
- hybrid
- doi.org
- Licence
- Locations
- Proceedings of the National Academy of Sciences (publishedVersion, cc-by)
- PubMed Central (publishedVersion, cc-by)
- PubMed (publishedVersion)
- Topics
- Physical Sciences › Computer Science › Information Systems › Research Data Management Practices
- Physical Sciences › Environmental Science › Ecological Modeling › Species Distribution and Climate Change
- Physical Sciences › Environmental Science › Nature and Landscape Conservation › Ecology and Vegetation Dynamics Studies
- Keywords
- biodiversity data integration, GBIF, citizen science, species distribution modeling, macroecology
- MeSH terms
- Animals, Classification, Humans, Museums, Databases, Factual, Biodiversity
About these checks
Registry, retraction, Cites and statistics results are computed, not judged, with one exception: a printed reference that no index lists is read once by a model before it counts as a citation error. Claims are extracted by a model and kept only when their quote appears verbatim in the text; each cited source is then checked, with a model’s help, for whether it says what the claim relies on. Those verdicts can be wrong — read the claim’s quote and the cited source before relying on one.
Statistics and arithmetic are recomputed, not judged.
Confidence bands are shown only for fields calibrated on our annotated test set. None is calibrated yet, so no band is shown.
What counts as a claim ›How we measure confidence ›How we check this ›
Are you an author, or do you see a problem with this page? Request a review
