

The DOI matches its Crossref record; 55 of the 55 references it cites were found in a registry or an index.
The impact of a poverty reduction intervention on infant brain activity
Open accessAbstract
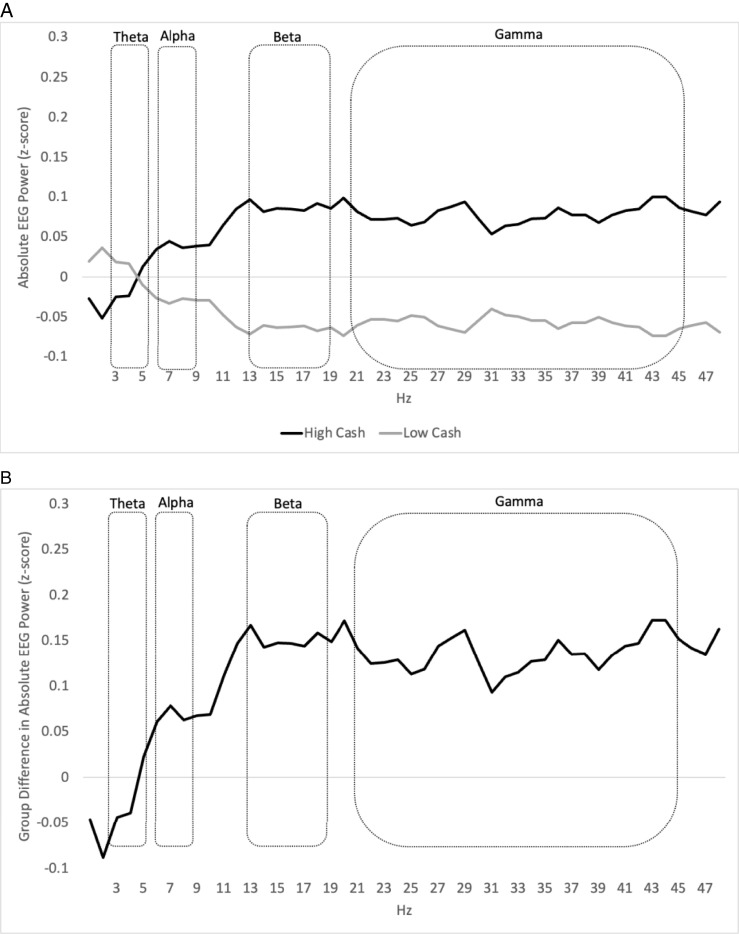
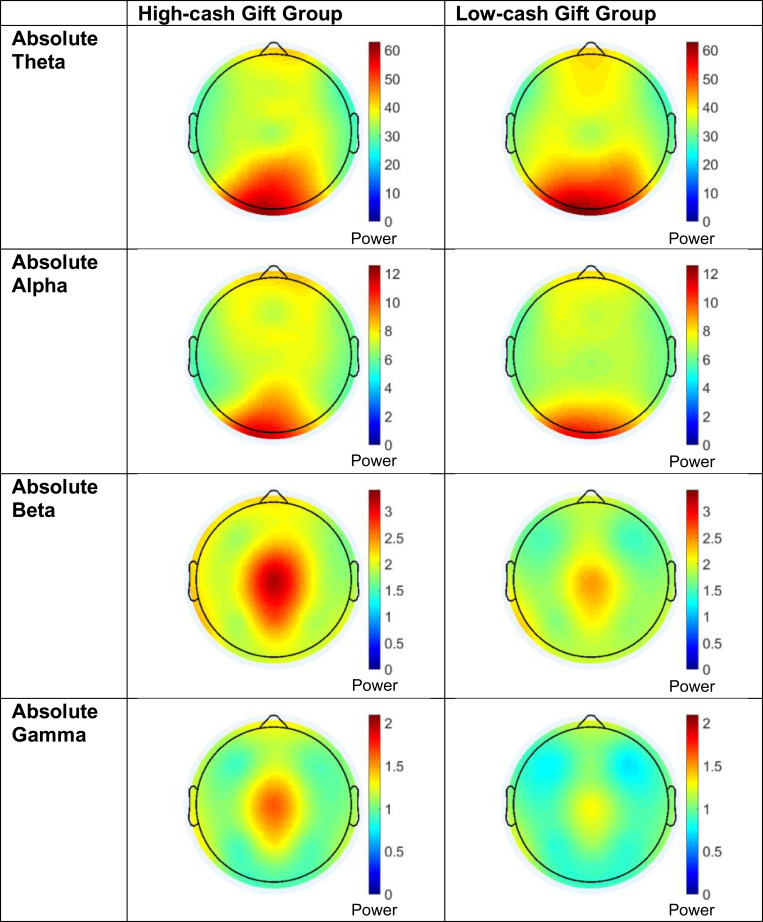
= 435). We hypothesized that infants in the high-cash gift group would have greater EEG power in the mid- to high-frequency bands and reduced power in a low-frequency band compared with infants in the low-cash gift group. Indeed, infants in the high-cash gift group showed more power in high-frequency bands. Effect sizes were similar in magnitude to many scalable education interventions, although the significance of estimates varied with the analytic specification. In sum, using a rigorous randomized design, we provide evidence that giving monthly unconditional cash transfers to mothers experiencing poverty in the first year of their children's lives may change infant brain activity. Such changes reflect neuroplasticity and environmental adaptation and display a pattern that has been associated with the development of subsequent cognitive skills.
Overview
The claims and statistics of this paper haven’t been checked yet.
Run the check — free, no account needed. It reads the open-access text and checks the sources it cites.
Integrity signals
Registry
Cites
Statistics
Figures
Verification
Claims the paper makes
The claims and statistics of this paper haven’t been checked yet.
Run the check — free, no account needed. It reads the open-access text and checks the sources it cites.
Claims other papers make about this one
Each is checked against this paper’s own text: does it say what the citing paper says it does?
The source backs part of the claim, not all of it — or backs it for a different population, condition or comparison.
In the citing paper
“This is supported by recent evidence fromTroller-Renfree et al. (2022), who find that a regular income boost improves children's brain development in their first year of life.”
From Educational Inequality* (2022) · cites this paper as Troller-Renfree et al. (2022)
Experimental — accuracy not yet measured
Self-check
Percentages, sums and reported differences re-computed from the paper’s own numbers.
The self-check needs the paper’s full text.
Citations
Cites
Bootstrap-Based Improvements for Inference With Clustered Errors
Cameron, A. C., Gelbach, J. B., & Miller, D. L. (2008) · Review of Economics and Statistics · doi:10.1162/rest.90.3.414 · Cited by 4,417
Socioeconomic disadvantage and child development
McLoyd, V. C. (1998) · American Psychologist · doi:10.1037/0003-066x.53.2.185 · Cited by 3,763
Experimental Analysis of Neighborhood Effects
Kling, J. R., Liebman, J. B., & Katz, L. F. (2007) · Econometrica · doi:10.1111/j.1468-0262.2007.00733.x · Cited by 2,719
How Much Does Childhood Poverty Affect the Life Chances of Children?
Duncan, G. J., Yeung, W. J., Jeanne Brooks-gunn, B., & Smith, J. R. (1998) · American Sociological Review · doi:10.2307/2657556 · Cited by 1,616
Self-citationConsequences of growing up poor
Frasch, K. M. (1999) · Children and Youth Services Review · doi:10.1016/s0190-7409(99)00059-6 · Cited by 1,604
Family income, parental education and brain structure in children and adolescents
Noble, K. G., Houston, S. M., Brito, N. H., Bartsch, H., Kan, E., Kuperman, J. M., Akshoomoff, N., Amaral, D. G., Bloss, C. S., Libiger, O., et al. (2015) · Nature Neuroscience · doi:10.1038/nn.3983 · Cited by 1,423
Self-citationInterpreting effect sizes of education interventions
Kraft, M. A. (2020) · Educational Researcher · doi:10.3102/0013189x20912798 · Cited by 1,281
Socioeconomic gradients predict individual differences in neurocognitive abilities.
Noble, K. G., McCandliss, B. D., & Farah, M. J. (2007) · Developmental Science · doi:10.1111/j.1467-7687.2007.00600.x · Cited by 1,041
Self-citationNeurocognitive correlates of socioeconomic status in kindergarten children
Noble, K. G., Norman, M. F., & Farah, M. J. (2005) · Developmental Science · doi:10.1111/j.1467-7687.2005.00394.x · Cited by 1,038
Self-citationEarly childhood poverty and adult attainment, behavior, and health
Duncan, G. J., Ziol-Guest, K. M., & Kalil, A. (2010) · Child Development · doi:10.1111/j.1467-8624.2009.01396.x · Cited by 859
Self-citation
Research works printed but not linked: 1
- K. Magnuson Baby’s First Years (BFY). Baseline Public Data 2018-2019. Inter-university Consortium for Political and Social Research (2020). doi.org/10.3886/ICPSR37871.v2. Deposited 16 November 2020. · DOI
Cited by
Sorted by citations
Exploring the Role of Neuroplasticity in Development, Aging, and Neurodegeneration
Marzola, P., Melzer, T., Pavesi, E., Gil-Mohapel, J., & Brocardo, P. S. (2023) · Brain Sciences · doi:10.3390/brainsci13121610 · Cited by 281
Tan, E., Troller‐Renfree, S. V., Morales, S., Buzzell, G. A., McSweeney, M., Antúnez, M., & Fox, N. A. (2024) · Developmental Cognitive Neuroscience · doi:10.1016/j.dcn.2024.101404 · Cited by 193
Self-citationO’Connor, R. C., Worthman, C. M., Abanga, M. A., Athanassopoulou, N., Boyce, N., Chan, L. F., Christensen, H. M., Das‐Munshi, J., Downs, J. L., Koenen, K. C., et al. (2023) · The Lancet Psychiatry · doi:10.1016/s2215-0366(23)00058-5 · Cited by 139
Weissman, D. G., Hatzenbuehler, M. L., Cikara, M., Barch, D. M., & McLaughlin, K. A. (2023) · Nature Communications · doi:10.1038/s41467-023-37778-1 · Cited by 107
Prenatal Stress and the Developing Brain: Postnatal Environments Promoting Resilience
Nolvi, S., Merz, E. C., Kataja, E., & Parsons, C. E. (2022) · Biological Psychiatry · doi:10.1016/j.biopsych.2022.11.023 · Cited by 124
Metadata
- Authors
- Troller-Renfree, S. V., Costanzo, M. A., Duncan, G. J., Magnuson, K., Gennetian, L. A., Yoshikawa, H., Halpern-Meekin, S., Fox, N. A., & Noble, K. G.
- Affiliations
- Department of Biobehavioral Sciences, Teachers College, Columbia University, New York, NY 10027
- University of Wisconsin–Madison (US)
- University of California, Irvine (US)
- Duke University (US)
- New York University (US)
- School of Human Ecology and LaFollette School of Public Affairs, University of Wisconsin–Madison, Madison, WI 53706
- University of Maryland, College Park (US)
- Columbia University (US)
- Corresponding author
- Duncan, Greg J.
- Noble, Kimberly G.
- ORCID
- Venue
- Proceedings of the National Academy of Sciences
- Publisher
- National Academy of Sciences
- Published
- 2022-01-24
- Volume
- 119
- Issue
- 5
- ISSN
- 0027-8424 (ISSN-L)
- 1091-6490
- PMC
- PMC8812534
- OpenAlex
- W4207040139
- Cited by
- 300
- References
- 55
- Citations by year
- 2026: 29 · 2025: 51 · 2024: 84 · 2023: 87 · 2022: 47
- FWCI
- 78.02
- Type
- journal article
- Language
- en
- Open access
- hybrid
- doi.org
- Licence
- Locations
- Proceedings of the National Academy of Sciences (publishedVersion, cc-by)
- PubMed Central (publishedVersion, cc-by)
- PubMed (publishedVersion)
- eScholarship (California Digital Library) (submittedVersion, cc-by)
- Issue Lab (Candid) (submittedVersion, cc-by)
- Funders
- HHS | National Institutes of Health (R01HD087384, K99HD104923)
- Annie E. Casey Foundation (214.0183)
- Andrew and Julie Klingenstein Fund (N/A)
- Arrow Impact (N/A)
- Bezos Family Foundation (N/A)
- Bill and Melinda Gates Foundation (OPP1185312)
- Bill Hammack and Janice Parmelee (N/A)
- Blue Cross and Blue Shield of Louisiana Foundation (N/A)
- Brady Education Fund (N/A)
- Silicon Valley Community Foundation (SVCF)/Chan Zuckerberg Initiative (2017-177918)
- Charles and Lynn Schusterman Family Foundation (13080)
- Child Welfare Fund (13-1624202)
- Ester A. and Joseph Klingenstein Fund (N/A)
- Ford Foundation (0170-0832)
- Greater New Orleans Foundation (N/A)
- Heising-Simons Foundation (542569)
- Jacobs Foundation (102535)
- JPB Foundation (1132)
- J-Pal North America (S5341)
- New York City Mayor's Office for Economic Research (CT1 069 20201415397)
- Office of Planning, Research, and Evaluation (RHD087384A)
- Perigee Fund (N/A)
- Robert Wood Johnson Foundation (75592)
- Sherwood Foundation (4288)
- Valhalla Foundation (N/A)
- Weitz Family Foundation: Feed the Body, Feed the Mind, Feed the Spirit (N/A)
- W. K. Kellogg (P3031579)
- Three Anonymous Donors (N/A)
- Topics
- Social Sciences › Development › Poverty, Education, and Child Welfare
- Health Sciences › Nursing › Nutrition and Dietetics › Child Nutrition and Water Access
- Social Sciences › Education › Early Childhood Education and Development
- Keywords
- poverty reduction, unconditional cash transfers, infant brain activity, EEG spectral power, neuroplasticity, maternal poverty, early childhood, cognitive development, environmental enrichment
- MeSH terms
- Brain, Female, Food Supply, Humans, Income, Infant, Male, Mothers, Nutritional Status, Poverty, Rural Population
About these checks
Registry, retraction, Cites and statistics results are computed, not judged, with one exception: a printed reference that no index lists is read once by a model before it counts as a citation error. Claims are extracted by a model and kept only when their quote appears verbatim in the text; each cited source is then checked, with a model’s help, for whether it says what the claim relies on. Those verdicts can be wrong — read the claim’s quote and the cited source before relying on one.
Statistics and arithmetic are recomputed, not judged.
Confidence bands are shown only for fields calibrated on our annotated test set. None is calibrated yet, so no band is shown.
What counts as a claim ›How we measure confidence ›How we check this ›
Are you an author, or do you see a problem with this page? Request a review
